R E S E A R C H A R T I C L E
Open Access
Diffusion tensor MR imaging characteristics
of cerebral white matter development in
fetal pigs
Wenxu Qi
1, Song Gao
2, Caixia Liu
3, Gongyu Lan
1, Xue Yang
3and Qiyong Guo
1*Abstract
Background:The purpose of this study was to investigate the anisotropic features of fetal pig cerebral white matter (WM) development by magnetic resonance diffusion tensor imaging, and to evaluate the developmental status of cerebral WM in different anatomical sites at different times.
Methods:Fetal pigs were divided into three groups according to gestational age: E69 (n= 8), E85 (n= 11), and E114 (n= 6). All pigs were subjected to conventional magnetic resonance imaging (MRI) and diffusion tensor imaging using a GE Signa 3.0 T MRI system (GE Healthcare, Sunnyvale, CA, USA). Fractional anisotropy (FA) was measured in deep WM structures and peripheral WM regions. After the MRI scans,the animals were sacrificed and pathology sections were prepared for hematoxylin & eosin (HE) staining and luxol fast blue (LFB) staining. Data were statistically analyzed with SPSS version 16.0 (SPSS, Chicago, IL, USA). A P-value < 0.05 was considered statistically significant. Mean FA values for each subject region of interest (ROI), and deep and peripheral WM at different gestational ages were calculated, respectively, and were plotted against gestational age with linear correlation statistical analyses. The differences of data were analyzed with univariate ANOVA analyses.
Results:There were no significant differences in FAs between the right and left hemispheres. Differences were observed between peripheral WM and deep WM in fetal brains. A significant FA growth with increased gestational age was found when comparing E85 group and E114 group. There was no difference in the FA value of deep WM between the E69 group and E85 group. The HE staining and LFB staining of fetal cerebral WM showed that the development from the E69 group to the E85 group, and the E85 group to the E114 group corresponded with myelin gliosis and myelination, respectively.
Conclusions:FA values can be used to quantify anisotropy of the different cerebral WM areas. FA values did not change significantly between 1/2 way and 3/4 of the way through gestation but was then increased dramatically at term, which could be explained by myelin gliosis and myelination ,respectively.
Background
From a simple tubular structure to a mature organ with complete function, the development and evolution of fetal brain is precise and complicated. White matter (WM) development of the intrauterine prenatal fetal brain is closely associated with a variety of nervous and mental diseases in the neonatal phase, early childhood, adolescence, and adulthood [1–10]. By studying and clarifying the intrauterine developmental patterns of
cerebral WM before birth, and deciphering the anatom-ical and microstructural characteristics of fetal brain at different stages of development, we can not only analyze the procedures and steps of fetal brain developmental processes, but also study brain diseases related to brain development. Diseases such as perinatal brain injury and neonatal hypoxic-ischemic encephalopathy are closely re-lated to cerebral white matter (WM) development [2]. Pigs are the standard animal model for studying neonatal hypoxic-ischemic encephalopathy (HIE) [11–14]. How-ever, the mechanisms of normal fetal cerebral WM devel-opment have not been reported.
* Correspondence:[email protected]
1Department of Radiology, Shengjing Hospital, China Medical University, Shenyang 110004, People’s Republic of China
Full list of author information is available at the end of the article
Diffusion tensor imaging (DTI) can quantitatively determine the parameters related to the movement direction of water molecules in the cerebral WM. DTI can not only quantitatively analyze the micro-structure of cerebral WM, but also has the advantages of three-dimensional imaging of the cerebral WM fiber [15].
The current study utilized conventional MRI T2 struc-tural imaging and DTI to measure the various specific characteristic FA values of different anatomical parts of the cerebral WM in fetal and neonatal pig brain, and used HE staining and LFB (Luxol Fast Blue) myelin staining to study the developmental changes in cerebral WM tissues, in order to determine the correlation be-tween imaging and histology. The study allows prelimin-ary exploration of the intrauterine developmental rules of pig cerebral WM at different stages.
Intrauterine prenatal fetal cerebral WM develop-ment is closely related to a variety of neurological and psychiatric diseases at the neonatal phase, early childhood, adolescence, and adulthood [1–10]. To study and clarify the developmental patterns of cere-bral WM in the uterus before birth, and to clarify the anatomical and microstructure characteristics of fetal brain during different stages of development, we can not only analyze the procedures and steps of fetal brain developmental processes, but also study the brain diseases related to development. Diseases such as perinatal brain injury and neonatal hypoxic-ischemic encephalopathy are closely related to cere-bral WM development [2].
The pig is the standard animal model for studying neonatal hypoxic-ischemic encephalopathy (HIE) [11–14]. However, studies investigating the normal fetal cerebral WM development have not been reported.
The current study utilized conventional MRI T2 struc-tural imaging and DTI to measure the various specific characteristics FA values of different anatomical parts of the cerebral WM in fetal and neonatal pig brain, and used HE staining and FLB myelin staining to study the developmental changes in cerebral WM tissue, to deter-mine the correlation between imaging and histology, thus allowing a preliminary exploration of the intrauter-ine developmental rules of pig cerebral WM at different stages.
Methods
Animal preparation
This study was conducted on the approval of Ethical Committee at Shengjing Hospital, China Medical University (Permit Number:2014PS153K). Through caesarean section, eight fetal pigs with gestational age of 69 days, and 11 fetal pigs with gestational age of 85 days were obtained from healthy pregnant pigs. Another six neonatal pigs from the
same mother pig, with gestational age of 114 days, were also included in the current study. All the pigs were divided into three groups based on their gestational age, which were named as the E69 group, E85 group, and E114 group.
MRI scanning
MRI scanning was carried out using a 3.0-T MR system (Signa Excite HD; GE Medical Systems, Milwaukee, Wis), with rat coil (5 cm in diameter) used for the E69 and E85 groups, and knee joint coil (15 cm in diameter) used for the E114 group. The conventional T2WI scan parameters were: TR5000 ms, TE80 ms, with layer thick-ness of 2 mm and interval of 0.3 mm. The SE-EPI se-quence was utilized for DTI examination with scanning parameters as follows: TR8000 ms, TE100 ms; scan matrix: 128*128; Field of View: 4–6 cm; layer thickness of 2 mm, and interval of 0.3 mm. Scanning was carried out twice with a diffusion weighting coefficient b value of 0/600 s/mm2 and a gradient field intensity applied at 25 directions. The scanning time was about 12 min.
Specimen preparation
After the MRI examination, the animals were sacrificed immediately with the whole brain quickly collected, then immersed, and fixed in 4% formalin solution. After 72-h fixation, the right and left hemispheres of the specimen were separated, followed by cross-sectional sampling, then embedded in paraffin and sliced.
Regular HE staining
The morphology, quantity and the density of the glia cells, and the density of nervous fibers were evaluated by HE staining of sections. The neurons and glial cells were counted in highpower field (×200) .7 anatomic sites of the deep brain white matter and 4 anatomical sites of superficial brain white matter were selected for each of the brain specimens.
LFB myelin specific staining
The method for LFB staining was: (1) Paraffin slice and alcohol dehydration; (2) staining with LFB, and incuba-tion overnight with 1% LFB dye at 60 °C; (3) differential fixation with 70% alcohol immersion and 0.05% lithium carbonate; (4) washing in water; (5) HE counterstaining; and (6) mounting. The myelin sheaths stained blue using this method.
Post-processing and analysis of the images
Images with conventional scanning
separately, with further discussions in cases of differing opinions.
DTI results
Data processing was carried out with GE Workstation Function Tool software (GE Healthcare). Regions of interest (ROIs) in the T2WI map, Colored orientation map, Average DC map and FA map were defined by two experienced radiologists who were not familiar with the gestational age of the study animals, with the FA values of each ROI measured. The ROIs are outlined on T2WI maps,also can be superimposed on the Colored orienta-tion maps, Average DC maps and FA maps at the same time on GE Functool station.
The measuring method was the size of the ROI at a point region of 1 mm2, which was moved within the anatomical position to obtain the highest FA value. The selected ROIs included deep cerebral WM including the anterior limb internal capsule (ALIC), the posterior limb internal capsule (PLIC), the genu corporis callosi (GCC), the splenium corporis callosi (SCC), the periventricular white matter (PV), the optic radiation (OR), the corona radiate (CR), and the superficial white matter regions includ-ing the frontal lobe (FL), temporal lobe (TL), parietal lobe (PL), and occipital lobe (OL), as shown in Fig. 1. Measure-ments were of both sides of the brain.
Statistical analyses
SPSS version 15 (SPSS) was used for data analyses, and
P< 0.05 was considered statistically significant. All data were expressed as mean ± standard deviation (M ± SD), with paired t-tests used to analyze whether there was a significant difference in the FA values of the same site between the left and right hemispheres. Spearman’s rank correlation analysis was used to analyze the correlation coefficient of the gestational age and FA values in differ-ent parts of the brain. The differences in FA values among different parts of the brain, or at different gesta-tional ages, were analyzed using univariate ANOVA. The mean values of FA in the deep cerebral WM and the
superficial cerebral WM were calculated. Spearman’s rank correlation analyses were utilized to determine the correlation coefficient between the FA value of the fetal cerebral WM and the gestational age. The differences between FA values and the number of neurons and glial cells of the deep and superficial cerebral WM, or at dif-ferent gestational ages, were analyzed using univariate ANOVA.
Results
Morphological changes
No myelination changes were observed in the E69 group (Fig. 2), and were equivalent to the normal human levels of a gestational age younger than 20 weeks. In the E85 group, low punctate signals indicated myelination in the medulla, caudex cerebri, and at the back of pons in T2WI images, with no myelination in the PLIC and lat-eral parts of the thalamus. This was equivalent to the human level at 27–35 weeks of gestational age. In the E114 group, a low signal was observed at the spinal cord, extending from the medulla oblongata and dorsal pons, through the medial lemniscus to the cerebral peduncle, thalamic ventral lateral, PLIC, and central part of the corona radiata, consistent with the human level of neonates at 40 weeks of gestational age.
In the germinal matrix (Fig. 3), the E69 group had a low signal in the germinal matrix along the anterior horn, thal-amic tail groove, and the posterior horn. The E85 group had a low signal corresponding to the anterior horn and thalamic tail groove, but not the posterior horn, which was equivalent to the human level at 26 weeks of gestational age. In the E114 group, no germinal matrix was observed, corre-sponding with the human level at older than 34 weeks.
Sulci and gyri (Fig. 4) in the E69 group showed smooth insula with no anterior or posterior temporal sulcus, visible hemisphere cerebral sulcus, and a lateral cerebral fissure separating the frontotemporal and par-ietal occipital sulcus. In the E85 group, a shallow insular sulcus and gyrus with shallow anterior and posterior temporal sulcus were observed. Fissura calcarina, sulcus
ammonis, the anterior central gyrus, the central gyrus, and the posterior gyrus were observed, along with a shallow anterior and posterior frontal gyrus, and anterior and posterior temporal gyrus. In group E114, a deep insular sulcus and gyrus, and deepened anterior and posterior temporal sulci were observed, along with a deep anterior and posterior frontal gyrus, anterior and posterior temporal gyrus, and temporal occipital gyrus, as well as a visible frontotemporal gyrus. The lateral fissure of the brain was almost closed, with the insula covered.
The brain maturity scores of the E69 group, the E85 group, and the E114 group were 1 point, 6 points, and 11 points, respectively, and were approximately equiva-lent to the levels of the human fetus at 20, 27, and 40 weeks, respectively [16].
DTI data
There were no significant differences in the FA values found between the left and right cerebral hemispheres at the same site using paired t-tests (P> 0.05). The average values were calculated for further analyses.
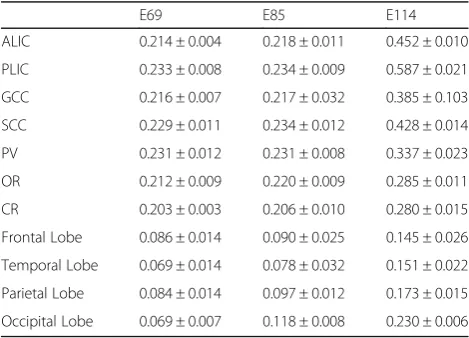
The average FA values of the deep cerebral white mat-ter in the different gestational age groups, including ALIC, PLIC, GCC, SCC, PV, OR, and CR and in the superficial cerebral WM, including Frontal Lobe,Parietal Lobe, Temporal Lobe and Occipital Lobe (Table 1). The FA values of different parts of the brain at the same gestational age were different. For the E114 group, the regions with the highest to lowest FA values were the PLIC, ALIC, SCC, GCC, PV, OR, CR, the occipital, parietal, temporal, and the frontal lobe WM. For the E85 Fig. 2Basal ganglia T2WI map (a-c), FA (d-f) (from the left and right are gestational age 69, 85, 114 days respectively) No myelination changes were observed in the E69 group (a). In the E85 group, low punctate signals indicated myelination in the medulla, caudex cerebri, and at the back of pons in T2WI images, with no myelination in the PLIC and lateral parts of the thalamus (b). In the E114 group, a high signal was observed at the spinal cord, extending from the medulla oblongata and dorsal pons, through the medial lemniscus to the cerebral peduncle, thalamic ventral lateral, PLIC, and central part of the corona radiata (c)
group, the FA values were (from highest to lowest): PLIC, SCC, PV, OR, ALIC, GCC, CR, occipital, parietal, frontal, and temporal lobe WM. For the E69, the FA values were (from highest to lowest): PLIC, PV, SCC, GCC, ALIC, CR, frontal, parietal, temporal, and occipital lobe WM. During the process of overall development, among the deep cerebral WM, the FA values of the PLIC and SCC were higher, while the value of the OR and CR were lower.
Spearman’s rank correlation analyses showed that the FA value of each ROI was positively correlated with gestational age, and the correlation was statistically significant (P< 0.01) (Table 2).
The univariate ANOVA analyses of the differences among the FA values of various regions at different gestational ages showed no statistically significant differ-ence in the deep cerebral WM between the E69 group and E85 group, except for the ALIC and SCC (P> 0.05). There were no significant differences between the WM of the frontal and temporal lobes (P> 0.05). The average
FA values of the deep cerebral WM were higher than those of the peripheral cerebral WM (P< 0.05) (Table 3). Spearman’s rank correlation analyses showed that the FA value of each ROI was positively correlated with gestational age, and the correlation was statistically significant (P< 0.01) (Table 3). The FA values of the ana-tomical regions were gradually increased with the gesta-tional age, but at different speeds. The increasing change at the first stage, from the second trimester to late preg-nancy, was slow (the deep and peripheral cerebral WM increases were 1.36% and 23.92%, respectively). The increase at the second stage, from the late pregnancy to neonatal stage, was greater (the deep and peripheral
cerebral WM increases were 76.2% and 83.2%,
respectively).
Univariate ANOVA analyses for the differences in FA values of different parts or different gestational ages showed no significant differences in the deep cerebral Fig. 4Cerebral sulcus development T2WI map (a-c) (from the left and right are gestational age 69, 85, 114 days respectively) In the E69 group, smooth insula with no anterior or posterior temporal sulcus, visible hemisphere cerebral sulcus, and a lateral cerebral fissure separating the frontotemporal and parietal occipital sulcus (a). In the E85 group, a shallow insular sulcus and gyrus with shallow anterior and posterior temporal sulcus were observed. Fissura calcarina, sulcus ammonis, the anterior central gyrus, the central gyrus, and the posterior gyrus were observed, along with a shallow anterior and posterior frontal gyrus, and anterior and posterior temporal gyrus (b). In group E114, a deep insular sulcus and gyrus, and deepened anterior and posterior temporal sulci were observed, along with a deep anterior and posterior frontal gyrus, anterior and posterior temporal gyrus, and temporal occipital gyrus, as well as a visible frontotemporal gyrus. The lateral fissure of the brain was almost closed, with the insula covered (c)
Table 1The average FA value of different parts of different gestational age
E69 E85 E114
ALIC 0.214 ± 0.004 0.218 ± 0.011 0.452 ± 0.010
PLIC 0.233 ± 0.008 0.234 ± 0.009 0.587 ± 0.021
GCC 0.216 ± 0.007 0.217 ± 0.032 0.385 ± 0.103
SCC 0.229 ± 0.011 0.234 ± 0.012 0.428 ± 0.014
PV 0.231 ± 0.012 0.231 ± 0.008 0.337 ± 0.023
OR 0.212 ± 0.009 0.220 ± 0.009 0.285 ± 0.011
CR 0.203 ± 0.003 0.206 ± 0.010 0.280 ± 0.015
Frontal Lobe 0.086 ± 0.014 0.090 ± 0.025 0.145 ± 0.026
Temporal Lobe 0.069 ± 0.014 0.078 ± 0.032 0.151 ± 0.022
Parietal Lobe 0.084 ± 0.014 0.097 ± 0.012 0.173 ± 0.015
Occipital Lobe 0.069 ± 0.007 0.118 ± 0.008 0.230 ± 0.006
Table 2Correlation analysis between FA value and gestational age at different sites
r P
ALIC 0.734 0.000
PLIC 0.579 0.002
GCC 0.715 0.000
SCC 0.580 0.002
PV 0.568 0.002
OR 0.760 0.000
CR 0.605 0.001
Frontal Lobe 0.510 0.008
Temporal Lobe 0.581 0.002
Parietal Lobe 0.741 0.000
Occipital Lobe 0.929 0.000
WM, except between that of the E69 group and the E85 group (P> 0.05).
Histological examination of the pig fetal brain tissue
HE staining of the cerebral white matter
HE staining and optical microscopy images of the fetal pig brain at different gestational ages (Fig. 5) demon-strated that the superficial WM neurons in the E69 group were immature with sparse nerve fibers and processes. The deep WM showed pink staining of the cytoplasm, with more mature neurons and sparse nerve fibers.
The nerve fibers of the E85 group were not densely clustered, the density of nerve fibers was not signifi-cantly different from that of the E69 group, but had sig-nificantly increased neurons. Compared with the E69 group, neurons in the deep cerebral WM of the E85 group were more densely clustered, mature, and close to the normal status, with larger numbers and densities of glia cells, more concentrated neuronal fibers, and in-creased numbers and lengths of cellular processes (axons or dendrites).
The morphology and numbers of the superficial WM neurons in the E114 group were close to that of the E85 group, but with denser nerve fibers. The morphology of the deep brain WM neurons in the E114 group was not significantly changed compared with the previous stage, but the nerve fibers were thicker and the glial cells
became larger and more complicated, which corre-sponded with the beginning of myelination.
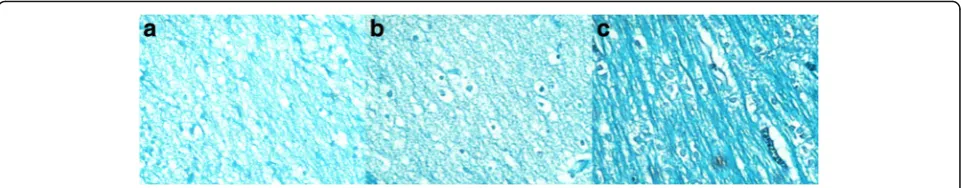
LFB staining of cerebral white matter
LFB staining of pig brain at different gestational ages (Fig. 6) showed bright blue staining of the myelin sheath visible under optical microscopy. Typical funicular dis-tribution of blue staining was observed in the deep cere-bral WM of the E114 group. No blue staining was observed in the deep and superficial cerebral WM of the E69 and E85 groups, or the superficial cerebral WM of the E114 group.
The number of neurons of the superficial WM in E69 group, E85 group, E114 group were 6.38 ± 3.045,13.73 ± 7.029,16.13 ± 9.993,respectively. The number of glial cells of the superficial WM in E69 group, E85 group, E114 group were 11.69 ± 3.505,61.98 ± 23.460,64.50 ± 26.203;respectively. The number of neurons of the deep WM in E69 group, E85 group, E114 group were 9.95 ± 4.952,18.81 ± 9.022,18.79 ± 8.446;respectively. The number of glial cells of the deep WM in E69 group, E85 group, E114 group were 13.50 ± 4.596,121.00 ± 40.811,116.84 ± 44.584,respectively.
Multiple groups means were compared with single fac-tor analysis of variance, and the comparison among groups was performed with SNK method. Based onα= 0.05,There was no statistically significant difference in population mean of neurons and glial cells between the Table 3Deep brain WM and Superficial brain WM data table
Deep brain WM Superficial brain WM T P
Average value Standard deviation Average value Standard deviation
E69 0.220 0.004 0.077 0.005 57.703 0.000
E85 0.223 0.006 0.095 0.014 25.216 0.000
E114 0.393 0.03 0.175 0.007 16.439 0.000
r 0.715 0.833
P 0.000 0.000
Note: R is the correlation coefficient, T is the single factor variance analysis
E85 group and E114 group, including the deep brain WM and superficial brain WM. In addition, there are significant statistically difference in population mean between any other two groups.
Discussion
DTI study of development animal brain
This study chose to examine the pig brains at gestational ages of 69, 85, and 114 days corresponding to the human gestational weeks of one half, three quarters, and full pregnancy, respectively. Earlier gestational ages, have smaller head diameter, cannot be studied because the unsuited magnetic resonance coil would affect the qual-ity of the images. The data show that T2 images of conventional MRI demonstrated a degree of myelination, degeneration of the germinal matrix, and morphological changes of the brain sulcus roughly corresponding with the human fetal level of 20 weeks, 27 weeks, and 40 weeks. The FA values of the WM were consistent with the DTI study of the fixed primate fetal brain at 90–185 days of gestational age, and had almost the same FA values at all regions of the WM at a gestational age of 90 days, with no significant differences between the deep and superficial WM. At a gestational age of 185 days,the FA values of the WM were higher, espe-cially for the myelinated WM such as the internal cap-sule [17], which is consistent with our observations and past studies.
There was also a study investigating the DTI changes in cat brain after birth. Although the cats were already born, the development of the myelin sheath was consist-ent with the intrauterine developmconsist-ent of pig and primates; therefore, their FA value changes could also be used as references. The P0 samples showed diffusive WM with low FA values, which had slightly higher local FA values at areas with more concentrated neurons such as the corpus callosum and internal capsule. Along with the development (P35), LBS staining was used to detect myelination in deep cerebral WM, which showed major projection fibers such as primary visual and sensory motor fibers. In these regions, the FA values were high-est, with increased FA values at the peripheral WM.
These changes occurred at 1 month after birth, which was also consistent with the process we observed between the second trimesters to full pregnancy [18]. In addition, using the afterbirth development of rats as a reference for the study of human intrauterine development is also useful [3, 19, 20].
The rules of development and FA value changes of fetal cerebral WM DTI can reflect the anatomical and pathological processes of WM fibers, which is a great improvement in imaging methodology, and may also im-prove the field of WM fiber study [21]. Our results showed that the values of FA increased along with mye-lination development. Therefore, measuring values can be used as a noninvasive imaging quantitative marker for fetal cerebral WM maturation. The anisotropy of WM fibers is determined by macroscopic and micro-scopic conditions. First, the microstructural characteris-tics of the tissues, such as the diameter and density of the fibers, and the degree of the myelination, and then, the macrostructural characteristics of tissues, such as the interconnections among the fiber channels, can be determined. As summarized in previous studies, the histological development related to the rapid changes of FA values of the cerebral WM include increased num-bers and densities of neuronal axons, enhanced phos-phorylation of nerve fibers, increases in number and maturity of myelin sheaths of nerve fibers, and the expression of myelin basic protein [22, 23].
The differences between the deep WM and the peripheral WM
WM of the cortex is very sparse, with scattered axon fi-bers in the WM. 2) Myelination of the deep cerebral WM starts from the second trimester, and reaches the PLIC at a gestational age of 35 weeks (the latest age evaluated in this study), and can expand to the main deep cerebral WM at the central part, such as in the center of the half oval. The superficial cerebral WM is mainly composed of tissues under the cortex that will develop into the far-end joint, contacting and projecting WM fiber to connect the two hemispheres of the cortex, but will not undergo myelination [22, 27]. 3) Regarding the direction of projections, the direction of the deep cerebral WM is more consistent with the unitary direc-tion of the projecdirec-tion, union, and contact of nerve fibers, with almost no distortion and more concentrated direc-tions. While the superficial part of the cerebral WM is an extension of the deep cerebral WM into the cortex, the direction is more scattered. 4) Regarding the shaft radius, the radius of the scattered fiber is obviously smaller than the radius of the central axis. 5) The deep cerebral WM is also known as dense WM, the structure of which is relatively dense. With dense neurons and lower water content, the FA values of the deep brain WM are high at various developmental phases. However, the superficial cerebral WM neurons are sparse and con-tain a large amount of extracellular fluid. A previous study [28] concluded that the increase of FA values in brain parenchyma was due to decreased water content in the brain and the convergence of macromolecular materials, which is also consistent with another report [29]. The results of this study showed that the develop-mental pattern of the cerebral WM is in the order of center to periphery, posterior to anterior, and bottom-up, which has been confirmed by additional studies [30].
Changes of FA in the deepWM during development
The current study demonstrated the temporal variation of the deep cerebral WM in different fetal age groups. FA values did not change significantly between 1/2 way and 3/4 of the way through gestation but was then increased dramatically at term. These findings are con-sistent with in vivo observations of human intrauterine development [31] and the model based on the hypoth-esis of premature infant development [29, 32]. Intrauter-ine brain development studies of 23–38 weeks evaluated the changes in the corticospinal tract, optic radiation, and corpus callosum, while premature infant brain development studies evaluated the postnatal changes of the callosity body, cerebral peduncle, corticospinal tract, spinothalamic tract, internal capsule, radiation, inferior longitudinal fasciculus, and cingulum at 1–4 month after birth. It was found that “axonal organization”, “myelin gliosis”, and “myelination” corresponded with increased, unchanged, and increased FA values, respectively. The
“axonal organization”manifested as scattered axons trans-formed into a coherent and clear bundle of nerves. The diffusion direction of water is gradually limited to the dir-ection of the axon (from central to the periphery). The model of the water molecule diffusion direction increases. The “myelin gliosis”manifested as glial cells formed around neurons, which does not change the diffusion dir-ection of the water molecules, and confirms the model of water molecular diffusion direction. During the process of “myelination”, the direction of water molecule diffusion is limited to radiation, that is, from peripheral to axons. The “myelin gliosis”is more specifically reflected in the corti-cospinal tract at 28.5–32.5 weeks, or at 26.3–34.8 weeks, the SCC at 25.6–35.4 weeks, and the GCC from 25 weeks to after birth (38 weeks), suggesting that FA values would not significantly change, consistent with the histological observations [33, 34]. The data correspond to the lack of significant change from 1/2 to 3/4 pregnancy term in the deep cerebral WM, and the dramatic increase from 3/4-to full pregnancy observed in animal studies. The change of FA values during the period of“myelin gliosis”was not obvious, while the dramatic elevation of FA values during “myelination”in the premature infants and neonates has been reported in many studies [35–37]. Myelination is an important factor affecting the increase of FA values. The slow increase of FA values of the superficial cerebral WM may therefore be related to the microstructural development that limits water dispersion, including gradual densification of WM and lowered water con-tent. The data and changes of FA values correspond with our histological findings, indicating that the FA values, reflecting the diffusion tensor anisotropy of magnetic resonance, can quantitatively reflect the level of the intrauterine developmental maturity of the fetal cerebral WM, and the changes of FA values could be used to divide cerebral WM development into different stages. From the perspective of guiding clinical practice, during “myelin gliosis”period, precur-sors of oligodendrocytes in the WM gradually develop into immature oligodendrocytes, which may corres-pond to the high-risk time frame (23–32 weeks) of periventricular leukomalacia (PVL). At this stage, the majority of oligodendrocytes is at the phase of ad-vanced oligodendrocyte precursors, which is suspected to be a potential target of PVL [33, 34].
Limitations
different diameter of the animal heads, using the same scanning parameters may lead to relatively poor quality of T2WI. However, These features included degree of sulcation, extent of visualization of the germinal matrix, extent of myelination can be clearly distinguished,it does not affect the experimental results. 3) The size and location of ROIs have a great influence on the results of FA values. 4) Because the size of the animal’s head is small, the struc-ture is not easy to identify, therefore there was less anatom-ical evaluation.
Conclusions
In conclusion, we showed that FA values of DTI images reflect the anisotropy characteristics of the cerebral microstructural development, which can be used for quantitative analysis of the intrauterine developmental changes of cerebral WM in the fetal pig. The FA values of the deep cerebral WM were higher than that of the superficial cerebral WM, which histologically reflect the higher maturity of the deep cerebral WM when com-pared with the superficial WM. FA values did not change significantly between 1/2 way and 3/4 of the way through gestation, which were related to the myelin glio-sis. However, it was then increased dramatically at term may be closely related to the myelination of nerve fibers.
Abbreviations
ALIC:The anterior limb internal capsule; CR: The corona radiate; DTI: Diffusion tensor imaging; FA: Fractional anisotropy; GCC: The genu corporis callosi; HE: Hematoxylin & eosin; HIE: Hypoxic-ischemic encephalopathy; LFB: Luxol fast blue; MRI: Magnetic resonance imaging; OR: The optic radiation; PLIC: The posterior limb of the internal capsule; PV: The periventricular white matter; ROI: Region of interest; SCC: The splenium corporis callosi; WM: White matter
Acknowledgements
We would like to thank Yue Li for the help with pathology sections.
Funding
This study is financially supported with the Shengjing Hospital but not commercial organization. The funding source has estimated the feasibility of the study, but has no role in the collection, analysis, or interpretation of the data or in the decision to submit the manuscript for publication.
Availability of data and materials
The datasets used and/or analysed during the current study available from the corresponding author on reasonable request.
Authors’contributions
QWX and GQY designed and performed the study. QWX acquired and analyzed the data, wrote the paper, GQY reviewed and edited the manuscript; GS, LCX, LGY and YX performed the experiment; all authors read and approved the final manuscript.
Competing interests
The authors declare that they have no competing interests.
This study was conducted on the approval of Ethical Committee at Shengjing Hospital, China Medical University.
Consent for publication Not applicable.
Ethics approval and consent to participate
This study was conducted on the approval of Ethical Committee at Shengjing Hospital, China Medical University (Permit Number:2014PS153K).
Publisher’s Note
Springer Nature remains neutral with regard to jurisdictional claims in published maps and institutional affiliations.
Author details
1Department of Radiology, Shengjing Hospital, China Medical University, Shenyang 110004, People’s Republic of China.2Morphology Teaching and Reasearch Section, Liaoning Vocational College of Medcine, Shenyang 110100, People’s Republic of China.3Department of Obstetrics and Gynecology, Shengjing Hospital, China Medical University, Shenyang 110004, People’s Republic of China.
Received: 17 October 2016 Accepted: 3 May 2017
References
1. Huang H, Vasung L. Gaining insight of fetal brain development with diffusion MRI and histology. Int J Dev Neurosci. 2014;32:11–22.
2. Huang H, Zhang J, Wakana S, Zhang W, Ren T, Richards LJ, Yarowsky P, Donohue P, Graham E, van Zijl PC, et al. White and gray matter development in human fetal, newborn and pediatric brains. NeuroImage. 2006;33(1):27–38. 3. Huang H, Yamamoto A, Hossain MA, Younes L, Mori S. Quantitative cortical
mapping of fractional anisotropy in developing rat brains. J Neurosci. 2008; 28(6):1427–33.
4. Huang H, Xue R, Zhang J, Ren T, Richards LJ, Yarowsky P, Miller MI, Mori S. Anatomical characterization of human fetal brain development with diffusion tensor magnetic resonance imaging. J Neurosci. 2009;29(13):4263–73. 5. Vasung L, Huang H, Jovanov-Milosevic N, Pletikos M, Mori S, Kostovic I.
Development of axonal pathways in the human fetal fronto-limbic brain: histochemical characterization and diffusion tensor imaging. J Anat. 2010; 217(4):400–17.
6. Huang H. Structure of the fetal brain: what we are learning from diffusion tensor imaging. Neuroscientist. 2010;16(6):634–49.
7. Huang H, Jeon T, Sedmak G, Pletikos M, Vasung L, Xu X, Yarowsky P, Richards LJ, Kostovic I, Sestan N, et al. Coupling diffusion imaging with histological and gene expression analysis to examine the dynamics of cortical areas across the fetal period of human brain development. Cereb Cortex. 2013;23(11):2620–31. 8. Woodward LJ, Anderson PJ, Austin NC, Howard K, Inder TE. Neonatal MRI to
predict neurodevelopmental outcomes in preterm infants. N Engl J Med. 2006;355(7):685–94.
9. Takahashi E, Dai G, Rosen GD, Wang R, Ohki K, Folkerth RD, Galaburda AM, Wedeen VJ, Ellen Grant P. Developing neocortex organization and connectivity in cats revealed by direct correlation of diffusion tractography and histology. Cereb Cortex. 2011;21(1):200–11.
10. Takahashi E, Folkerth RD, Galaburda AM, Grant PE. Emerging cerebral connectivity in the human fetal brain: an MR tractography study. Cereb Cortex. 2012;22(2):455–64.
11. Domoki F, Zolei-Szenasi D, Olah O, Toth-Szuki V, Nemeth J, Hopp B, Bari F, Smausz T. Comparison of cerebrocortical microvascular effects of different hypoxic-ischemic insults in piglets: a laser-speckle imaging study. J Physiol Pharmacol. 2014;65(4):551–8.
12. Hoque N, Sabir H, Maes E, Bishop S, Thoresen M. Validation of a neuropathology score using quantitative methods to evaluate brain injury in a pig model of hypoxia ischaemia. J Neurosci Methods. 2014;230:30–6.
13. Ezzati M, Broad K, Kawano G, Faulkner S, Hassell J, Fleiss B, Gressens P, Fierens I, Rostami J, Maze M, et al. Pharmacokinetics of dexmedetomidine combined with therapeutic hypothermia in a piglet asphyxia model. Acta Anaesthesiol Scand. 2014;58(6):733–42.
14. Gang Q, Zhang J, Hao P, Xu Y. Detection of hypoxic-ischemic brain injury with 3D-enhanced T2* weighted angiography (ESWAN) imaging. Eur J Radiol. 2013;82(11):1973–80.
15. Mori S, Zhang J. Principles of diffusion tensor imaging and its applications to basic neuroscience research. Neuron. 2006;51(5):527–39.
16. Vossough A, Limperopoulos C, Putt ME, du Plessis AJ, Schwab PJ, Wu J, Gee JC, Licht DJ. Development and validation of a semiquantitative brain maturation score on fetal MR images: initial results. Radiology. 2013;268(1):200–7. 17. Kroenke CD, Bretthorst GL, Inder TE, Neil JJ. Diffusion MR imaging characteristics
18. Takahashi E, Dai G, Wang R, Ohki K, Rosen GD, Galaburda AM, Grant PE, Wedeen VJ. Development of cerebral fiber pathways in cats revealed by diffusion spectrum imaging. NeuroImage. 2010;49(2):1231–40.
19. Watson RE, Desesso JM, Hurtt ME, Cappon GD. Postnatal growth and morphological development of the brain: a species comparison. Birth Defects Res B Dev Reprod Toxicol. 2006;77(5):471–84.
20. Mori S, Itoh R, Zhang J, Kaufmann WE, van Zijl PC, Solaiyappan M, Yarowsky P. Diffusion tensor imaging of the developing mouse brain. Magn Reson Med. 2001;46(1):18–23.
21. Lim KO, Hedehus M, Moseley M, de Crespigny A, Sullivan EV, Pfefferbaum A. Compromised white matter tract integrity in schizophrenia inferred from diffusion tensor imaging. Arch Gen Psychiatry. 1999;56(4):367–74. 22. Haynes RL, Borenstein NS, Desilva TM, Folkerth RD, Liu LG, Volpe JJ, Kinney
HC. Axonal development in the cerebral white matter of the human fetus and infant. J Comp Neurol. 2005;484(2):156–67.
23. Huppi PS, Maier SE, Peled S, Zientara GP, Barnes PD, Jolesz FA, Volpe JJ. Microstructural development of human newborn cerebral white matter assessed in vivo by diffusion tensor magnetic resonance imaging. Pediatr Res. 1998;44(4):584–90.
24. Brody BA, Kinney HC, Kloman AS, Gilles FH. Sequence of central nervous system myelination in human infancy. I. An autopsy study of myelination. J Neuropathol Exp Neurol. 1987;46(3):283–301.
25. Rakic P, Yakovlev PI. Development of the corpus callosum and cavum septi in man. J Comp Neurol. 1968;132(1):45–72.
26. ten Donkelaar HJ, Lammens M, Wesseling P, Hori A, Keyser A, Rotteveel J. Development and malformations of the human pyramidal tract. J Neurol. 2004;251(12):1429–42.
27. Price DJ, Kennedy H, Dehay C, Zhou L, Mercier M, Jossin Y, Goffinet AM, Tissir F, Blakey D, Molnar Z. The development of cortical connections. Eur J Neurosci. 2006;23(4):910–20.
28. Mukherjee P, Miller JH, Shimony JS, Philip JV, Nehra D, Snyder AZ, Conturo TE, Neil JJ, McKinstry RC. Diffusion-tensor MR imaging of gray and white matter development during normal human brain maturation. AJNR Am J Neuroradiol. 2002;23(9):1445–56.
29. Dubois J, Hertz-Pannier L, Dehaene-Lambertz G, Cointepas Y, Le Bihan D. Assessment of the early organization and maturation of infants’cerebral white matter fiber bundles: a feasibility study using quantitative diffusion tensor imaging and tractography. NeuroImage. 2006;30(4):1121–32. 30. Gao W, Lin W, Chen Y, Gerig G, Smith JK, Jewells V, Gilmore JH. Temporal
and spatial development of axonal maturation and myelination of white matter in the developing brain. AJNR Am J Neuroradiol. 2009;30(2):290–6. 31. Zanin E, Ranjeva JP, Confort-Gouny S, Guye M, Denis D, Cozzone PJ, Girard N.
White matter maturation of normal human fetal brain. An in vivo diffusion tensor tractography study. Brain and behavior. 2011;1(2):95–108.
32. Dubois J, Dehaene-Lambertz G, Perrin M, Mangin JF, Cointepas Y, Duchesnay E, Le Bihan D, Hertz-Pannier L. Asynchrony of the early maturation of white matter bundles in healthy infants: quantitative landmarks revealed noninvasively by diffusion tensor imaging. Hum Brain Mapp. 2008;29(1):14–27. 33. Back SA, Luo NL, Borenstein NS, Levine JM, Volpe JJ, Kinney HC. Late
oligodendrocyte progenitors coincide with the developmental window of vulnerability for human perinatal white matter injury. J Neurosci. 2001;21(4): 1302–12.
34. Back SA, Luo NL, Borenstein NS, Volpe JJ, Kinney HC. Arrested oligodendrocyte lineage progression during human cerebral white matter development: dissociation between the timing of progenitor differentiation and myelinogenesis. J Neuropathol Exp Neurol. 2002;61(2):197–211.
35. Kasprian G, Brugger PC, Weber M, Krssak M, Krampl E, Herold C, Prayer D. In utero tractography of fetal white matter development. NeuroImage. 2008; 43(2):213–24.
36. Bui T, Daire JL, Chalard F, Zaccaria I, Alberti C, Elmaleh M, Garel C, Luton D, Blanc N, Sebag G. Microstructural development of human brain assessed in utero by diffusion tensor imaging. Pediatr Radiol. 2006;36(11):1133–40. 37. Partridge SC, Mukherjee P, Henry RG, Miller SP, Berman JI, Jin H, Lu Y, Glenn OA,
Ferriero DM, Barkovich AJ, et al. Diffusion tensor imaging: serial quantitation of white matter tract maturity in premature newborns. NeuroImage. 2004;22(3): 1302–14.
• We accept pre-submission inquiries
• Our selector tool helps you to find the most relevant journal
• We provide round the clock customer support
• Convenient online submission
• Thorough peer review
• Inclusion in PubMed and all major indexing services • Maximum visibility for your research
Submit your manuscript at www.biomedcentral.com/submit