Open Access
Research article
Data correction pre-processing for electronically stored blood
culture results: Implications on microbial spectrum and empiric
antibiotic therapy
Ojan Assadian*
1, Magda Diab-Elschahawi
1, Athanasios Makristathis
2,
Alexander Blacky
1, Walter Koller
1and Klaus-Peter Adlassnig
3,4Address: 1Clinical Institute for Hygiene and Medical Microbiology, Medical University of Vienna, Division of Hospital Hygiene, Waehringer Guertel 18-20, A-1090 Vienna, Austria, 2Clinical Institute for Hygiene and Medical Microbiology, Medical University of Vienna, Division of Clinical Microbiology, Waehringer Guertel 18-20, A-1090 Vienna, Austria, 3Section on Medical Expert and Knowledge-Based Systems, Medical University of Vienna, Spitalgasse 23, A-1090 Vienna, Austria and 4Medexter Healthcare GmbH, Borschkegasse 7/5, A-1090 Vienna, Austria
Email: Ojan Assadian* - [email protected]; Magda Diab-Elschahawi - [email protected]; Athanasios Makristathis - [email protected]; Alexander Blacky - [email protected]; Walter Koller - [email protected]; Klaus-Peter Adlassnig - [email protected]
* Corresponding author
Abstract
Background: The outcome of patients with bacteraemia is influenced by the initial selection of adequate antimicrobial therapy. The objective of our study was to clarify the influence of different crude data correction methods on a) microbial spectrum and ranking of pathogens, and b) cumulative antimicrobial susceptibility pattern of blood culture isolates obtained from patients from intensive care units (ICUs) using a computer based tool, MONI.
Methods: Analysis of 13 ICUs over a period of 7 years yielded 1427 microorganisms from positive results. Three different data correction methods were applied. Raw data method (RDM): Data without further correction, including all positive blood culture results. Duplicate-free method (DFM): Correction of raw data for consecutive patient's results yielding same microorganism with similar antibiogram within a two-week period. Contaminant-free method (CFM): Bacteraemia caused by possible contaminants was only assumed as true bloodstream infection, if an organism of the same species was isolated from > 2 sets of blood cultures within 5 days.
Results: Our study demonstrates that different approaches towards raw data correction – none (RDM), duplicate-free (DFM), and a contaminant-free method (CFM) – show different results in analysis of positive blood cultures. Regarding the spectrum of microorganisms, RDM and DFM yielded almost similar results in ranking of microorganisms, whereas using the CFM resulted in a clinically and epidemiologically more plausible spectrum.
Conclusion: For possible skin contaminants, the proportion of microorganisms in terms of number of episodes is most influenced by the CFM, followed by the DFM. However, with exception of fusidic acid for gram-positive organisms, none of the evaluated correction methods would have changed advice for empiric therapy on the selected ICUs.
Published: 7 June 2009
BMC Medical Informatics and Decision Making 2009, 9:27 doi:10.1186/1472-6947-9-27
Received: 17 December 2008 Accepted: 7 June 2009
This article is available from: http://www.biomedcentral.com/1472-6947/9/27
© 2009 Assadian et al; licensee BioMed Central Ltd.
Background
Nosocomial infections are estimated to affect 6–12% of hospitalized patients [1]. Of these infections, bacteraemia and fungaemia have the most significant effect on mortal-ity. The outcome of patients with bacteraemia is influ-enced by the initial selection of adequate antimicrobial therapy [2]. Generally, selecting the antibiotic of choice for the treatment of an infection is a multi-factorial proc-ess, which includes site of infection, intrinsic activity of the drug according to microbiological susceptibility test-ing results, pharmacokinetics of the drug at the site of infection, and potential side effects. However, before con-sidering these factors, the choice of agent is mainly dependant on knowledge of the organisms likely to be involved. Contrarily, in clinical settings, microbiological verification of an infection and susceptibility of the caus-ative pathogen are usually not available at the time of clin-ical diagnosis of an infection. In order not to endanger the patient, a calculated (empirical) antimicrobial therapy often has to be started without exact knowledge of the causative pathogen and its antimicrobial susceptibility profile. Furthermore, very little changes occur in the anti-microbial management even at the time when antimicro-bial susceptibility results are available to physicians [3].
To assist physicians at an early stage with the empiric anti-biotic choice for treating blood stream infections, a close liaison with the clinical microbiologists is important. By regularly monitoring and analyzing blood culture results and by calculating the most frequently isolated microor-ganisms together with their cumulative susceptibility pro-files, the clinical microbiologist can narrow the plausible cause of bacteraemia and susceptibility to antibiotics. Therefore, analysis of occurrence of pathogens and their cumulative susceptibility profiles is widely used in hospi-tals, and recent attempts on how to standardize these tasks were only developed within the last years [4]. How-ever, applying these definitions manually on large data-sets is time consuming, error-prone, and therefore, needs development of expensive software tools.
For blood cultures, there are two concerns that demand correction of crude data before generating statistics on the frequency of occurrence of pathogens and their cumula-tive antibiotic susceptibility profile. One refers to the fact that in course of treatment and monitoring of the patient, repetitive isolates are obtained, and it is generally believed that by omission of these duplicates the final result will not be biased by multiple cultures of one identical organ-ism during a single infectious episode. The second consid-eration is the difficulty of interpretation of microbiological test results in distinguishing true episodes of infection from possible contamination of specimens [5]. In clinical practice, merging several other laboratory results together with the clinical aspect of the affected
patient makes decision on this subject. Looking at micro-biologic data alone often results in overestimation of the real size of the situation, and this is especially true for blood culture results. Several studies have found Staphylo-coccus epidermidis to be the most common microorganism isolated from blood cultures, accounting for 30–60% of all episodes [6-9]. Although these findings were explained partly by the increasing use of intravascular devices, which can serve as portal of entry to the bloodstream, they may be as well due to the retrospective nature of many studies and the lack of criteria for differentiation between con-taminated blood cultures and true bacteraemia. Two stud-ies [5,10] could demonstrate that a simplified surveillance definition for nosocomial bloodstream infections based on microbiology data alone yielded comparable result to the Centers for Diseases Control and Prevention's (CDC's) definition for primary bloodstream infection [11] for possible skin contaminant isolates with an agree-ment rate of 75% [5] and 91% [10], respectively.
Based on these considerations, the objective of our study was to clarify the influence of different crude data correc-tion methods on a) microbial spectrum and ranking of pathogens, and b) cumulative antimicrobial susceptibility pattern of blood culture isolates obtained from patients from intensive care units (ICUs).
Methods
ALERT), monitoring of cross infections (MONI/CROSS), and monitoring of frequencies and trends (MONI/TREND). The
hospital's infection control team analyzes the intelligent alarms generated by MONI, and reacts to them by initiat-ing necessary countermeasures.
No ethical approval was needed for this study, as data acquisition followed Austrian federal law on data safety, and data pre-processing and analysing occurred anony-mously.
Data acquisition and processing
Data acquisition was performed using the system's data-base query tool FlexScan. Since preliminary reports of blood culture results can introduce considerable redun-dancy into a database of microbiology results, only the final reports from each sample are downloaded to the MONI database. For purpose of this study, three separate queries were conducted, one using the programs duplicate result filter (duplicate-free method – DFM), the other without any data correction (raw data method – RDM). For the purpose of evaluating a new data correction rule, a third query was performed using definitions published by Yokoe et al. [10] (contaminant-free method – CFM).
Following the selection of a time period (1 January 1998 – 31 December 2004), a sampling material (blood cul-ture), and the wards under study (13 ICUs: 7 surgical, 5 medical, and 1 neuro-surgical), the program was started. After performing the queries, results were stored in a dynamic comma separated (*.csv) file, and analyzed for more detail using a standard spreadsheet application (MS Excel 2000, Microsoft Corporation, Redmond, Virginia). Data from each patient included the following variables: patient identification number, family name, first name, date of birth, patient's age at sample collection, protocol number of the blood culture report, date of sampling, sender's department and ward, sampling material (blood culture), identified organism, and antimicrobial suscepti-bility pattern in terms of resistant, susceptible, or interme-diate susceptible.
Definition of data correction rules Raw data method (RDM)
Raw data were defined as data acquired by MONI without any further correction. Hence, they included all positive blood culture results obtained from patients of 13 ICUs from 1 January 1998 – 31 December 2004 without any further manipulation.
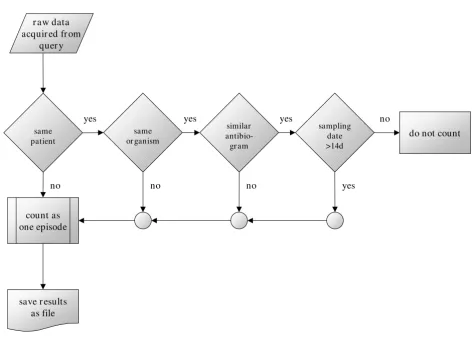
Duplicate-free method (DFM)
(figure 1) The duplicate-free method was defined as cor-rection of raw data by elimination of duplicate results. A duplicate result was defined as any result presenting the same microorganism (genus and species) from the same
material (in this study blood culture) with a similar anti-microbial susceptibility pattern (at least 85% similarity) obtained from the same patient within a two-week period starting from the last positive culture with the identical organism. Intermediate susceptibility results were also considered as resistant results. The accepted differences of not more than 15% in antibiotic susceptibility was related most to the clinical practice of testing additional antibiot-ics or to omit re-testing of previously tested compounds. Hence, in most cases the difference pertained more to missing or additionally tested compounds. Only the first result from a patient – representing one episode of bacter-aemia – was enrolled for further analysis.
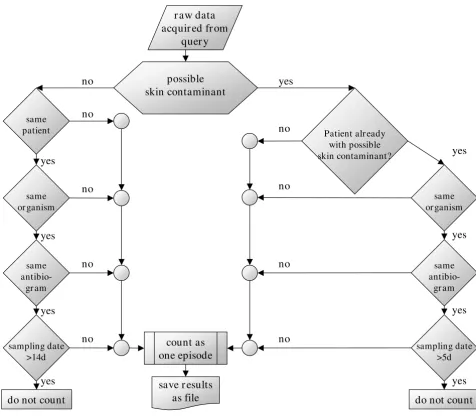
Contaminant-free method (CFM)
(figure 2) Considering the problem of contamination with skin organisms, we applied the definitions published earlier [10]. Possible skin contaminants were defined as organisms, which are part of the normal skin flora, includ-ing coagulase-negative staphylococci, Corynebacterium spe-cies, alpha- or non-hemolytic streptococci [5], Bacillus species, Propionibacterium acnes, micrococci, and Neisseria species other than N. gonorrhoeae and N. meningitidis. All coagulase-negative staphylococci were differentiated on the species level, and not on the genus level alone. Other bacteria and fungi were regarded as obligate pathogens (e.g. Salmonella typhi, Staphylococcus aureus) and therefore always considered as true cause of bacteraemia, whereby only the first isolate within a 14-day period was counted as one episode. Bacteraemia caused by a possible skin contaminant organism was assumed as true if an organ-ism of the same species with a similar antimicrobial sus-ceptibility pattern (at least 85% similarity) was isolated from two or more sets of blood cultures obtained from the same patient within 5 days starting from the last positive culture with the identical organism. In this case, this was counted as a single episode of bacteraemia. If only one isolate was recorded within this period, the blood culture was regarded to be contaminated and was excluded from further analysis.
Calculation and interpretation of antimicrobial susceptibility pattern
Standards, NCCLS) guidelines [16], if appropriate. Results of cumulative antimicrobial susceptibility were presented as percentage of resistance against a tested antimicrobial substance.
Statistical analysis
Differences of proportions between RDM, DFM and CFM were calculated by applying the χ2 test, which gives the
probability that an observed difference between two means or proportions is caused by chance. A P-value of less than 0.05 was considered significant. Calculations were performed using Epi Info 2000 v 1.1.2a (Centers for Disease Control and Prevention, Atlanta, GA 30333, USA).
Results
Microbial spectrum and ranking of microorganisms
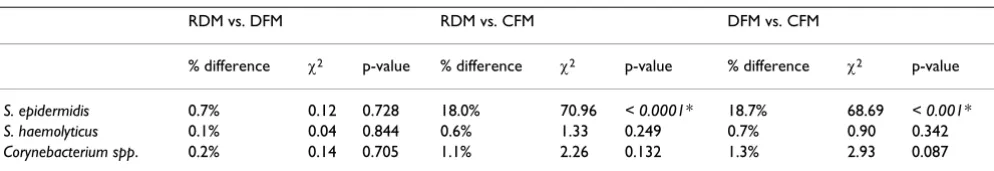
Analysis from 13 ICUs (01/1998 – 12/2004) yielded 1427 microorganisms from positive blood culture results. The spectrum of microorganisms, calculated by RDM, DFM, and CFM, respectively, is shown in Table 1. By means of all data correction methods, Staphylococcus epidermidis and
Staphylococcus aureus were the most common organisms. However, regarding their proportion expressed as percent-age of all episodes, there are significant differences. Table 2 and Table 3 show the difference of proportions obtained by the different data correction methods as well as the results of significance testing for possible skin contami-nants and obligate pathogens, respectively. Although def-initions for DFM and CFM did not differ for obligate pathogens, due to the different size of denominators sta-tistically significant differences with respect to proportion of episodes could be observed. While there were differ-ences in proportions for all microorganisms, no statisti-cally significant difference was found for RDM vs. DFM.
Among the 333 microorganisms representing 23.3% of all positive blood cultures summarized as "others" in Table 1, Staphylococcus spp. (other than S. epidermidis, S. aureus
and S. haemolyticus) (68; 4.8%), Corynebacterium spp. (39; 2.7%), Klebsiella spp. (32; 2.2%), viridans group strepto-cocci (27; 1.9%), Candida spp. (other than C. albicans) (24; 1.7%), Propionibacterium spp. (20; 1.4%), Streptococcus pneumoniae (18; 1.3%), Citrobacter spp. (10; 0.7%),
Entero-Flowchart of the "if/then" rules of duplicate-free method (DFM)
Figure 1
Flowchart of the "if/then" rules of duplicate-free method (DFM). count as
one episode
save r esults as file
same patient
r aw data acquir ed fr om
quer y
same or ganism
similar antibio- gr am
sampling date >14d
do not count
yes no
yes yes
yes
no no
bacter spp. (other than E. cloacae) (10; 0.7%), Serratia marc-escens (9; 0.6%), Acinetobacter spp. (other than A. baumanii) (7; 0.5%), Stenotrophomonas maltophilia (7; 0.5%), Bacteroides spp. (6; 0.4%), Enterococcus spp. (other than E. faecalis and E. faecium) (6; 0.4%), Ralstonia pickettii
(6; 0.4%), Burkholderia cepacia (4; 0.3%), Haemophilus spp. (4; 0.3%), Peptostreptococcus anaerobius (4; 0.3%), Alcali-genes xylosoxidans (3; 0.2%), Micrococcus spp. (3; 0.2%),
Morganella morganii (3; 0.2%), Proteus mirabilis (3; 0.2%),
Aerococcus viridans (2), Clostridium spp. (2), Flavimonas oryzihabitans (2), group B streptococci (2), Actinomyces meyeri (1), Bifidobacterium sp. (1), Campylobacter jejuni (1),
Cryptococcus neoformans (1), Gemella sp. (1), Kocuria sp. (1),
Lactobacillus casei (1), Listeria monocytogenes (1), Prevotella
denticola (1), Pseudomonas alcaligenes (1), group F (1), and group G streptococci (1).
Results of antimicrobial susceptibility testing and appropriateness of antibiotics for empirical therapy
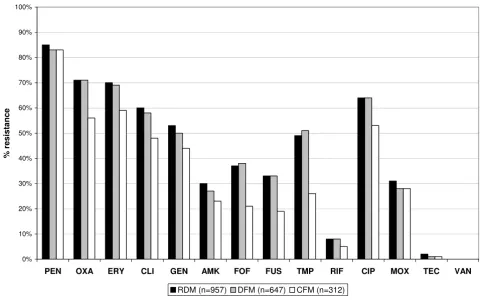
Figure 3 shows differences in the antimicrobial resistance profile of gram-positive, Figure 4 of gram- negative organ-isms. Considering an empirical cut-off level of ≥ 20% of resistant organisms to an antibiotic as limit for appropri-ateness of this agent for empirical therapy of infection caused by gram-negative organisms, no data correction method would have yielded a different recommendation for empirical therapy. However, for gram-positive organ-isms, only the application of the CFM changed
signifi-Flowchart of the "if/then" rules of contaminant-free method (CFM)
Figure 2
Flowchart of the "if/then" rules of contaminant-free method (CFM).
count as
one episode
save r esults
as file
same patient
r aw data
acquir ed fr om
quer y
same or ganism
same
antibio-gr am
sampling date >14d
do not count
possible
skin contaminant
Patient alr eady with possible skin contaminant?
same or ganism
same
antibio-gr am
sampling date >5d
do not count
no
no
no
no
no
no
no
no
no
yes
yes
yes
yes
yes
yes
cantly the advice for empiric use of fusidic acid (RDM: 33%, DFM: 33%, and CFM: 19% resistance; P = 0.024).
Discussion
For small hospitals, a manually conducted review and analysis of microbiological data is achievable, but limited by the small numbers of isolates and therefore ensuing a decreased reliability of results. At large institutions, there is often an enormous pool of microbiological data, yield-ing more accurate estimations on the prevalence of path-ogens, but a manually conducted review is unattainable. A large volume of clinical data demands the use of com-puter systems, which analyze data in accordance with pro-grammed "if/then" rules derived from models used by medical experts. Naturally, direct transfer of human med-ical decision-making behaviour to "if/then" rules for arti-ficial intelligence-based computer programs is not always possible, because most of the necessary information is not easily available in electronic form (for example patient temperature, abdominal discomfort, patient "looks" ill). Also, because of the heterogeneity of used laboratory and medical information systems even within the same hospi-tal, merging of information obtained from different sources is often futile. Therefore, the CFM, originally
designed as rapid method for surveillance of cases of infection, is an interesting method, although its use strongly depends on the availability of computer systems, since complex "if/then" rules for data correction of large datasets are highly time and concentration consuming and consecutive human errors never can be ruled out.
However, because of the requirement of at least two sets of positive blood cultures within 5 days, the prevalence of true bacteraemia caused by possible skin contaminants may be underestimated by the CFM if the practice of obtaining only one set of blood cultures is common. This situation usually does not arise at ICUs, since in this set-ting often more than one set of blood culture is drawn on consecutive days. The rationale for this practice is moni-toring for success of therapy, and not to miss additional infections by multiple resistant pathogens during antimi-crobial therapy.
On the other hand, the CFM enables to study those micro-organisms classified as "true" pathogens, and hence being clinically and epidemiologically more relevant. Also, this method gives better estimation of the proportion of the organism isolated from blood cultures. Our study showed Table 1: Comparison of the spectrum and ranking of microorganisms identified from blood cultures in 13 ICUs (1998–2004), analyzed by different data pre-processing methods.
RDMa DFMb CFMc
Rank Microorganism n % Rank Microorganism n % Rank Microorganism n %
1 Staphylococcus epidermidis 448 31.4% 1 Staphylococcus epidermidis 305 32.1% 1 Staphylococcus aureus 123 20.6% 2 Staphylococcus aureus 198 13.9% 2 Staphylococcus aureus 123 12.9% 2 Staphylococcus epidermidis 80 13.4% 3 Candida albicans 96 6.7% 3 Pseudomonas aeruginosa 58 6.1% 3 Pseudomonas aeruginosa 58 9.7% 4 Pseudomonas aeruginosa 89 6.2% 4 Candida albicans 56 5.9% 4 Candida albicans 56 9.4% 5 Escherichia coli 71 5.0% 5 Escherichia coli 41 4.3% 5 Escherichia coli 41 6.9% 6 Enterobacter cloacae 63 4.4% 6 Enterobacter cloacae 36 3.8% 6 Enterobacter cloacae 36 6.0% 7 Enterococcus faecalis 45 3.2% 7 Enterococcus faecalis 29 3.0% 7 Enterococcus faecalis 29 4.8% 8 Enterococcus faecium 34 2.4% 8 Enterococcus faecium 27 2.8% 8 Enterococcus faecium 27 4.5% 9 Acinetobacter baumannii 26 1.8% 9 Klebsiella pneumoniae 16 1.7% 9 Klebsiella pneumoniae 16 2.7% 10 Staphylococcus
haemolyticus
24 1.7% 10 Staphylococcus haemolyticus
15 1.6% 10 Acinetobacter baumannii 13 2.2%
others 333 23.3% Others 245 25.8% others 119 19.9%
Total 1427 100.0 Total 951 100.0 total 598 100.0
a RDM = raw data method; b DFM = duplicate-free method; c CFM = contaminant-free method.
Table 2: Difference of proportions according to applied data correction method for possible skin contaminants.
RDM vs. DFM RDM vs. CFM DFM vs. CFM
% difference χ2 p-value % difference χ2 p-value % difference χ2 p-value
S. epidermidis 0.7% 0.12 0.728 18.0% 70.96 < 0.0001* 18.7% 68.69 < 0.001* S. haemolyticus 0.1% 0.04 0.844 0.6% 1.33 0.249 0.7% 0.90 0.342
Corynebacterium spp. 0.2% 0.14 0.705 1.1% 2.26 0.132 1.3% 2.93 0.087
Table 3: Difference of proportions according to applied data correction method for obligate pathogens.
RDM vs. DFM RDM vs. CFM DFM vs. CFM
% difference χ2 p-value % difference χ2 p-value % difference χ2 p-value
S. aureus 1.0% 0.43 0.510 6.7% 14.15 0.0002* 7.7% 16.02 < 0.001* C. albicans 0.8% 0.67 0.413 2.7% 4.22 0.039* 3.5% 6.61 0.010* P. aeruginosa 0.1% 0.02 0.881 3.5% 7.50 0.006* 3.6% 6.93 0.008*
χ2 = Chi-square test; A p-value less than 0.05 (*) is considered to indicate a statistically significant difference.
a percentage of 13.4% of Staphylococcus epidermidis using CFM, which is a very plausible estimation on the real pro-portion of infections caused by this organism according to previous results of prospective studies on catheter-related infections at ICUs [17]. Regarding susceptibility pattern and implications on empiric antibiotic therapy, the CFM showed only a difference to DFM or RDM for fusidic acid. With regard to the associations of empiric therapy and antimicrobial susceptibilities, the difference for the CFM
method for fusidic acid, while an interesting observation, is not relevant to the topic of the study question.
Conclusion
Our study demonstrates that different approaches towards raw data correction – none (RDM), duplicate-free (DFM), and a contaminant-free method (CFM) – show different results in analysis of positive blood cultures. Regarding the spectrum of microorganisms, RDM and DFM yielded almost similar results in ranking of
microor-Cumulative antimicrobial resistance profile of gram positive organisms
Figure 3
Cumulative antimicrobial resistance profile of gram positive organisms. PEN = penicillin; OXA = oxacillin; ERY = erythromycin; CLI = clindamycin; GEN = gentamicin; AMK = amikacin; FOF = fosfomycin; FUS = fusidic acid; TMP = trimetho-prim; RIF = rifampicin; CIP = ciprofloxacin; MOX = moxifloxaciln; TEC = teicoplanin; VAN = vancomycin.
0% 10% 20% 30% 40% 50% 60% 70% 80% 90% 100%
PEN OXA ERY CLI GEN AMK FOF FUS TMP RIF CIP MOX TEC VAN
% resistance
ganisms, whereas using the CFM resulted in a clinically and epidemiologically more plausible spectrum. For pos-sible skin contaminants, the proportion of microorgan-isms in terms of number of episodes is most influenced by the CFM, followed by the DFM. However, with exception of fusidic acid for gram-positive organisms, none of the evaluated correction methods would have changed advice for empiric therapy on the selected ICUs.
Competing interests
The authors have no competing, financial or other conflict of interest to declare in relation to this manuscript and declare no financial or other relationships leading to a conflict of interest. KPA is co-owner of Medexter Health-care GmbH, Borschkegasse 7/5, A-1090 Vienna, Austria, a company specialized in development of medical expert systems in medicine. KPA has no financial or other com-peting conflict of interest related to results or conclusions related to the presented work.
Authors' contributions
OA had the idea for the study and planned and conducted the experiments, as well drafted and wrote the manu-script, analyzed and interpreted the data. He also con-ducted the statistical analysis of the results. MDE participated in the technical design of the study and per-formed re-testing of the calculations, analyzed and inter-preted the data. AM helped drafting the material and method section of the paper, particularly on microbio-logical matters. AB helped to draft the manuscript, and re-analyzed and interpreted the data. WK and KPA advised in design and coordination of the study and provided the technical background for collecting and mining data. All authors have been involved in drafting the manuscript or revising it critically for important intellectual content and have read and approved the final manuscript.
Acknowledgements
This study was funded by the Division of Hospital Hygiene, Department of Hygiene and Medical Microbiology of the Medical University of Vienna. The processing and publication charges were kindly funded by Saraya Co., Osaka, Japan.
Cumulative antimicrobial resistance profile of gram negative organisms
Figure 4
Cumulative antimicrobial resistance profile of gram negative organisms. AMP = ampicillin; AMC = amoxicillin-clavu-lanic acid; AZL = azlocillin; IPM = imipenem; CFZ = cefazolin; FAM = cefamandole; CTX = cefotaxime; CRM = cefpirom.
0% 10% 20% 30% 40% 50% 60% 70% 80% 90% 100%
AMP AMC AZL IPM CFZ FAM CTX CRM
% res
ist
an
ce
Publish with BioMed Central and every scientist can read your work free of charge "BioMed Central will be the most significant development for disseminating the results of biomedical researc h in our lifetime."
Sir Paul Nurse, Cancer Research UK
Your research papers will be:
available free of charge to the entire biomedical community
peer reviewed and published immediately upon acceptance
cited in PubMed and archived on PubMed Central
yours — you keep the copyright
Submit your manuscript here:
http://www.biomedcentral.com/info/publishing_adv.asp
BioMedcentral
References
1. Ruden H, Gastmeier P, Daschner FD, Schumacher M: Nosocomial and community-acquired infections in Germany. Summary of the results of the First National Prevalence Study (NIDEP). Infection 1997, 25:199-202.
2. Byl B, Clevenbergh P, Jacobs F, Struelens MJ, Zech F, Kentos A, Thys JP: Impact of infectious diseases specialists and microbiologi-cal data on the appropriateness of antimicrobial therapy for bacteremia. Clin Infect Dis 1999, 29:60-66.
3. Munson EL, Diekema DJ, Beekmann SE, Chapin KC, Doern GV:
Detection and treatment of bloodstream infection: labora-tory reporting and antimicrobial management. J Clin Microbiol 2003, 41:495-497.
4. National Committee on Clinical Laboratory Standards: Analysis and Presentation of Cumulative Antimicrobial Susceptibility Test Data; Approved Guideline. In NCCLS document M39-A NCCLS, 940 West Valley Road, Suite 1400, Wayne, Pensilvania 19087-1898, USA; 2002. ISBN 1-56238-422-8
5. Richter SS, Beekmann SE, Croco JL, Diekema DJ, Koontz FP, Pfaller MA, Doern GV: Minimizing the workup of blood culture con-taminants: implementation and evaluation of a laboratory-based algorithm. J Clin Microbiol 2002, 40:2437-2444.
6. Spencer RC: Epidemiology of infection in ICUs. Intensive Care Med 1994, 20:2-6.
7. Spencer RC: Predominant pathogens found in European prev-alence of infection in intensive care study. Eur J Clin Microbiol Infect Dis 1996, 15:281-285.
8. Pittet D, Tarara D, Wenzel RR: Nosocomial bloodstream infec-tion in critically ill patients. JAMA 1994, 271:1598-1601. 9. Rello J, Ricart M, Mirelis B, Quintana E, Gurgui M, Net A, Prats G:
Nosocomial bacteremia in a medical-surgical intensive care unit: epidemiology, characteristics and factors influencing mortality in 111 episodes. Intensive Care Med 1994, 20:94-98. 10. Yokoe DS, Anderson J, Chambers R, Connors M, Finberg R, Hopkins
C, Lichtenberg D, Marino S, McLaughlin D, O'Rourke E, Samore M, Sands K, Strymish J, Tamplin E, Vallonde N, Platt R: Simplified sur-veillance for nosocomial bloodstream infections. Infect Control Hosp Epidemiol 1998, 19:657-660.
11. Garner JS, Jarvis WR, Emori TG, Horan TC, Hughes JM: CDC defi-nitions for nosocomial infections, 1988. Am J Infect Control 1988,
16:128-140.
12. Chizzali-Bonfadin C, Adlassnig K-P, Koller W: An intelligent data-base and monitoring system for surveillance of nosocomial infections. Proceedings of the 8th World Congress on medical informat-ics (MEDINFO 95): Healthcare computing and communications, Edmon-ton, Canada 1995:1684.
13. Assadian O, Adlassnig K-P, Rappelsberger A, Koller W: MONI – An Intelligent Infection Surveillance Software Package. In Intelli-gent Systems in Patient Care Edited by: Adlassnig K-P. Österreichische Computer Gesellschaft, Vienna, Austria; 2001:49-56.
14. Fabini B: Monitoring of infectious risk situations and nosoco-mial infections in the hospital. Thesis at the Technical University Vienna, Faculty of technical-natural sciences, Vienna, Austria 2001. 15. Heisz H: Praktisch orientierte Konzepte der Inferenz mit
fuzzy-Regeln auf Grundlage des nosokomialen Diagnosesys-tems MONI-IV. Thesis at the Technical University Vienna, Faculty of Informatics, Vienna, Austria 2004 .
16. National Committee on Clinical Laboratory Standards: Approved Guideline NCCLS document M100-S8 (1998). NCCLS, 940 West Valley Road, Suite 1400, Wayne, Pensilvania 19087-1898, USA. 17. Herwaldt LA, Geiss M, Kao C, Pfaller MA: The positive predictive value of isolating coagulase-negative staphylococci from blood cultures. Clin Infect Dis 1996, 22:14-20.
Pre-publication history
The pre-publication history for this paper can be accessed here: