[Deng * et al., 5(12): December, 2018]
ISSN: 2349-5197
Impact Factor: 3.765
I
NTERNATIONAL
J
OURNAL OF
R
ESEARCH
S
CIENCE &
M
ANAGEMENT
THE MICROPHONE ARRAY MULTI DOMAIN FUSIONS LOCATION
ARITHMETIC
Changjian Deng*
Department of Control engineering, Chengdu University of information Technology, Chengdu
DOI: 10.5281/zenodo.2528771
Keywords: multi domain; fuzzy recognize; phase lock cross correlation; microphone array; location.
Abstract
To solve the problem that the location accurate is hard to hold under the environment of noise and interfere when using Generalized cross correlation algorithm in microphone array, the paper approaches a delay estimation arithmetic based on multi domain fusions fuzzy recognize. Cross correlation or generalized cross correlation algorithm cannot eliminate the delay calculation error in principle, so the paper combines with characteristics of the time-frequency fault signal and fisher information matrix, adopts the location arithmetic of multi domain fuzzy recognize and phase lock cross correlation, then improves the robustness and accurate of location calculation in Spherical microphone array, and the Numerical simulation results prove the validation of arithmetic.
Introduction
The location technology often uses microphone array to receive the faults signal. For example, the wide aperture array is applied in [1][2]. Currently, there are five kinds of Time Difference of Arrival location algorithms[3]: Independent variable analysis method based on multi-source signals, it obtains the time difference of arrival (TDOA) information in frequency domain[4] [5] [6] ;
Short-time sparsity spectrum analysis method based on audio signal TDOA estimation , it uses an approximate assumption that the energy of a single source is dominant in each time-frequency support domain[7] [8]; Spectral subtraction is used to suppress additive noise before delay estimation[9][10];
Noise reduction method based on the subspace technology, for example, the optimal filtering method based on generalized singular value decomposition[11][12];
The analysis techniques based on human ear auditory characteristics, etc13][14].
The methods of 1) and 2) have the assumption that the power of single sound source is dominant, it is difficult applied in the complicate noise environment and the vary location source. And the methods of 3) and 4) is the pro-filter location technology, it should work together with other technology to obtain the location information. The method of 5) should establish head-related transfer function based on auricular effect, it is complicate in the theory and technology. In multi sound sources, large noise, and large interfere environment, the theory and technology of location is difficult to realize.
The contributions of paper are : A fusion localization algorithm based on multi-domain fuzzy recognition and phase-locked filtering is proposed in the paper based on the characteristics of signal and noise in different processing domains.
The paper is arranged as follow: Section I introduces the accuracy theory of fault location, Section II establish multi domain fusion theory and method based on Fuzzy Mathematics, Section III present the numeral simulation and analysis, the Conclusion is given in Section IV.
The accuracy theory of fault location
In order to make the measurement accuracy meet the system requirements, microphone array location algorithm proposes the appropriate processing methods based on utilizing a variety of information (prior and posterior information, time-frequency, time-frequency, space-frequency domain related information).
Quantitative measurement of time delay localization is described that the Cramo-Rao limit 𝐶𝑅𝐵(𝜏𝑖𝑗) of time
[Deng * et al., 5(12): December, 2018]
ISSN: 2349-5197
Impact Factor: 3.765
I
NTERNATIONAL
J
OURNAL OF
R
ESEARCH
S
CIENCE &
M
ANAGEMENT
expectation of the relationship between various conditional probability functions of delay estimation and the second derivative of delay is, the lower value of the Cramo-Rao limit is; the higher the noise-signal ratio is, the lower value of the Cramo-Rao limit is.
Table.1 shows the processing domain and its key problem to be solved.
Table 1. Application range of classic algorithms
algorithms Processing domain Key technology and problem
Sound intensity , sound pressure,
location
Time-frequency domain
Key technology: Vector sound intensity, acoustical holography, Equal intensity line Problem: Synchronization and vibration fusion Cepstrum and
correlation spectrum
frequency domain Key technology: Spectral array analysis
Problem: Prediction and filtering
subjective
evaluation index Multi domain
Key technology: experts’ database Problem: Fuzzy logic Beamforming,
controllable response
Spatial, Time-frequency domain
Key technology: Reverse composition, sound field reconstruction, auditory characteristics Problem: relativity;
Theory and method of multi domain fusion
In this paper, Fisher information matrix is used to improve the accuracy, reliability and robustness of sound source recognition.
From the point of view of sound source localization, if a specific sound source is assumed to be a 'signal', the other objects are 'noise', there are two assumptions.
Assumption 1,(it comes from Signal-noise ratio): The accuracy of positioning is a function of the definiteness of the target and the certainty of its position, or, the smaller the uncertainty of measurement under conditional probability is, the higher the accuracy is.
Assumption 2, Sound source signal information characteristics are determined by its characteristics in multiple domains.
The Assumption 2 can be retrieved from the location methods of Table 1, for example,using the method of proof by contradiction.
The two assumptions shows: it is not consistent with the actual situation and application satisfaction that studying location accuracy in isolation without considering sound source and noise characteristics.
In order to study the characteristics of sound source and noise, the paper discussed fuzzy set to introduce the technology of multi-domain fusion.
2.1 Definition of multi domain fuzzy signal and fuzzy set
Definition 1:Sound source signal set, it is used to locate sound source in the environment. For example {Noise, Large Noise, Faults sound source, Interfere sound}, and so on. It come from sound frame contain special context. Here gives an example, a system consists of two microphones, every microphone has one signal condition circuit, its membership function is 𝜇𝐴(𝑥) , its fuzzy set is 𝐴 = {𝜇𝐴(𝑥𝑖) 𝑥𝑖} , another microphone’s membership function
is 𝜇𝐵(𝑥) , its fuzzy set is 𝐵 = {𝜇𝐵(𝑥𝑖) 𝑥𝑖}.
The fusion similarity computation method of two voices signal uses the equation of the relationship calculation between fuzzy sets A and B. And the relationship calculation is represented by the Related operators.
Definition 2 Frequency domain signal feature fuzzy sets: it consists of signal have obverses frequency feature. for example,{ Gauss white noise spectrum signal, Separate spectrum signal, Local continuous spectrum signal, Full continuous spectrum signal , irregular spectrum signal }.
[Deng * et al., 5(12): December, 2018]
ISSN: 2349-5197
Impact Factor: 3.765
I
NTERNATIONAL
J
OURNAL OF
R
ESEARCH
S
CIENCE &
M
ANAGEMENT
Definition 4 Characteristic fuzzy sets of time-frequency signals: the signal in this set has obverse time-frequency feature. For example, {Discrete time frequency, LFM signal, time-frequency domain noise}.The definition 2 to definition 4 is based on the subspace of ‘signal subspace’ and ‘noise subspace’, it has two characteristics: one is the signals in different processing domains are interconnected and not completely corresponding, the other is that there are many kinds of signals and the definition of ambiguity is incomplete, that is to say, the signal characteristics of each fuzzy set are incomplete.
Table 2. normal fuzzy operating subset in multi domain fusion
Related operators Meaning
Cartesian product
set 𝑼 × 𝑽 = {(𝒙, 𝒚)|𝒙 ∈ 𝑼, 𝒚 ∈ 𝑽}
Absolute Hamming
distance
𝒅(𝑨, 𝑩) = ∑|𝝁𝑨(𝒙𝒊) − 𝝁𝑩(𝒙𝒊)| 𝒏
𝒊=𝟏
Relative Hamming
distance 𝜹(𝑨, 𝑩) =
𝟏 𝒏𝒅(𝑨, 𝑩)
inner product 𝑨 ∘ 𝑩 = ∨
𝒖∈𝑼[𝝁𝑨(𝒙) ∧ 𝝁𝑩(𝒙)]
Outer product 𝑨𝜣𝑩 = ∧
𝒖∈𝑼[𝝁𝑨(𝒙) ∨ 𝝁𝑩(𝒙)]
2.2. Membership of multi domain fuzzy fusion recognition
(1) Membership degree calculation of different microphone based on their similarity
In general, the time-frequency domain signal has good performance representative feature. For example, the membership function of STFT (Short time Fourier transform signal) is described as its effective value vs max effective value, it is shown in equation 1.
𝜇𝑖(𝑋) = 𝑆𝑇𝐹𝑇𝑖/𝑀𝐴𝑋_𝑆𝑇𝐹𝑇 (1)
In equation (1),i(x) is its membership function,𝑆𝑇𝐹𝑇𝑖 is its effective value of STFT, 𝑀𝐴𝑋_𝑆𝑇𝐹𝑇 is max effective value in its transfer domain.
(2) Membership degree calculation based on signal characteristic
One kind of this method is based on statistics, the membership degree of a time domain signal is calculated by its one to four center moment and its feature in different window( different scale fixed window, moving window, changing window) . For example, the Gauss noise signal, the reciprocal of mean (first moment) deviation (ratio greater than 1) under a fixed window of a certain size is its membership degree. The definition of other signals is similar.
Another kind of this method is to calculate data based on data transformation, and the definition of the membership degree is the same as the former method.
When membership degree function is determined. Fuzzy Model Recognition Based on "Parallel" Fuzzy Sets The method based on maximum membership degree and closeness degree is often adopted. There is a correlation between multi domain signals, and the weight of membership function of different domain signals is normally the function of the membership value of its processing domain. And so, the membership of multi domain fusion is a functional in defining signal and noise space.
Definition 3: closeness of fuzzy numbers. If Γ(𝑈) is fuzzy power set of domain U, map
𝜎: Γ(𝑈) × Γ(𝑈 → [0,1]
(𝐴, 𝐵) → 𝜎(𝐴, 𝐵) ∈ [0,1], Satisfy:
1)
𝜎(𝐴, 𝐴) = 1, ∀𝐴 ∈ Γ(𝑈) 2)
𝜎(𝐴, 𝐵) = 𝜎(𝐵, 𝐴), ∀𝐴, 𝐵 ∈ Γ(𝑈) 3)
[Deng * et al., 5(12): December, 2018]
ISSN: 2349-5197
Impact Factor: 3.765
I
NTERNATIONAL
J
OURNAL OF
R
ESEARCH
S
CIENCE &
M
ANAGEMENT
Then 𝜎(𝐴, 𝐵) is closeness of fuzzy numbers A and B.
2.3. Hierarchical fuzzy rules with fusion recognition
Multi domain fuzzy fusion needs to be divided into two steps, the first step is identifying characteristic signals, the second step is determining the parameters of the signal.
To judge the characteristic signal, it is necessary to recognize the location signal according to its characteristics. That is to say, whether the feature signal exists or not in different feature fuzzy sets. Often uses the rule of “if….then….”. Multi domain judgment is conducive to analyzing signal and aliasing signals with internal causality.
To determine the parameter of signal, the direct way is using "if...Then... "Rule to build the construction equation and regard the heuristic rules as an input linear function. This is shown in equation(2).
𝑓𝑖(𝑋1, 𝑋2, … 𝑋𝑛) = 𝑎1𝑖𝑥1+ 𝑎2𝑖𝑥2+ ⋯ + 𝑎𝑛𝑖𝑥𝑛+ 𝑎𝑛+1𝑖 (2)
The other way is to make full use of system information, for example,(1) store the last time value, and determine the feature of this time using the last time and now time value;(2) identify using the correlation of multi signal.
2.4. Defuzzy method using fusion recognition
The hierarchical defuzzied method is described as : in a fuzzy system f(x), using 𝑁1× 𝑁2 rule , Mamdami minimal
influence rule equation (3), defuzzied method are separate hierarchical and center hierarchical defuzzied methods.
{
𝜇𝐵′(𝑦) = 𝑚𝑎𝑥(𝑠𝑢𝑝 𝑚𝑖𝑛(𝜇𝐴1(𝑥), 𝜇𝐴2(𝑥)))
𝜇𝐴′(𝑥) = {1; 𝑖𝑓(𝑥 = 𝑥 ∗)
0; 𝑜𝑡ℎ𝑒𝑟𝑤𝑖𝑠𝑒
(3)
2.5. Phase-locked correlation delay algorithm
Phase-locked correlation delay algorithm is based on signal-correlation technology, it obtains the delay difference between the reference signal source and every microphone circuit though calculating the correlation to get delay time of every microphone. Their theory scheme diagram is shown in Fig.1.
Correlation between the reference signal source and first microphone is shown in (4): 𝑊1[𝑅(𝜏)]𝑖𝑤= 𝑊1[
1
2𝑇∫ 𝑓1𝑤(𝑡)𝑓2𝑤(𝑡 − 𝜏)𝑑𝑡 𝑇
−𝑇 ]𝑖𝑤 (4)
[Deng * et al., 5(12): December, 2018]
ISSN: 2349-5197
Impact Factor: 3.765
I
NTERNATIONAL
J
OURNAL OF
R
ESEARCH
S
CIENCE &
M
ANAGEMENT
𝑓1𝑤(𝑡) is test signal,𝑓2𝑤(𝑡) is feature reference signal though fuzzy identity,
𝑤 is the length of signal, it is same with calculation signal,
𝑊[. . . ]𝑖𝑤represent their correlation value, its start point is ‘i’,its width is w.
Correlation between the reference signal source and second microphone is shown in (5): 𝑊2[𝑅(𝜏)]𝑖𝑤 = 𝑊2[
1
2𝑇∫ 𝑓3𝑤(𝑡)𝑓2𝑤(𝑡 − 𝜏)𝑑𝑡 𝑇
−𝑇 ]𝑖𝑤 (5)
Then calculating their extreme value function, using equation (6) and (7) obtain their delay time value,
1and
2 .𝝉1= 𝑓(𝑚𝑎𝑥( 𝑊1[ 1
2𝑇∫ 𝑓1𝑤(𝑡)𝑓2𝑤(𝑡 − 𝜏)𝑑𝑡 𝑇
−𝑇 ]𝑖𝑤)) (6)
𝝉2= 𝑓(𝑚𝑎𝑥( 𝑊2[ 1
2𝑇∫ 𝑓3𝑤(𝑡)𝑓2𝑤(𝑡 − 𝜏)𝑑𝑡 𝑇
−𝑇 ]𝑖𝑤)) (7)
Without loss of generality, here using the average value as their delay time value. As equation (8). 𝜏 =∑ 𝜏1
𝑛 − ∑ 𝜏2
𝑛 (8)
n is the length of sequence.
Numerical simulation and results
3.1. Identification and location of signal feature sources
Choice two time-frequency domain signal (equation (9)) to identify their location. 𝑥(𝑖) = 𝑠(𝑖) + 𝑛(𝑖) + 𝑑(𝑖); 𝑖 = 1, . . . , 𝑁 (9)
Their time-frequency domain signal is s(i), additive random noise is n(i), interfere signal is d(i),the number of acquire point is N.
𝑠(𝑖) = 𝑎 ⋅ 𝑒𝑗(𝜔0𝑖+12𝑘𝑖2) (10)
In equation (10), the amplitude is ‘a’, the Tuning slope is ‘k’, the initial frequency is
0. The relationship between Tuning slope and frequency bandwidth B is shown in equation (11). 𝑘 = 2𝜋⋅𝐵𝐹𝑠⋅𝑡𝑚𝑎𝑥
(11)
In equation (11), the sample frequency is 𝐹𝑠, the longest sample time length is tmax ,for example, the initial
frequency is 500Hz,the bandwidth is 1000Hz. The STFT of signal is shown in Fig.(2).
The left of Fig.2 shows the no interfere signal, the noise amplitude in first plot is 0.5 times of signal, and the third plot is 0.3 times of the signal. The right of Fig.2 shows there is 112Hz and 331Hz interfere signal with same amplitude of s(i), and the noise amplitude in second plot is 1.5 times of signal, and the forth plot is 1.8 times of the signal.
[Deng * et al., 5(12): December, 2018]
ISSN: 2349-5197
Impact Factor: 3.765
I
NTERNATIONAL
J
OURNAL OF
R
ESEARCH
S
CIENCE &
M
ANAGEMENT
Considering signal feature and its random performance, here adopt the method of feature identify, hierarchical solution. The procedure is in following:
calculate the closeness and membership degree of determine domain; and calculate the relative Hamming distance; Owing the fuzzy expert rules, fusion in multi domain, judge the performance of characteristics attitude.
Step 1, judge the global closeness, for example, the Hamming distance is one scale of closeness. Step 2, identify the type of signal. The fuzzy identify process is in the following procedure.
A The base signal fuzzy set in the time domain expert identify knowledge base include: { Gauss white noise signal, Large impulse impact signal, Periodic positive rotation signals with fixed (less than 3 main frequency combinations), LFM signal, random signal, coloured noise}
B the base signal fuzzy set in the frequency domain expert identify knowledge base include:
{ Gauss white noise spectrum signal, Separate spectrum signal, Local continuous spectrum signal, Full continuous spectrum signal , irregular spectrum signal }
C There is relationship between the time domain and frequency domain, for example, they are all influenced by the definition of test data, the fuzzy feature of machine judgement, and the uncertain measurement data.
D The knowledge database in time-frequency domain is built based on the window time and frequency transform. E the results of simulation is described in the following:
Figure. 3 Time domain statistic plot of two signal under different noise
The two channels signal in moving time domain, their first order, second order, third order moment is shown in Fig.3. It is obverse that there is pulse interfere signal in first order moment plot, and there is no uniform signal in second order moment plot for it can be less influenced by noise, and there is similar trend in third order moment plot.
The noise feature is defined by its plot, for example, in first order moment plot, the noise is 0.1-0.5 times of signal; in second order moment plot, the noise is 3-4 times of signal; in third order moment plot, the noise is -0.2-0.4 times of signal. The sin signal feature is also defined by its plot, , in first order moment plot, the sin signal is 0.01-0.05 times of signal; in second order moment plot, the sin signal is 0.4 times of signal; in third order moment plot, the sin signal is -0.04 times of signal; The LHF signal feature is also defined by its plot, , in first order moment plot, the LHF signal is 0.01-0.03 times of signal; in second order moment plot, the LHF signal is 0.02 times of signal; in third order moment plot, the LHF signal is 3 to -0.0004 times of signal.
[Deng * et al., 5(12): December, 2018]
ISSN: 2349-5197
Impact Factor: 3.765
I
NTERNATIONAL
J
OURNAL OF
R
ESEARCH
S
CIENCE &
M
ANAGEMENT
Step 3, the relationship of signal; similarity judgement between adjacent frame and continue frame using feature distance with short time window technology. First identity sin signal, then calculate signal autocorrelation, then judge the signal is random signal, random sin signal, and judge its Stationarity and power spectrum density and ergodic nature, for example using the STFT windows.
Step 4, judge the real signal feature and its style from the results of step 2 and step 3 using Hierarchical fuzzy rules.
Select filter and feature extraction method owing it performance.
For example, the LHF signal, experiments and simulations show that the accuracy of detection if the characteristics of signal should be predicted and extracted, and if the noise should be decreased.
Calculation the delay time value and the location of sound source, for example, calculating the delay with correlation or phase lock technology.
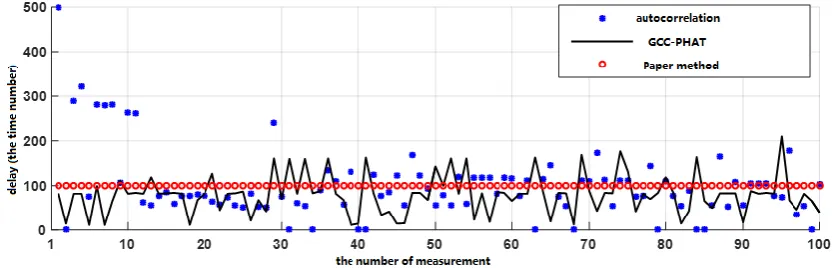
3.2. The comparision of tradition alogrithm with the alogrithm of paper
Using the second signal of Figure(2), paper use autocorrelation, GCC-PHAT, and the algorithm of paper to calculate the delay time value, they are shown in Figure.4.
In figure.4, calculate the results of 100 tests. The results show the algorithm has the good robustness and stability, even if in large noise and interfere signal.
Figure. 4 Comparisons of delay circulation using different methods
Conclusions
To solve the problem of LHF sound source location in rotation machine, paper researches the traditional filter correlation methods, GCC-PHAT, and multi domain fusion location methods. The results shows
1)The membership degree of relation signal should calculate using hierarchical fuzzy rules
2)The accuracy of positioning is a function of the definiteness of the target and the certainty of its position, or, the smaller the uncertainty of measurement under conditional probability is, the higher the accuracy is.
References
[1] Xu K, Chen Y, Jiang Y, et al. Aerodynamic noise source detection for main landing gear based on phased microphone array technique[J]. ACTA Aerodynamica Sinica ,2015, Vol. 33(4): 523-529.
[2] Wang Xunnian, Li Zhengchu,Chen Zhengwu,etal. Rearching on aerodynamic noise sources identification technology in anechoic wind tunnel[J].Acta Aerodymaica Sinica,2012,30(3):284-290. [3] Dirk Bechleg, Kristian Kroschel,Reliability Criteria Evaluation for TDOA Estimates in a Variety of
Real Environments,2005 IEEE Int.Conf.Acoustics,Speech and Signal Processing(ICASSP), Pennsylvania,Philadelphia,USA,2005:985—988.
[Deng * et al., 5(12): December, 2018]
ISSN: 2349-5197
Impact Factor: 3.765
I
NTERNATIONAL
J
OURNAL OF
R
ESEARCH
S
CIENCE &
M
ANAGEMENT
[5] Nesta F, Omologo M. Generalized state coherence transform for multidimensional TDOA estimation of multiple sources[J]. IEEE Transactions on Audio, Speech, and Language Processing, 2012, 20(1): 246 - 260
[6] Reddy V, Khong W H, and NG B P. Unambiguous speech DOA estimation under spatial aliasing conditions[J].IEEE Transactions on Audio, Speech, and Language Processing, 2014, 22(12): 2133 - 2145.
[7] Y. Fang,Z. Xu. A Robust Algorithm for Unambiguous TDOA Estimation of Multiple Sound Sources under Indoor Environment [J]. Journal of Electronics & Information Technology.2016, 38(5).
[8] TSIAMI A, KATSAMANIS A, MARAGOS P, et al. Experiments in acoustic source localization using sparse arrays in adverse indoors environments[C]. Proceedings of 2014 European Signal Processing Conference (EUSIPCO), Lisbon, Portugal, 2014: 2390 - 2394.
[9] Xia W D, Liang Y F. Combining beamforming and spectral subtraction for microphone array speech enhancement[J]. Journal of Dalian University of Technology, 2006, 46(1):121-126.
[10]Kumatani K, Mcdonough J, Raj B. Microphone Array Processing for Distant Speech Recognition [C]. From Close-talking Microphones to Far-field Sensors Apsipa Summit and Conference. 2012:1-10. [11]Bai-Qiang Y, He Y G, Wu X M. A method for magnetocardiograms filtering based on singular value
decomposition and S-transform[J]. Acta Physica Sinica, 2013, 62(14):148702-2293.
[12]Arvinti-Costache B, Costache M, Stolz R, et al. A wavelet based baseline drift correction method for fetal magnetocardiograms[C]// New Circuits and Systems Conference (NEWCAS), 2011 IEEE 9th International. IEEE, 2011:109-112.
[13]Li Danfeng.Computational models for binaural sound source localization and sound understanding[D] :]Ph.D].USA:University of Illinoisat Urbana—Champaign,200
[14]Gaese B H,Wagner H.Precognitive and cognitive elements in sound localization[J].Zoology,2002 ,105(4):329-339.
[15]Pedrycz W. Fuzzy Sets in Pattern Recognition: Methodology and methods[J]. Pattern Recognition. 23(1/2): 121-146.