© Universiti Tun Hussein Onn Malaysia Publisher’s Office
IJIE
Journal homepage: http://penerbit.uthm.edu.my/ojs/index.php/ijie
The International
Journal of
Integrated
Engineering
ISSN : 2229-838X e-ISSN : 2600-7916
Classification of Myoelectric Signal using Spectrogram Based
Window Selection
Jingwei Too
1, A.R. Abdullah
1*, Norhashimah Mohd Saad
2, N Mohd Ali
1,
T.N.S. Tengku Zawawi
11Faculty of Electrical Engineering,
Universiti Teknikal Malaysia Melaka, Jalan Hang Tuah Jaya, 76100 Durian Tunggal, Melaka, MALAYSIA
2Faculty of Electronic and Computer Engineering,
Universiti Teknikal Malaysia Melaka, Jalan Hang Tuah Jaya, 76100 Durian Tunggal, Melaka, MALAYSIA
*Corresponding Author
DOI: https://doi.org/10.30880/ijie.2019.11.04.021
Received 7 August 2019; Accepted 22 August 2019; Available online 31 August 2019
1. Introduction
According to the statistics of National Limb Loss Information Centre, vascular disease and trauma were the main causes for upper limb loss [1]. Due to the loss of upper limb, trans-radial amputees have the difficulty to perform daily life tasks. Unlike healthy human, trans-radial amputees require a smart and multifunction myoelectric prosthetic to ensure they can execute many actions that people do in their everyday life [2]. In recent days, surface electromyography (EMG) has been widely used in upper limb myoelectric prosthetic. Advance rehabilitation indicates myoelectric prosthetic regained at least a significant part of lost hand functionality [3].
EMG is a natural source that contains the rich neural information to stimulate motion classification and myoelectric control [4]. Naturally, EMG measures the electric potential generated by the muscle cells when there is a muscular electrical activity such as hand motion [5]. Multichannel EMG recording offers a recognition of hand movement types corresponding to the specific pattern of myoelectric signal. However, the recognition of EMG signals is usually difficult due to the complex nature of the signal itself [6]. Additionally, EMG signals often contaminated by the heart electrical activity, motion artifact and noise [7], [8]. In such case, signal processing is preferred for analyzing the EMG signals.
Abstract: This paper presents a study of the classification of myoelectric signal using spectrogram with different window sizes. The electromyography (EMG) signals of 40 hand movement types are collected from 10 subjects through NinaPro database. By employing spectrogram, the EMG signals are represented in time-frequency representation. Ten features are extracted from spectrogram for performance evaluation. In this study, two classifiers namely support vector machine (SVM) and linear discriminate analysis (LDA) are used to evaluate the performance of spectrogram features in the classification of EMG signals. To determine the best window size in spectrogram, three different Hanning window sizes are examined. The experimental results indicate that by applying spectrogram with optimize window size and LDA, the highest mean classification accuracy of 91.29% is obtained.
An increased in the time domain (TD) and frequency domain (FD) features improve the potential of EMG signal in discriminating multiple hand movements. However, TD features do not provide any spectral information in the analysis of EMG signal [4]. On the other hand, FD features describe the muscle characteristic but in the limited regular window size [9]. In other words, TD and FD features assume the EMG data as a stationary signal [10]. Hence, the time-frequency distribution (TFD) is introduced to overcome the limitation in TD and FD. TFD represents the time and frequency information of the signal simultaneously. In the previous research, most of the researchers evaluated the performance of healthy subjects in the classification of 4 to 12 hand movement types [2], [10]–[12]. Unfortunately, the number of hand movement in myoelectric control is often insufficient.
This paper aims to investigate the performance of spectrogram in differentiating 40 hand movements. Firstly, the EMG data are collected from 10 subjects through NinaPro database 4 (DB4). Then, spectrogram is applied to transform the signal into time-frequency representation (TFR). Next, ten features are extracted from each spectrogram. For performance evaluation, two popular machine learning algorithms namely support vector machine (SVM) and linear discriminate analysis (LDA) are utilized. To optimize the performance of spectrogram, three different Hanning window sizes, 128, 256 and 512 ms with 50% overlap are examined. Finally, the performance of EMG pattern recognition is discussed.
2.
Material and Methods
2.1
Structure
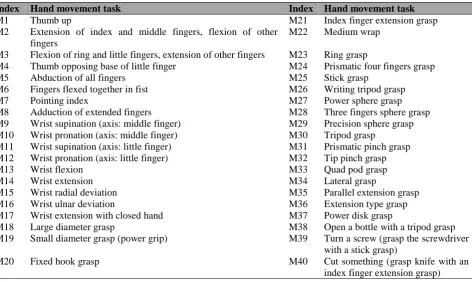
In this study, the EMG database of Non-Invasive Adaptive Prosthetics (NinaPro) project is employed. NinaPro is a publicly access EMG database that contains a large number of EMG data recording from the intact and amputee subjects [3]. In addition, NinaPro database has been successfully applied in previous works [13], [14]. This study aims to investigate the performance of spectrogram in discriminating large number of hand movement types. For this reason, the EMG data of 40 hand movements (Exercise B and C) from NinaPro database 4 (DB4) are used [2]. Note that DB4 comprised of the EMG signals recorded from 10 intact subjects. Table 1 outlines the list of 40 hand movement tasks in NinaPro project. In the experiment, subjects were instructed to execute 40 different hand movements with 5 seconds each, followed by a resting state of 3 seconds. Each movement was repeated for six times. The EMG signals were acquired by using 12 surface electrodes. Eight electrodes were placed uniformly around the forearm. Another two electrodes were placed on the extensor digitorum superficialis and flexor digitorum superficialis, respectively. Finally, two electrodes were placed on the triceps and biceps brachii muscles, respectively. At the end of recording, a total number of 72 EMG signals (6 repetitions × 12 channels) were collected from each movement form each subject. The recorded EMG signals were sampled at 2k Hz with resolution of 16 bits. Nevertheless, in this study the EMG signals were initially sub-sampled by a decimation factor of 2. For pre-processing, the EMG signals were filtered by a Hampel filter to remove the 50 Hz power line interference. Moreover, the rest period was removed before signal processing.
Table 1 - List of hand movement tasks (M1-M40) in NinaPro project.
Index Hand movement task Index Hand movement task
M1 Thumb up M21 Index finger extension grasp
M2 Extension of index and middle fingers, flexion of other fingers
M22 Medium wrap
M3 Flexion of ring and little fingers, extension of other fingers M23 Ring grasp
M4 Thumb opposing base of little finger M24 Prismatic four fingers grasp
M5 Abduction of all fingers M25 Stick grasp
M6 Fingers flexed together in fist M26 Writing tripod grasp
M7 Pointing index M27 Power sphere grasp
M8 Adduction of extended fingers M28 Three fingers sphere grasp
M9 Wrist supination (axis: middle finger) M29 Precision sphere grasp
M10 Wrist pronation (axis: middle finger) M30 Tripod grasp
M11 Wrist supination (axis: little finger) M31 Prismatic pinch grasp
M12 Wrist pronation (axis: little finger) M32 Tip pinch grasp
M13 Wrist flexion M33 Quad pod grasp
M14 Wrist extension M34 Lateral grasp
M15 Wrist radial deviation M35 Parallel extension grasp
M16 Wrist ulnar deviation M36 Extension type grasp
M17 Wrist extension with closed hand M37 Power disk grasp
M18 Large diameter grasp M38 Open a bottle with a tripod grasp
M19 Small diameter grasp (power grip) M39 Turn a screw (grasp the screwdriver
with a stick grasp)
M20 Fixed hook grasp M40 Cut something (grasp knife with an
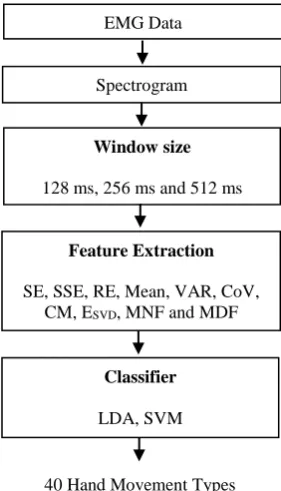
Fig.1 illustrates the flow diagram of the pattern recognition architecture. Firstly, the EMG data are collected from 10 intact subjects. Next, spectrogram is employed to transform the signal into TFR. It is worth noting there are three window sizes, 128, 256 and 512 ms with 50% overlap are used. Then, ten features including SSE, SE, VAR, CM, Mean, ESVD, MNF, MDF, RE and CoV are extracted from each TFR. After that, two widely used classifiers are utilized to evaluate the performance of spectrogram features in the classification of 40 hand movement types.
Fig. 1 - Flow diagram of the pattern recognition architecture.
2.2
Spectrogram
In signal processing, the application of TFD including spectrogram has been commonly used in the classification of EMG signals [4]. Nonetheless, spectrogram is the fundamental of TFD in analyzing signals, especially for noise and artifact reduction [15]. For biomedical signals such as non-stationary EMG signal, spectrogram overcomes the limitation of time and frequency representation. More specifically, time and frequency domain present the signal in limited regular window size [16]. To obtain the time and frequency information simultaneously, TFD is preferred.
In general, spectrogram is the square magnitude of short time Fourier transform (STFT), which represents the signal in the energy distribution on time-frequency planes [4], [17]. Additionally, spectrogram exhibits the non-stationary nature of EMG signals in time-frequency analysis. Moreover, spectrogram offers the relationship between the EMG signal and muscle characteristic, thus presenting the muscle behavior of different muscle fibre [18]. Spectrogram can be expressed as:
2 2
( , ) ( ) ( ) f
S t f x w t e d
(1)where x(τ) is the EMG signal and w(τ-t) is the Hanning window function. Hanning is a window function in digital signal processing to execute the Fourier transform by selecting a series number of samples. In TFD, Hanning window varies the time and frequency resolution to obtain the useful information from the signal. Previous studies indicated lower window size affected the accuracy of frequency related information. However, a greater window size causes lower accurate in time related information [16]. In this analysis, Hanning window size of 128, 256 and 512 ms with 50% overlap are employed in order to determine the optimal time and frequency planes. Moreover, the number of Fourier points (nfft) is same as the selected window size.
2.3
Feature Extraction using Spectrogram
EMG signal in TFR. Nevertheless, TFR consists of high dimensional matrix and it is not well suited for direct classification. To obtain the valuable information from spectrogram, ten features are extracted and described as follow. Concentration measure (CM) is used to identify the concentration of energy distribution in TFD [19]. CM with a greater value shows that the energy is distributed in the entire time-frequency plane. CM can be defined as:
EMG Data
Spectrogram
Feature Extraction
SE, SSE, RE, Mean, VAR, CoV, CM, ESVD, MNF and MDF
Classifier
LDA, SVM
40 Hand Movement Types Window size
2
1 1
( , ) L M
n k
CM S n k
(2)where S is the spectrogram, L and M are the length of time and frequency points, respectively.
Spectral entropy (SE) is a feature that used to measure the randomness of the energy distribution [19]. Generally, a lower value of SE indicates the power spectrum of spectrogram is more concentrating on the specific time-frequency plane. SE can be written as:
2
1 1
, ,
log
, k , k
L M
n k L M L M
P n k P n k SE
P n P n
(3)where P is the power spectral, L and M are the length of time and frequency points, respectively.
In general, Shannon entropy (SSE) is the fundamental of TFR feature. SSE underlines the medium tension and concentrates on the low intensities of energy in time-frequency distribution [20]. SSE can be expressed as:
2
1 1
, ,
log
, k , k
L M
n k L M L M
S n k S n k SSE
S n S n
(4)where S is the spectrogram, L and M are the length of time and frequency points, respectively.
The entropy based on singular vector decomposition (ESVD) measures the magnitude and non-zero elements in SVD by decomposing the time-frequency distribution into signal and orthogonal sub-space [19]. ESVD can be defined as:
1
log L
n n
SVD
n n n
S S E S S
(5)where Sn is the singular value of TFD processed by singular value decomposition.
Mean frequency (MNF) is computed as the sum of product of power and its corresponding frequency divided by the total sum of power [19], [21]. In this work, the average of MNF is used as feature, where MNF can be expressed as:
1 1 ( , ) ( , ) M k k M k
f P n k MNF
P n k
(6)where P is the power spectral, fkfrequency value of power spectral at frequency bin k, L and M are the length of time and frequency points, respectively.
Median frequency (MDF) is defined as the frequency at which the total power is divided into two equal parts [19], [21]. In this work, the average of MDF is used as feature, where MDF can be expressed as:
1 1
1
( , ) ( , ) ( , )
2
MDF M M
k MDF k
P n k P n k P n k
(7)where P is the power spectral, L and M are the length of time and frequency points, respectively.
Renyi entropy (RE) is another entropy that identifies the time-frequency structure and achieves the energy information of the EMG signal [19]. A lower RE is achieved when the EMG signal is estimated to be a very low complexity, especially for single component signals. RE can be represented as:
2 1 1 , 1 log1 , k
L M
n k L M
S n k RE S n
(8)where α is RE order, S is the spectrogram, L and M are the length of time and frequency points, respectively. It is worth noting that the α should be odd integer and it must be greater than 2 [19]. In this work, α with value of 3 is applied.
Commonly, statistical features including mean, variance (VAR) and coefficient of variation (CoV) are defined as one dimensional statistical properties. However, they can be extended into two dimensions so that they can extract the information from time-frequency plane. Two-dimensional mean, variance and CoV can be written as:
1 1 1 , L M n kMean S n k LM
(9)
21 1
1
, L M
n k
VAR S n k LM
CoV
(11)
where S is the spectrogram, µ is referred to the mean, σ represents standard deviation, L and M are the length of time and frequency points, respectively.
2.4
Classification of EMG Signal
To evaluate the capability of spectrogram features in differentiating 40 hand movement types, the machine learning algorithms are employed. In this study, two popular and widely used classifiers namely support vector machine (SVM) and linear discriminate analysis (LDA) are utilized.
Support vector machine (SVM) has been recognized to be one of the best and efficient machine learning algorithm in EMG pattern recognition [19]. Recently, SVM has grown up as a high potential classifier, which offers more accurate results compared to others [22], [18]. On the hyperplane, SVM makes use of the concept of separation to partition the data set so that all data can be divided linearly [23]. Additionally, SVM maps the data on the high dimensional space and provides the optimal classification function for classifying different classes in spectrogram feature set [24]. However, SVM has the limitation in the selection of kernel function and high computational cost [22]. In the previous research, radial basis function (RBF), linear, polynomial and Gaussian function are commonly used in SVM. Concerning the classification accuracy, RBF offers a better performance as compared to linear and polynomial [22], [24]. For this reason, SVM with RBF kernel is applied in this work.
Linear discriminate analysis (LDA) is a well-established machine learning algorithm that gives robust results. A study of Phinyomark et al. [25] indicated LDA was able to provide a high consistent results for a long-term EMG effect. Additionally, LDA is known as a less problems machine learning algorithm, especially when overtraining. The feature vector variables in LDA are assumed to be a multivariate normally distributed [26]. The concept of LDA is pretty simple, LDA evaluates the parameter of discriminate function based on training data set. Then, the boundary space in the hyperplane between different classes is assessed [6]. In this work, LDA with pseudo-linear function is implemented.
After selecting the proper classifiers, the data is divided into training and testing sets for performance evaluation. In this work, six-fold cross validation method is used. Cross validation is a popular statistical technique that has been widely used in classification and regression [10]. Cross validation aims to test the whole data set by partitioning the data equally into six parts. Each part is used for testing in succession while the rest are used for training session.
3.
Results and Discussion
In this section, the results of the performance of spectrogram features are discussed. In the experiment, ten features are extracted from each TFR. In total, 120 features (10 features × 12 channels) are extracted from each movement from each subject. The features are then normalized so that they have zero mean and unit variance.
In the first part of the analysis, the optimal Hanning window size of spectrogram is examined. Fig.2 demonstrates spectrogram with 128, 256 and 512 ms with 50 % overlap. As can be seen, the time information is reduced as the window size increased. On one side, the frequency information is reduced as the window size decreased. Certainly, spectrogram has the limitation in the tradeoff of time and frequency distribution and it has been mentioned in the literature. To balance the information content of time and frequency domains, the selection of window size is considered. Note that the total number of features for three different window sizes are the same.
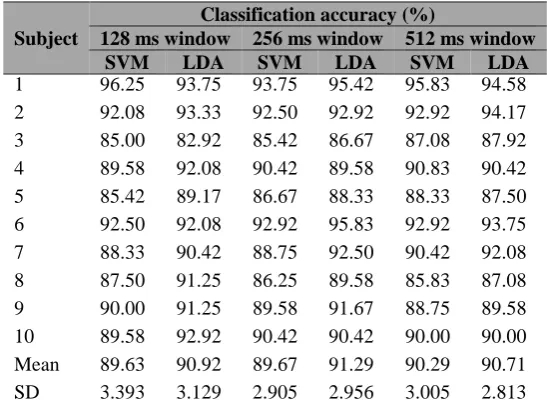
Table 2 outlines the classification accuracy of spectrogram features for window size of 128, 256 and 512 ms with 50% overlap. A higher mean classification accuracy of 91.29% (LDA) and 90.29% (SVM) are achieved for 256 and 512 ms window, respectively. The result of T-test shows that there is no significant difference (p>0.05) can be found between the classification performance of 128 ms (LDA) and 256 ms window (SVM). By applying LDA, 256 ms window shows an increment of 0.37% and 0.58% mean classification accuracy compared to 128 ms and 512 ms. In short, it has been found that 128 ms window achieves the best performance in LDA. On the other hand, 512 ms window offers the optimal performance when SVM is employed. Evidently, the accuracy of spectrogram features is varied according to the window size. This means that the optimal window size provides a better classification performance. Therefore, the analysis of the optimal window size in spectrogram is critically important.
Fig. 2 - Spectrogram of EMG signal with three different Hanning window sizes. (a) EMG signal (b) 128 ms (c) 256 ms (d) 512 ms.
Table 2 - Classification accuracy of three different window sizes (128, 256 and 512 ms).
Subject
Classification accuracy (%)
128 ms window 256 ms window 512 ms window SVM LDA SVM LDA SVM LDA
1 96.25 93.75 93.75 95.42 95.83 94.58
2 92.08 93.33 92.50 92.92 92.92 94.17
3 85.00 82.92 85.42 86.67 87.08 87.92
4 89.58 92.08 90.42 89.58 90.83 90.42
5 85.42 89.17 86.67 88.33 88.33 87.50
6 92.50 92.08 92.92 95.83 92.92 93.75
7 88.33 90.42 88.75 92.50 90.42 92.08
8 87.50 91.25 86.25 89.58 85.83 87.08
9 90.00 91.25 89.58 91.67 88.75 89.58
10 89.58 92.92 90.42 90.42 90.00 90.00
Mean 89.63 90.92 89.67 91.29 90.29 90.71
SD 3.393 3.129 2.905 2.956 3.005 2.813
4.
Conclusion
This study shows the potential of spectrogram in the classification of multiple hand movement types. In the first step, the analysis for the optimal selection of Hanning window size was done. It is observed the spectrogram with window size of 256 ms and 50% overlap offered the best recognition rate when LDA is used. The experimental results indicated that the combination of spectrogram features and LDA gives the best mean classification accuracy of 91.29%. Indeed, the hand movements of intact subject have been classified properly. In future, the performance of amputee needs to be done to develop an accurate multifunctional myoelectric prosthesis.
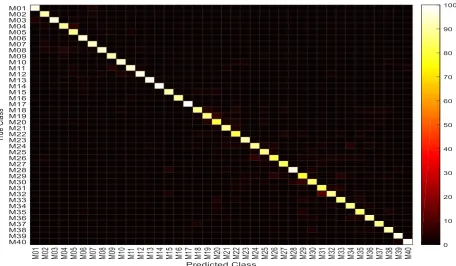
Fig. 3 - Confusion matrix of spectrogram (256 ms) + LDA of 40 hand movement types across 10 subjects (%).
Acknowledgement
The authors would like to thank the Universiti Teknikal Malaysia Melaka (UTeM), Skim Zamalah UTeM and Minister of Higher Education Malaysia (MOHE) for funding research under grant FRGS/1/2017/TK04/FKE-CeRIA/F00334.
References
[1] Al-Timemy, A.H., Khushaba, R.N., Bugmann, G. and Escudero, J. Improving the performance against force variation of EMG controlled multifunctional upper-limb prostheses for transradial amputees. IEEE Transactions on Neural Systems and Rehabilitation Engineering, Volume 24, (2016), pp.650-661.
[2] Pizzolato, S., Tagliapietra, L., Cognolato, M., Reggiani, M., Müller, H. and Atzori, M. Comparison of six electromyography acquisition setups on hand movement classification tasks. PloS one, Volume 12, No. 10, (2017), pp. e0186132.
[3] Atzori, M., Gijsberts, A., Castellini, C., Caputo, B., Hager, A.G.M., Elsig, S., Giatsidis, G., Bassetto, F. and Müller, H. Electromyography data for non-invasive naturally-controlled robotic hand prostheses. Scientific data, Volume 1, No. 140053, (2014).
[4] Joshi, D., Nakamura, B.H. and Hahn, M.E. High energy spectrogram with integrated prior knowledge for EMG-based locomotion classification. Medical Engineering and Physics, Volume 37, No. 5, (2015), pp. 518-524. [5] Sahu, G., Chaurasia, N., Suwalka, P.P., Bajaj, V. and Kumar, A. HHT based features for discrimination of EMG
signals. Information Systems Design and Intelligent Applications, (2015), pp. 95-103.
[6] Alkan, A. and Günay, M. Identification of EMG signals using discriminant analysis and SVM classifier. Expert Systems with Applications, Volume 39, No. 1, (2012), pp. 44-47.
[8] De Luca, C.J., Gilmore, L.D., Kuznetsov, M. and Roy, S.H. Filtering the surface EMG signal: Movement artifact and baseline noise contamination. Journal of biomechanics, Volume 43, No. 8, (2010), pp. 1573-1579.
[9] Shair, E.F., Ahmad, S.A., Marhaban, M.H., Mohd Tamrin, S.B. and Abdullah, A.R. EMG processing based measures of fatigue assessment during manual lifting. BioMed research international, Volume 2017, No. 3937254, (2017).
[10] Xing, K., Yang, P., Huang, J., Wang, Y. and Zhu, Q. A real-time EMG pattern recognition method for virtual myoelectric hand control. Neurocomputing, Volume 136, (2014), pp. 345-355.
[11] Englehart, K., Hudgins, B., Parker, P.A. and Stevenson, M. Classification of the myoelectric signal using time-frequency based representations. Medical Engineering and Physics, Volume 21, (1999), pp. 431-438.
[12] Phinyomark, A., Nuidod, A., Phukpattaranont, P. and Limsakul, C. Feature extraction and reduction of wavelet transform coefficients for EMG pattern classification. Elektronika ir Elektrotechnika, Volume 122, No. 6, (2012), pp. 27-32.
[13] Atzori, M., Cognolato, M. and Müller, H. Deep learning with convolutional neural networks applied to electromyography data: a resource for the classification of movements for prosthetic hands. Frontiers in neurorobotics, Volume 10, No. 9, (2016).
[14] Zhai, X., Jelfs, B., Chan, R.H. and Tin, C. Self-recalibrating surface EMG pattern recognition for neuroprosthesis control based on convolutional neural network. Frontiers in neuroscience, Volume 11, No. 379, (2017).
[15] Le Roux, J., Kameoka, H., Ono, N. and Sagayama, S. Fast signal reconstruction from magnitude STFT spectrogram based on spectrogram consistency. Proceeding of Digital Audio Effects, Volume 10, (2010).
[16] Zawawi, T.N.S.T., Abdullah, A.R., Shair, E.F. and Saleh, S.M. Performance Comparison of EMG Signal Analysis for Manual Lifting using Spectrogram. Journal of Telecommunication, Electronic and Computer Engineering, Volume 8, No. 7, (2016), pp. 29-34.
[17] Too, J., Abdullah, A.R, Saad, N.M., Ali, N.M and Zawawi, T.N.S.T. Application of Spectrogram and Discrete Wavelet Transform for EMG Pattern Recognition. Journal of Theoretical & Applied Information Technology, Volume 96, No. 10, (2018), pp. 3036-3047.
[18] Tsai, A.C., Luh, J.J. and Lin, T.T. A novel STFT-ranking feature of multi-channel EMG for motion pattern recognition. Expert Systems with Applications, Volume 42, No. 7, (2015), pp.3327-3341.
[19] Karthick, P.A., Ghosh, D.M. and Ramakrishnan, S. Surface electromyography based muscle fatigue detection using high-resolution time-frequency methods and machine learning algorithms. Computer methods and programs in biomedicine, Volume 154, (2018), pp. 45-56.
[20] Mazher, M., Aziz, A.A., Malik, A.S. and Amin, H.U. An EEG-based cognitive load assessment in multimedia learning using feature extraction and partial directed coherence. IEEE Access, Volume 5, (2017), pp. 14819-14829. [21] Gonzalez-Izal, M., Malanda, A., Navarro-Amezqueta, I., Gorostiaga, E.M., Mallor, F., Ibanez, J. and Izquierdo, M. EMG spectral indices and muscle power fatigue during dynamic contractions. Journal of Electromyography and Kinesiology, Volume 20, No. 2, (2010), pp. 233-240.
[22] Yousefi, J. and Hamilton-Wright, A. Characterizing EMG data using machine-learning tools. Computers in biology and medicine, Volume 51, (2014), pp. 1-13.
[23] Subasi, A. Classification of EMG signals using PSO optimized SVM for diagnosis of neuromuscular disorders.
Computers in biology and medicine, Volume 43, No. 5, (2013), pp. 576-586.
[24] Venugopal, G., Navaneethakrishna, M. and Ramakrishnan, S. Extraction and analysis of multiple time window features associated with muscle fatigue conditions using sEMG signals. Expert Systems with Applications, Volume 41, No. 6, (2014), pp. 2652-2659.
[25] Phinyomark, A., Quaine, F., Charbonnier, S., Serviere, C., Tarpin-Bernard, F. and Laurillau, Y. EMG feature evaluation for improving myoelectric pattern recognition robustness. Expert Systems with applications, Volume 40, No. 12, (2013), pp. 4832-4840.
[26] Kim, K.S., Choi, H.H., Moon, C.S. and Mun, C.W. Comparison of k-nearest neighbor, quadratic discriminant and linear discriminant analysis in classification of electromyogram signals based on the wrist-motion directions.