3)Faculty of Arts and Science, Kyushu University, 744 Motooka, Nishi-ku, Fukuoka 819-0395, Japan
(Received 30 January 2019/Accepted 3 April 2019)
We proposed a new method to evaluate particle flux in magnetized turbulent plasma. To extract fundamental fluctuation pattern, we used template method which is a kind of statistical conditional averaging technique. The method allows as not only to extract coherent patterns of density and potential fluctuations but also to evaluate time delay between them. We succeeded to calculate particle flux driven by fluctuation pattern and observed this pattern drives inward particle flux. Result obtained by the method is in good agreement with that obtained by a conventional method.
c
2019 The Japan Society of Plasma Science and Nuclear Fusion Research
Keywords: fluctuation, conditional average, particle flux DOI: 10.1585/pfr.14.1402090
1. Introduction
At present anomalous transport observed in fusion de-vices is believed to be driven by turbulence [1]. In inhomo-geneous magnetized plasma, fluctuations can be driven by several instability. However, there are few observations of turbulence driven transport.
Temporally and spatially simultaneous measurement of density and potential fluctuations allows us to estimate the particle flux. Potential fluctuation in low frequency (< ion cyclotron frequency) electrostatic turbulence can drive
B×∇φ˜drift (Bis background magnetic field and ˜φis poten-tial fluctuation) and the azimuthal electric field fluctuation and axial magnetic field drive radial motion of cylindrical plasma. Then the cross-phase between fluctuations of po-tential and density links to a time-averaged radial particle flux [2]. When the cross-phase is randomly changed over time, i.e. cross-coherence between fluctuations of potential and density is small, the time-averaged flux driven by such fluctuations is not significant. Although turbulence spec-trum is usually broad, quasi-coherent fluctuations are thus important to evaluate particle flux experimentally.
Generally, it is difficult to simultaneously measure density and potential fluctuations at the same time and the same position. Furthermore, we should extract fluctuations synchronizing with one another. We have evaluated the temporal and spatial structure of quasi-coherent mode by statistical conditional average method so far [3]. If we ap-ply conditional average to relatively coherent density and
author’s e-mail: [email protected]
potential fluctuations in turbulent plasma, we can estimate particle flux driven by a structure in which density and po-tential fluctuations are synchronized. The purpose of this study is to develop an estimation method for particle flux driven by a fluctuating structure by conditional averaging.
2. Experimental Setup
Our experiment was performed in PANTA [4]. Ex-perimental conditions are as follows; helicon wave input power of 6 kW, Argon gas pressure of 3 mTorr, and ax-ial magnetic field of 1300 G. The plasma radius is about 50 mm. The typical electron density ne and temperature
Teare 1.0×10¹⁹m−3 and 3 eV, respectively. The
turbu-lent fluctuations in PANTA are measured with electrostatic probe. Radial probe-array is installed at z = 1375 mm from helicon source of PANTA. The radial probe-array has 5 tips aligned at 1 cm radial intervals and is radially movable. In addition, azimuthal 64 channel probe-array is installed atz=1875 mm from the helicon source as shown in Fig. 1. It can measure ion saturation current atr=4 cm and 32 different azimuthal locations, simultaneously float-ing potential alternately in azimuthal direction. In PANTA, electron temperature fluctuation level is lower than density and potential fluctuations [5]. Thus, the ion saturation cur-rent fluctuation and the floating potential fluctuation can be considered as electron density fluctuation and space poten-tial fluctuation respectively.
Typical time evolution and power spectrum density of ion saturation current observed in PANTA are shown in
c
2019 The Japan Society of Plasma
Fig. 1 Schematic view of probe set-up. Radial structure of potential and density fluctuations is reconstructed by conditional averaging with one of azimuthal probe as reference probe.
Fig. 2 (a) Typical time evolution of ion saturation current and (b) power spectrum density of ion saturation current.
Fig. 2. A coherent fluctuation with azimuthal mode num-ber m = 4 and frequency f ≈ 9.2 kHz is excited most strongly. Many fluctuations coexist in the ion saturation current signal. We home in on particle flux driven by a quasi-coherent structure related to this fluctuations.
3. Template Method
To reconstruct 2-dimensional structure of fluctuations, we applied conditional averaging technique to signals ob-tained with the azimuthal array and radial probe-array. First, one of 64 ch probes was chosen as reference probe (Fig. 1). We tracked the timing of emergence of fluc-tuating pattern from the ion saturation current of the refer-ence probe, then synchronized fluctuating patterns which are at 5 different radial locations are extracted based on the timing from the reference. Here, we used “Template method” [3, 6]. The radial probe measure not only ion sat-uration current but also floating potential in a shot-by-shot manner. Finally, we obtained temporal evolution of radial structure of fluctuating density and potential patterns.
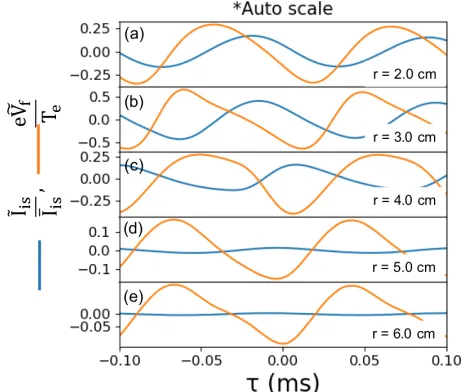
The results of conditional averaging are shown in Fig. 3. We can see phase relation between the density and
Fig. 3 (a-e) Conditional averaged wave forms of the coherent mode. Blue lines and orange lines are normalized ion saturation current and normalized potential, respectively.
Boltz-tively. Positive fluxΓr >0 means outward flux while
neg-ative fluxΓr < 0 means inward flux. In order to
calcu-late the particle flux, measurement of density and potential fluctuations at the same time and the same point is neces-sary. Our method can extract synchronized potential and density fluctuations at the same time and the same point.
In this study, we assumed that the fluctuation patterns rotates in the electron diamagnetic rotation as rigid-body andm =4 structure. Azimuthal probe array supports this assumption atr=4 cm. We can transform the time to the azimuthal location. Then, the differential operator can be replaced∂θto∂tas follow
Γr(t)=−
˜
n(t)
B
∂φ˜(t) ∂t /
∂θ ∂t
=2πkθ
f
n˜(t)∂tφ(˜ t)
B ,
(2) wheremeans conditional averaging.
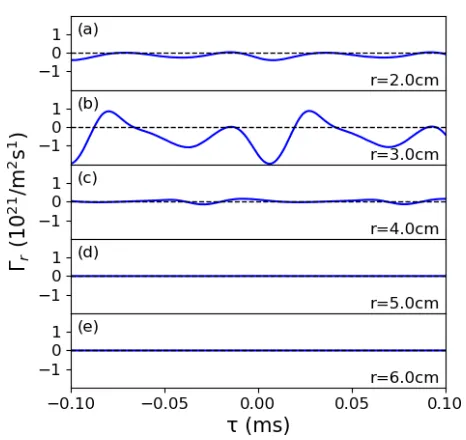
In this way, we estimated temporal evolution of parti-cle flux driven by the pattern and it is as shown in Figs. 4 (a-e). The particle flux was localized around r = 3.0 cm
and the direction of time-averaged particle flux is inward. Radial profile of the time averaged particle flux was also evaluated as shown in Fig. 5. Inward particle flux was observed in the regime ofr = 2.0 - 3.0 cm. Similar
re-sults of inward flux driven by parallel velocity shear driven mode in PANTA [4] and electron temperature driven mode in LVPD [7] are also observed.
Nonlinear wave coupling is observed by bicoherence analysis atr = 4.3 cm where waveform is strongly dis-torted and higher harmonics of the fundamental mode be-come large [3]. While particle flux driven by the higher harmonics is small at the position, particle flux driven by the fundamental mode becomes large through increase in the cross-phase. This suggests that nonlinear process mod-ulating the fundamental mode relates to increase in the cross-phase of the fundamental mode.
Level of potential fluctuation of the quasi-coherent structure is larger than level of the density fluctuation, and this structure drives inward particle transport. Thus, this structure is considered to not be drift wave. In future work, to identify this mode we will measure parallel and azimuthal flows and temperature fluctuation.
Fig. 4 (a-e) Estimated time evolution of particle flux driven by the coherent pattern. Negative flux means radial inward flux, and vice versa.
Fig. 5 (a) Radial profile of averaged particle flux of the coherent pattern.
5. Discussion
We assumed that density fluctuations which have weak auto-correlation have weak cross-correlation with potential fluctuations. If density fluctuations which have weak auto-correlation but significant cross-correlation with potential fluctuations are excited, finite instantaneous flux is driven by such fluctuations and the flux will not be canceled out after conditional averaging.
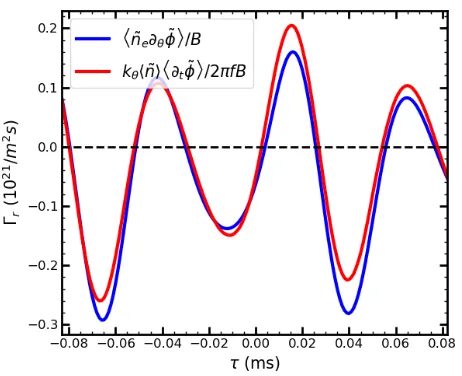
To check this, we have calculated an instantaneous flux (n˜∂θφ˜/B) by using 4-tips probe which is located at
be-Fig. 6 Time evolution of particle flux measured by 4-tips probe. Blue line is particle flux evaluated by conditional aver-aged potential and density. Red line is particle flux evalu-ated by conditional averaged instantaneous particle flux.
tween the tips is about 5.5 mm (< λθ ≈60 mm), then we can measure density and potential at the same time and the same point. Thus, it can evaluate flux directly. We applied conditional averaging based on the trigger func-tion obtained from density fluctuafunc-tion to the instantaneous flux, and compared it with that evaluated by our method (kθn ∂tφ/2πf B). Figure 6 demonstrates that the two
are almost the same.
To compare with conventional method, we also ap-plied cross spectrum analysis [8]. Radial particle flux in frequency domain is written as,
Γ r(f)ave = 2
Bkθ
f+Δf/2
f−Δf/2
γn˜,φ˜(f)|Pn˜(f)|1/2|Pφ˜(f)|1/2sin(αn˜,φ˜(f))d f,
(3) whereavemeans long time averaging, fandΔf are
fre-quency of fluctuations and frefre-quency resolution, respec-tively. γn˜,φ˜ andαn˜,φ˜ are cross-coherence and cross-phase
calculated by cross spectrum between density and poten-tial fluctuations.Pn˜ andPφ˜ are power spectrum of density
and potential fluctuations, respectively. Azimuthal wave number,kθ =m/ris 100 m−1 and frequency is 9.2 kHz in
this study. Our method is also applied to 4 tips probe sig-nals with one of the azimuthal probe array as a reference probe.
Results of three methods (our method, conditional av-eraging of the instantaneous flux and conventional spec-trum method) are compared in Fig. 7. We observed inward particle flux in three methods. Particle flux estimated by our method is greater than that estimated from single fre-quency component. On the other hands, particle flux esti-mated from all frequency components is greater than from our method. This result is consistent because our method
Fig. 7 (a) Comparison of radial profiles of averaged particle flux. Green line and blue line indicate particle flux esti-mated by spectral analysis. Green line consists of only the fundamental frequency component of the coherent mode. Blue line consists of all frequency components. Black dots are conditional averaged instantaneous flux and red diamonds indicate particle flux estimated by our method. Our method include the fundamental frequency components of the coherent mode and its synchronizing components (e.g. higher harmonics).
extracts not only the fundamental frequency component but also higher harmonics. Many quasi-coherent structures usually co-exist in plasma turbulence. In this case, we have to find all quasi-coherent structures to evaluate total flux. Our method can evaluate flux driven by quasi-coherent pat-tern of interest.
6. Summary
In summary, statistical averaging analysis was applied to the quasi-coherent mode observed in PANTA, to extract its spatiotemporal structure and particle flux. This analy-sis revealed the features of quasi-coherent mode such as (i) spatiotemporal structure of density and potential structure, (ii) fluctuation driven inward particle flux. Verification of our method was performed and its results indicated our method can estimate particle flux driven by synchronous density and potential fluctuations.
Acknowledgments
This work was partially supported by the Grant-in-Aid for Scientific Research of JSPS of Japan (JP18K03578, JP17H06089, JP17K06994, JP15H02155, JP15H02335), the collaborative Research Program of Research Institute for Applied Mechanics, Kyushu University and of NIFS (NIFS13KOCT001).