Optimization of amylase production from
Bacillus
sp. using statistics
based experimental design
V. P. Zambare∗
Center for Bioprocessing Research & Development, South Dakota School of Mines & Technology, 501 East Saint Joseph, Rapid City, SD 57701-3995, USA
Abstract: Production of amylase under submerged fermentation Bacillus sp. was investigated using wheat
bran, soybean meal and CaCO3 (WSC) medium. Response surface methodology (RSM) was used to
evaluate the effect of the main variables, i.e., pH (11.35), temperature (35.16°C) and inoculum size (2.95%) on amylase production by applying a full factorial central composite design (CCD). The mutual interaction between these variables resulted into 4.64 fold increase in amylase activity as compared to the non-optimized environmental factors in the basal medium.
Key words: Amylase, Bacillus sp., central composite design, response surface methodology
ﺔﻴﺋﺎﺼﺣا
ﺲﺳا
ﻲﻠﻋ
برﺎﺠﺗ
تﺎﻤﻴﻤﺼﺗ
ماﺪﺨﺘﺳﺎﺑ
سﻮﻠﻴﺳﺎﺒﻟا
عﻮﻧ
ﻦﻣ
ﺰﻴﻠﻴﻣﻷا
جﺎﺘﻧا
ﻢﻴﻈﻌﺗ
ﺮﻴﺒﻣازﺰﺑ .ف
ﺎﺗﻮآادبﻮﻨﺟﻲﻓﺎﻴﺟﻮﻟﻮﻨﻜﺘﻟاو ﻦﻳﺪﻌﺘﻟاﺪﻬﻌﻣ،ﺔﻴﻤﻨﺘﻟاويﻮﻴﺤﻟاﻊﻴﻨﺼﺘﻟاثﺎﺤﺑاﺰآﺮﻣ
501 ﺔﻴﻜﻳﺮﻣﻻاةﺪﺤﺘﻤﻟاتﺎﻳﻻﻮﻟا،ﺎﺗﻮآادبﻮﻨﺟ،ﺪﺑارﺔﻨﻳﺪﻣ،ﻒﻳزﻮﺟﺖﻧﺎﺳبﻮﻨﺟ
ﺺﺨﻠﻤﻟا ﻢﺗ :
و ﺎﻳﻮﺼﻟا لﻮﻓ ﺺﻠﺨﺴﻣ،ﺢﻤﻘﻟا ﺔﻟﺎﺨﻧ ﺔﺌﻴﺑماﺪﺨﺳﺎﺑ سﻮﻠﻴﺳﺎﺒﻟا عﻮﻧﻦﻣ ﺮﻤﻐﻟﺎﺑﺮﻴﻤﺨﺘﻟا ﺔﻄﺳاﻮﺑ ﺰﻴﻠﻴﻣﻷاجﺎﺘﻧا ﺔﺳارد
مﻮﻴﺴﻟﺎﻜﻟا تﺎﻧﻮﺑﺮآ
(WSC)
ﺔﻴﺤﻄﺴﻟاﺔﺑﺎﺠﺘﺳﻷا ﺔﻴﻨﻘﺗ ﺖﻣﺪﺨﺘﺳا . (RSM)
) ﺔﺿﻮﻤﺤﻟاﺔﺟردﻞﺜﻣ ،ﺔﻴﺴﻴﺋﺮﻟا ﻞﻣاﻮﻌﻟاﺮﻴﺛﺄﺗ ﻢﻴﻴﻘﺘﻟ
pH
(11.35)
ةراﺮﺤﻟا ،( (35.16oC)
ﻻا ﻢﺠﺣو ئدﺎﺒﻟ
(2.95%) ﻞﻣﺎﻜﺘﻤﻟا يﺰآﺮﻤﻟا ﺐآﺮﻤﻟا ﺔﻴﻨﻘﺗ ﻖﻴﺒﻄﺗ ﺔﻄﺳاﻮﺑ ﺰﻴﻠﻴﻣﻷا جﺎﺘﻧا ﻲﻠﻋ
(CCD)
ﺎهرﺪﻗةدﺎﻳزﻰﻟإتاﺮﻴﻐﺘﻤﻟاﻩﺬهﻦﻴﺑﻞﻋﺎﻔﺘﻟايدأ . 4.64
.تاﺮﻴﻐﺘﻤﻟاﻞﻳﺪﻌﺗمﺪﻋمﺪﻋﺔﻟﺎﺤﺑﺔﻧرﺎﻘﻤﻟﺎﺑﺰﻴﻠﻴﻣﻷاطﺎﺸﻧﻲﻓﻞﺜﻣتاﺮﻣ
∗
Introduction
Amylases are the hydrolytic enzymes that cleave the α- 1-4 glucosidal linkage of complex polysaccharides (Pandey et al., 2000). Amylases are obtained from various origins like plant, animal, bacterial and fungal. Several researchers produced amylase enzyme using
Bacillus sp. (Yuguo et al., 2000; Young et al.,
2001; Dharani, 2004; Zambare, 2010a). Rumen bacteria also reported for amylase and protease production in sheep (Moharrery, 2003) Amylase has many applications in food, textile, paper and pulp, pharmaceuticals, baking and beverages, detergent and leather industries (Pandey et al., 2000; Reddy et al., 2003a; Kar et al., 2010). Industrially important enzymes including amylases have traditionally been obtained from submerged cultures because of easy handling, greater control of environmental and nutritional factors. The most frequently used operation in biotechnology is to improve the fermentation conditions for maximizing cell density, high level of desired metabolic product or enzyme levels in microbial system (Mukhopadhyay et al., 2008). This approach is time consuming and also ignores the combined interactions between physical as well as nutritional factors.
In contrast, RSM includes factorial design and regression analysis which helps in evaluating the effective factors and their interaction and to find out the optimum conditions of variables for a desirable response (Tunga et al., 1999; Coninck et al., 2000; Reddy et al., 2003b; Kunamneni et al., 2005; Gangadharan et al., 2008). Recently, a number of statistical experimental designs with response surface methodology have been employed for optimizing enzyme production from microorganisms (Koteswara et al., 2006; Thys et al., 2006; Zambare, 2010b; Mohandas et al., 2010). However, 3D and counter plots for response surfaces can provide a good way for visualizing the parameter interaction. Therefore, statistical technique is often used for predicting optimum process conditions for microbial enzyme production (Mullai et al., 2010). It is well known that extracellular enzyme production in microorganisms is greatly influenced by nutritional factors like
carbon sources, nitrogen sources and mineral salts (Dey et al., 2001; Adinarayana and Elliaiah, 2002; Chauhan and Gupta, 2004). Enhancement in extracellular amylase production from Bacillus sp. by environmental
factor optimization has not been attempted so far. Therefore, considering the many industrial applications of amylase, we report here the optimization of extracellular amylase production from Bacillus sp. as a result of the
interactive effects of three variables (i.e. pH, temperature and inoculum size) using response surface methodology.
Materials and Methods Microorganism
Bacillus sp. isolated from soil showed true
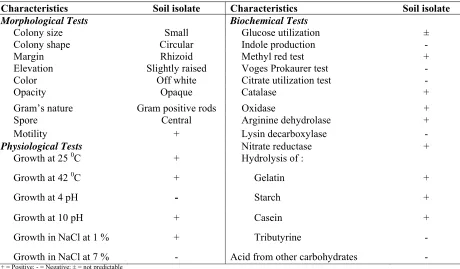
potential in extracellular amylase secretion. Amylase secretion was tested on starch agar plates. After 24h of incubation the plate was flooded with iodine solution. The amylase activity was measured in terms of clear zone diameter with dark blue background. It was maintained on 2 % Nutrient agar slants at 4°C and also as a glycerol stocks at -20°C. The isolate was identified on the basis of various morphological characteristics (colony size, shape, margin elevation, color, opacity, Gram’s nature, spore staining and motility), physiological test (growth at 25 and 42°C, growth at pH 4 and 10, growth in NaCl at 1 and 7% concentration) and biochemical tests (glucose utilization, indole production, methyl red, Voges Prokaurer, citrate utilization, catalase, oxidase, arginine dehydrolase, lysine decarboxylase, hydrolysis of gelatin, starch, casein, tributyrine and acid from other carbohydrates etc. Above all tests were performed according to Bergey’s manual of systematic bacteriology (Sneath et al., 1986). Chemicals and media
Chemicals and media were all of analytical grade and purchased from Sigma (St Louis, USA).
Production medium
Inoculum preparation
Seed inoculum was prepared by growing the isolate on Nutrient agar (Sigma) in Roux bottle at 30°C for 24 h. The cells were suspended in saline and cell density was measured with spectrophotometer (Shimatzu UV-2501 PC, Japan) at 600 nm.
Experimental design and optimization by RSM
In the RSM the interactive effects of three variables, i.e. pH, temperature and inoculum size was studied for amylase production. Each factor in the CCD was studied at three different levels (-1, 0, +1). The minimum and maximum ranges of variables were investigated with respect to their values in actual and coded form
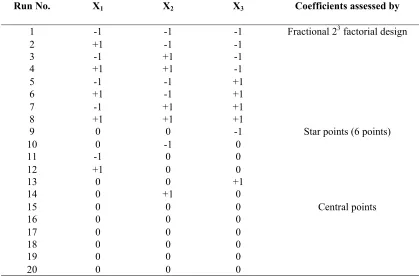
(Table 1). To optimize the conditions for amylase production, Design-Expert 8.0 CCD-RSM software (Minneapolis, U.S.A.) was used. A 23 factorial CCD proposed by Box et al. (1978) with three factors leading to a total of 20 sets per experiment was formulated to optimize the process parameters. This experiment included 8 factorial design, 6 star and 6 central points. All the variables i.e. pH, temperature and inoculum size were taken at a central coded value and considered as zero. The conditions of these environmental factors for the production medium were varied according to the experimental design (Table 2). All the experiments were carried out in duplicates.
Table 1. Experimental range and levels of the three independent variables used in RSM in terms of actual and coded factors.
Variable Range of levels
Actual Coded Actual Coded Actual Coded
X1- pH 10 -1 11 0 12 +1
X2 – Temperature (0C) 30 -1 35 0 40 +1
X3 – % Inoculum 1 -1 3 0 5 +1
Table 2. Central composite design in coded units.
Run No. X1 X2 X3 Coefficients assessed by
1 -1 -1 -1 Fractional 23 factorial design
2 +1 -1 -1 3 -1 +1 -1 4 +1 +1 -1 5 -1 -1 +1 6 +1 -1 +1 7 -1 +1 +1 8 +1 +1 +1
9 0 0 -1 Star points (6 points)
10 0 -1 0 11 -1 0 0 12 +1 0 0 13 0 0 +1 14 0 +1 0
15 0 0 0 Central points
The experiments were conducted in 250 ml Erlenmeyer flasks containing 100 ml of sterilized WSC medium of different pH 10-12, inoculated with the freshly prepared 1-5% (2 x 10⁸ cells/ml) inoculum (as discussed earlier) and incubated for 12 hrs at 30-40°C under shaking culture condition (150 rpm). After fermentation, the cell-free supernatant was obtained by centrifugation at 10,000 rpm and used for amylase activity.
Using RSM, the relationship among the variables, i.e. pH, temperature and inoculum size were expressed mathematically in the form of a polynomial model, which gave the response as a function of relevant variables. The present work was based on the CCD to obtain the experimental data, which would fit in an empirical, full second-order polynomial model representing the response surfaces over a relatively broad range of parameters as shown in Eq. (1).
………….. (1)
where, y was the predicted response
(amylase production) used as a dependent variable; xi (i = 1, 2 and 3) were the input
predictors or controlling variables; and a0, ai (i = 1, 2, 3) and aij (i = 1, 2, 3; j = i, . . . , 3) were
the model coefficient parameters. The coefficient parameters were estimated by
multiple linear regression analysis using the least-squares method. A second-order polynomial equation was then fitted to the data by least-squares optimization technique. This resulted in an empirical model that related the response measured to the independent variables of the experiment.
Assay of amylase
The amylase activity in the cell free supernatant (CFS) was measured by incubating 0.5 ml of CFS with 0.5 ml of 2% (w/v) starch at 37°C in 2 ml phosphate buffer (0.1 M, pH 6.0). The reducing sugars released were measured by 3,5-dinitrosalicylic acid method (Miller, 1959). A separate blank was set for each sample to correct the non-enzymatic release of sugars. One unit of amylase was defined as the amount of enzyme that released 1 µg of reducing sugar as maltose per minute under the standard assay conditions.
Results and Discussion
In present work, the isolate used is a soil isolate and showed potential amylase production on starch agar plate with zone of hydrolysis (50 mm diameter). The clear zone of hydrolysis around the bacterial colony was due to the hydrolysis of starch by amylolytic enzyme (Figure 1).
Morphological, physiological and biochemical tests were carried out for this isolate as described in Table 3, according to Bergey’s manual of systematic bacteriology (Sneath et al., 1986). It was a Gram-positive, motile, rod shaped alkaliphilic bacterium. From Table 3, it was identified as Bacillus sp. Due to
strange results in some of biochemical tests it was difficult to identify up to species level. Likewise, on the basis of various morphological, physiological and biochemical basis the protease producing bacterium Tap 5 was identified as Bacillus firmus (Joshi, 2010).
Table 3. Morphological and biochemical characteristics of the soil isolate.
Characteristics Soil isolate Characteristics Soil isolate
Morphological Tests Biochemical Tests
Colony size Small Glucose utilization ±
Colony shape Circular Indole production -
Margin Rhizoid Methyl red test +
Elevation Slightly raised Voges Prokaurer test -
Color Off white Citrate utilization test -
Opacity Opaque Catalase +
Gram’s nature Gram positive rods Oxidase +
Spore Central Arginine dehydrolase +
Motility + Lysin decarboxylase -
Physiological Tests Nitrate reductase +
Growth at 25 0C + Hydrolysis of :
Growth at 42 0C + Gelatin +
Growth at 4 pH - Starch +
Growth at 10 pH + Casein +
Growth in NaCl at 1 % + Tributyrine -
Growth in NaCl at 7 % - Acid from other carbohydrates - + = Positive; - = Negative; ± = not predictable
RSM had not only been used for optimization of medium components in the fermentation process (Puri et al., 2002) but also for studying the combined effects of culture parameters (Dutta et al., 2004; Nawani and Kapadnis, 2005). A submerged culture was used for the production of extracellular amylase from Bacillus sp. Preliminary
experiments on amylase production from the above strain indicated that the most important environmental factors were pH, temperature and inoculum size. Hence these three factors were considered as the independent variables and their effect on amylase production was studied using a CCD of RSM. The results of CCD experiments for studying the effects of three independent variables, viz., pH, temperature and inoculum size, on amylase
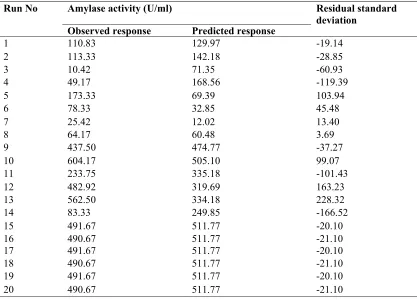
Table 4. Observed responses and predicted values.
Table 5. Model coefficients estimated by multiple linear regressions.
Factor Coefficient F-value p- value
Intercept 511.77 5.02 0.009*
X1 - pH 15.77 0.14 0.719
X2 – Temperature -7.75 0.037 0.851
X3 – Inoculum size -42.17 1.09 0.320
X12 21.25 0.22 0.647
X23 -12.19 0.073 0.792
X13 0.31 4.800E-005 0.994
X11 -21.83 0.081 0.782
X22 -184.33 5.74 0.037*
X33 -219.75 8.16 0.017*
*Significant variables
Amylase activity (y) = 511.77 + 35.77X1 – 7.75X2 – 42.17X3 + 21.25X12 – 12.19X23 + 0.31X13 – 21.83X11 –184.33X22 – 219.75X33………... (2)
where, X1-pH, X2-temperature in 0C and X3-inoculum size in %. The larger the magnitudes of F- value, the smaller the p- value, the more significant value is the
corresponding coefficient (Akhnazarova and Kafarov, 1982; Rubinder et al., 2002). The results of the second order response surface model fitting in the form of analysis of variance (ANOVA) are in Table. 6. The fisher F-test with a very low probability value demonstrated a very high significance for the regression model (Olivera et al., 2004;
Run No Amylase activity (U/ml) Residual standard deviation
Observed response Predicted response
1 110.83 129.97 -19.14
2 113.33 142.18 -28.85
3 10.42 71.35 -60.93
4 49.17 168.56 -119.39
5 173.33 69.39 103.94
6 78.33 32.85 45.48
7 25.42 12.02 13.40
8 64.17 60.48 3.69
9 437.50 474.77 -37.27
10 604.17 505.10 99.07
11 233.75 335.18 -101.43
12 482.92 319.69 163.23
13 562.50 334.18 228.32
14 83.33 249.85 -166.52
15 491.67 511.77 -20.10
16 490.67 511.77 -21.10
17 491.67 511.77 -20.10
18 490.67 511.77 -21.10
19 491.67 511.77 -20.10
Zambare, 2010b). The fitting of the model was checked by the determination coefficient (R2). In this case, the value of the determination coefficient (R2= 0.818) indicates that only 18.2% of the total variations are not explained by the model. The value of the adjusted determination coefficient (Adj. R2= 0.655) is also high, which indicates a higher significance (p value < 0.01) of the model (Adinarayana and
Elliaiah, 2002; Olivera et al., 2004). Adequate precision measures the signal to noise ratio. An adequate precision value (5.74) was greater than 4 which indicates adequate signal. At the same time a relatively lower value of the coefficient of variation (CV=42.70) indicates improved precision and reliability of the conducted experiments (Adinarayana and Elliaiah, 2002).
Table 6. Analysis of variance (ANOVA) for the three factorial design.
* Significant at < 0.01.R2= 0.818, Adjusted R2= 0.655, Adeq. Precision= 5.54, % C.V. = 42.70
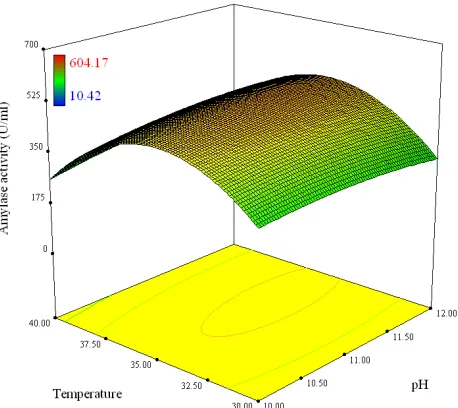
The 3-D counter plots for response surfaces corresponding to the combined effects of pH-temperature (Figure 2), pH-inoculum (Figure 3) and temperature-inoculum (Figure 4) were plotted. The response surfaces obtained were
suggesting that Bacillus sp. secreted amylase in
more alkaline condition at moderate temperature and inoculum size. Thus the optimum operating conditions obtained from the RSM model were pH (11.35), temperature (35.16°C) and inoculum (2.95%) with
predicted amylase activity of 515.30 U/ml. After optimization, 4.64 fold amylase activity (515.30 U/ml) was enhanced when compared with non-optimized environmental factors (pH 10, temperature 30°C, inoculum size 1 %) in basal medium (110.83 U/ml). Thus, RSM could be a very powerful and flexible tool for modeling the fermentation process due to corrective action arising from methodology and the associated estimation procedure.
Figure 2. Three-D counter plot showing the mutual effect of pH and temperature on amylase activity with 3 % inoculums.
Source of variation Sum of squares Degree of freedom
Mean square F-value P- value
Regression 7.352E+005 9 81688.75 5.02 0.009
Residual 1.628E+005 10 16277.28
Figure 3. Three -D counter plot showing the mutual effect of pHand inoculum on amylase activity at35°C.
Figure 4. Three-D counter plot showing the mutual effect of temperature and inoculum on amylase activity at pH 11.
Among the physico-chemical parameters, the pH of the growth plays important role on the production of alpha amylase (Panday et al., 2000). In this study, for amylase production optimum at pH 11.35 was found; above and
in literature (Agrawal et al., 2005; Kar and ray, 2008; Tamilarasan et al., 2010). The application of properly designed models with multi-factor analysis allow process and biochemical engineers to design scale up strategies for increasing enzyme production. Also, amylases have numbers of commercial applications in baking, brewing and alcohol industries because of their inherent unique properties (Kar and Ray, 2008). Hence the amylase produced from Bacillus sp. will be
useful in the starch bioprocessing sectors, particularly for starch liquefaction for bioethanol production. Further study is in progress in our laboratory on the application of
Bacillus amylase in saccharification of cassava
starch and related substrates for production of ethanol and in wine making.
Conclusion
The result obtained in the present study indicated that Bacillus sp. could be a potential
strain for amylase production in submerged fermentation using wheat bran like easily available carbon substrates. The RSM allowed the optimization of process parameters such as pH (11.35), temperature (35.16°C) and inoculum size (2.95%) for attaining higher yield of amylase.
References
Adinarayana, K. and P. Ellaiah. 2002. Response surface optimization of the critical medium components for the production of alkaline protease by a newly isolated Bacillus sp. J. Pharm. Pharmaceut.
Sci. 5:272-278.
Agrawal, M., S. Pradeep, K. Chandraraj and S. N. Gummadi. 2005. Hydrolysis of starch by amylase from Bacillus sp. KCA102: a
statistical approach. Process Biochem. 40:2499-2507.
Akhnazarova, S. and V. Kafarov. 1982. Experiment optimization in chemistry and chemical engineering, Mir Publications, Moscow.
Box, G. E. P., W. J. Hunter and J. S. Hunter. 1978. Statistics for experiments. John Wiley and Sons, New York, pp. 291-334. Chauhan, B. and R. Gupta. 2004. Application
of statistical experimental design for optimization of alkaline protease production from Bacillus sp. RGR-14.
Process Biochem. 39:2115–2122.
Coninck, J. D., S. Bouquelet, V. Dumortier, F. Duyme and V. I. Denantes. 2000. Industrial media and fermentation process for improved growth and protease production by Tetrahymena thermophila BIII. J. Ind.
Microbiol. Biotechnol. 24:285–290.
Dey, G., A. Mitra, R. Banerjee and B. R. Maiti 2001. Enhanced production of amylase by optimization of nutritional constituents using response surface methodology. Biochem. Eng. J. 7:227-231.
Dharani, A. P. V. 2004. Effect of C: N ratio on alpha amylase production by Bacillus licheniformis SPT 27. Afr. J. Biotechnol.
3:519-522.
Dutta, J. R., P. K. Dutta and R. Banerjee. 2004. Optimization of culture parameters for extracellular protease production from a newly isolated Pseudomonas sp. using
response surface and artificial neural network models. Process Biochem. 39:2193- 2198.
Gangadharan, D., S. Sivaramakrishnan, K. M. Nampoothiri, R. K. Sukumaran and A. Pandey. 2008. Response surface methodology for the optimization of alpha amylase production by Bacillus amyloliquefaciens. Bioresour. Technol.
99:4597-4602.
Joshi, B. H. 2010. Purification and characterization of a novel protease from
Bacillus firmus Tap5 isolated from tannery
waste. J. Appl. Sci. Res. 6:1068-1076.
Kar, S. and R. Ray. 2008. Statistical optimization of alpha amylase production by Streptomyces erumpens MTCC 7317
response surface methodology. Polish J. Microbiol. 57:49-57.
Kar, S., D. Tapan Kumar and R. R. Chandra. 2010. Optimization of thermostable α- amylase production by Streptomyces
erumpens MTCC 7317 in solid-state
fermentation using cassava fibrous residue. Brazilian Arch.Biol. Technol. 53:301-309. Koteswara, Rao, Y., S. C. Lu, B. L. Liu and Y.
M. Tzeng. 2006. Enhanced production of
an extracellular protease from Beauveria bassiana by optimization of cultivation
processes. Biochem. Eng. J. 28:57-66. Kunamneni, A., K. Santhosh Kumar and S.
Singh. 2005. Response surface methodological approach to optimize the nutritional parameters for enhanced production of amylase in solid state fermentation by Thermomyces lanuginosus.
Afr. J. Biotechnol. 4:708-716.
Miller, G. L. 1959. Use of dinitrosalicylic acid reagent for determination of reducing sugars. Anal. Chem. 31:426-428.
Mohandas, B. S., A. Prabhakar, R. R. Koteswara Rao, G. M. Madhu and G. H. Rao. 2010. Statistical optimization and neural modeling of amylase production from banana peel using Bacillus subtilis
MTCC 441. Int. J. Food Eng.6:1-6.
Moharrery, A. 2003. Incorporation of isoacids, oils, NPN and protein in the ration of sheep and their effect on protease and amylase in the rumen fluid. Emir. J. Agric. Sci. 15(1):76-83.
Mukhopadhyay, A., A. M. Redding, B. J. Rutherford and J. D. Keasling. 2008. Importance of systems biology in engineering microbes for biofuel production. Curr. Opin. Biotechnol. 19:228–234.
Mullai P., N. S. A. Fathima, E. R. Rene. 2010. Statistical analysis of main and Interaction effects to optimize xylanase production under submerged cultivation conditions. J. Agric. Sci. 2(1):144-153.
Nawani, N. N. and B. P. Kapadnis. 2005. Optimization of chitinase production using statistics based experimental designs. Process Biochem. 40:651-660.
Olivera, F. C., G. R. Caron and A. Brandelli. 2004. Bacteriocin production by Bacillus licheniformis strain P40 in cheese whey
using response surface methodology. Biochem. Eng. J. 21:53–58.
Pandey, A., P. Nigama, R. S. Carlos, T. S. Vanete, S. Dalel and M. Radjiskumar. 2000. Advances in microbial amylases. Biotechnolol. Appl. Biochem. 31:135–152. Puri, S., O. K. Beg and R. Gupta. 2002.
Optimization of alkaline protease production from Bacillus sp. by response
surface methodology. Curr. Microbiol. 44:286- 290.
Reddy, N. S., S. A. Nimmagadda and K. R. S. Rao. 2003a. An overview of the microbial α-amylase family. Afr. J. Biotechnol. 2:645-648.
Reddy, P. R. M., B. Ramesh, S. Mrudula, G. Reddy and G. Seenayya. 2003b. Production of thermostable β-amylase by Clostridium thermosulfurogenes SV2 in solid-state
fermentation: optimization of nutrient levels using response surface methodology Process Biochem. 39:267-277.
Rubinder, K., B. S. Chadha, N. Singh, H. S. Saini and S. Singh. 2002. Amylase hyperproduction by deregulated mutants of the thermophilic fungus Thermomyces lanuginosus. J. Ind. Microbiol. Biotechnol.
29:70 –74.
Sneath, P. H. A., N. S. Mair, M. E. Sharpe and J. G. Holt. 1986. Bergey's manual of systematic bacteriology. Vol. 2. Baltimore, Md: The Williams & Wilkins Co., 1105– 1139.
Thys, R. C. S., S. O. Guzzon, F. C. Olivera and A. Brandelli. 2006. Optimization of protease production by Microbacterium sp.
in feather meal using response surface methodology. Process Biochem. 41:67–73. Tunga, R., R. Banerjee and V. C.
Bhattacharyya. 1999. Optimization of n-variable biological experiments by evolutionary operation-factorial design technique. J. Biosci. Bioeng. 87:224- 230. Young, M. H., G. L. Dong, Y. Jung-Hoon, P.
Yong-Ha and J. K. Young. 2001. Rapid and simple purification of a novel extracellular
β-amylase from Bacillus sp. Biotechnol.
Lett. 23:1435–1438.
Yuguo, Z., W. Zhao and C. Xiaolong. 2000. α -amylase production by Bacillus subtilis
with dregs in an external-loop airlift bioreactor. Biochem. Eng. J. 5:115–121. Zambare, V. 2010a.Solid state fermentation of
Aspergillus oryzae for glucoamylase
production on agro-residues. Int. J. Life Sci.4: 16-25.
Zambare, V. 2010b.Optimization of nutritional factors for extracellular protease production from Bacillus sp. using response surface