Lincoln University Digital Thesis
Copyright Statement
The
digital
copy
of
this
thesis
is
protected
by
the
Copyright
Act
1994
(New
Zealand).
This
thesis
may
be
consulted
by
you,
provided
you
comply
with
the
provisions
of
the
Act
and
the
following
conditions
of
use:
you
will
use
the
copy
only
for
the
purposes
of
research
or
private
study
you
will
recognise
the
author's
right
to
be
identified
as
the
author
of
the
thesis
and
due
acknowledgement
will
be
made
to
the
author
where
appropriate
Alien
Brassica
: Variation in Performance Among and Within Species
and Locations
A thesis
submitted in partial fulfilment
of the requirements for the Degree of
Doctor of Philosophy
at
Lincoln University
by
Ross Meffin
Abstract of a thesis submitted in partial fulfilment of the
requirements for the Degree of Doctor of Philosophy.
Abstract
Alien
Brassica
: Variation in Performance Among and Within Species
and Locations
by
Ross Meffin
Our ability to consistently predict which taxa will become invasive and where, and understanding of the drivers of this variation is limited. A better understanding of how variation in traits within species and biotic and abiotic conditions within regions influence patterns of invasion is needed to improve our understanding of the processes underlying invasions and our ability to manage alien species.
The taxonomic unit used to assess alien invasiveness is usually the species. There is considerable intraspecific variation in plant traits, but the extent to which these differences can affect invasiveness is unknown. I tested the hypothesis that most of the variation in plant performance among taxa would reside at the species level (relative to subspecies and varieties).
I quantified variation in performance among taxa of alien Brassica with data from a seed sowing experiment comprising 24 taxonomically stratified varieties (six subspecies, three species) used to parameterise hierarchical models.
I quantified the effects of relaxing seed and site limitation on the performance of a taxonomically stratified selection of 12 varieties of alien Brassica, and looked for shifts in the taxonomic level at which most variation in performance resided. Seeds were sown at two densities (400 seeds/m-2 and 4000 seeds/m-2), and with and without pre-sowing soil disturbance.
Both a higher sowing density and pre-sowing disturbance increased Brassica emergence, but only disturbance increased survivorship, and neither resulted in significantly higher population growth rates. Most variation in performance among taxonomic levels resided at the varietal level regardless of seed density or disturbance. While high seed density and disturbance can increase seedling recruitment, unless aliens can pass subsequent ecological filters persistence is unlikely.
Alien plant populations often become extinct due to demographic and environmental stochasticity, unsuitable traits, and Allee affects. Such aliens may appear to be naturalised if new populations are founded by dispersed or immigrant propagules. Differentiating between transient and persistent populations is crucial to our understanding and management of invasions.
I recorded feral alien Brassica populations in three annual surveys, along with measures of seed sources, site and management characteristics that may influence the probability of presence and survival. I identified correlates of population presence and survival, and quantified the probability of population survival from year to year.
Brassica would likely not persist in the landscape beyond ten years without anthropogenic seed input. Only around 40% of populations survived two or more years after foundation, but new populations focused around transportation routes and seed companies compensated for extinctions. Stochasticity and trait-site mismatch were causes of population extinction. Adventive aliens may be controlled by managing propagule sources; accounting for population extinctions is important to accurately assess distributions from cumulative presence data.
Further research is required to identify which traits drive variation in plant performance and invasiveness within species. In addition we need to be able to identify taxa which are most likely to contain substantial intraspecific variation in these traits. Applying the precautionary principle would suggest that the same restrictions should apply to the importation of new plant varieties, subspecies and genotypes as are applied to the importation of new plant species.
Acknowledgements
I would like to thank Prof. Phil Hulme and Prof. Richard Duncan for their commitment, enthusiasm and clarity of thought. I feel fortunate to have had such an outstanding supervisory team and to have been the recipient of some of their enormous reservoir of skills, knowledge and insight.
Thank you also to my field team, Yukari Meffin, Diana Clark and Robyn Butters, for all those hard days searching for and counting Brassica on the side of the road. Thanks for making it a fun and enjoyable experience as well as doing such an excellent job.
A huge thank you to my wife, Yukari Meffin for her patience and support over the last three and a half years. Also to my brother, Hamish Meffin, for invaluable advice on navigating a PhD. A big thanks to my mother, Elaine Meffin, for support and proofreading, and to my father, Peter Meffin for sparking and nurturing my interest in science.
Thanks to Myles MacKintosh for logistic support and some great trips to the hills which helped keep me sane.
A big thank you to Dr. Jon Sullivan for insightful feedback and encouragement.
Table of Contents
Abstract... ii
Acknowledgements ... v
Table of Contents... vi
List of Tables... ix
List of Figures ... xii
Chapter 1 Introduction... 1
1.1 Overview... 1
1.1.1 Background ... 1
1.1.2 Objectives... 1
1.1.3 Structure ... 2
1.2 Choice of Brassica as Model System ... 3
1.3 Species-based approach in Invasion Ecology ... 4
1.4 Intraspecific Variation in Plant Traits and Invasiveness ... 5
1.5 Brassica Biology, Ecology and Naturalisation ... 9
1.6 Summary...11
Chapter 2 Landscape-Level Persistence and Distribution of Casual Alien Feral Crops Linked to Seed Transport ...13
2.1 Abstract ...13
2.2 Introduction ...13
2.3 Methods ...16
2.3.1 Study Area ...16
2.3.2 Field Surveys...17
2.3.3 Analysis ...19
2.4 Results ...22
2.4.1 Frequency, Dynamics, Size and Taxonomic Composition of Brassica Populations ...22
2.4.2 Influence of Seed Sources on the Probability of Brassica Population Presence ...24
2.4.3 Influence of Management and Local Site Characteristics on the Probability of Brassica Population Presence ...26
2.4.4 Survival of Brassica Populations ...27
2.4.5 Species Differences ...30
2.5 Discussion ...31
2.5.1 Survival of Populations ...32
2.5.2 Seed Sources ...34
2.5.3 Presence of Populations ...35
2.5.4 Species Differences ...37
3.3.3 Experimental Design...47
3.3.4 Data Collection ...48
3.3.5 Analysis ...49
3.4 Results ...56
3.4.1 Variation in Brassica Performance Among Taxa (T models) ...56
3.4.2 Variation in Brassica Performance Among and Within Plots (T models) ...60
3.4.3 Effects of Covariates related to taxonomy on Brassica Performance (V models)...60
3.4.4 Effects of Covariates related to location on Brassica Performance (V models)...63
3.5 Discussion ...63
3.5.1 Variation in Brassica Performance Among Varieties ...63
3.5.2 Seed Parameters ...64
3.5.3 Climatic Match...65
3.5.4 Variation in Brassica Performance Among Locations ...65
3.5.5 Establishment Risk ...66
3.5.6 Conclusions ...67
Chapter 4 High Seed Density and Disturbance Increase Alien Brassica Emergence and Survival but Not Population Growth. ...68
4.1 Abstract ...68
4.2 Introduction ...68
4.3 Methods ...71
4.3.1 Taxa ...71
4.3.2 Location ...72
4.3.3 Experimental Design...72
4.3.4 Data Collection ...73
4.3.5 Analysis ...74
4.4 Results ...80
4.4.1 Emergence (G) ...80
4.4.2 Numbers through Time (L) ...84
4.4.3 Seed Set and Population Increase (λ)...85
4.4.4 Density Dependent Mortality...87
4.4.5 Partitioning of Performance Among Taxonomic Levels ...88
4.4.6 Partitioning of Seed Parameters Among Taxonomic Levels ...89
4.5 Discussion ...89
4.5.1 Effects of Sowing Density and Pre-Sowing Disturbance on Emergence ...89
4.5.2 Effects of Sowing Density and Pre-Sowing Disturbance on Survivorship and Population Increase...91
4.5.3 Effects of Sowing Density and Pre-Sowing Disturbance on Performance Partitioned Among Taxonomic Levels ...92
4.5.4 Conclusions ...93
Chapter 5 General Discussion ...95
5.1 Do new plant species necessarily pose a greater risk than new varieties or genotypes of alien species already in a recipient region? ...95
5.2 Does increasing the availability of safe sites and seeds alter how performance is partitioned among taxonomic levels? ...96
5.4 What is frequency and annual rate of persistence of populations of alien Brassica taxa in
the study system, and how do these vary among taxa? ...97
5.5 Implications and Recommendations for Further Research ...99
5.5.1 Low Population Survival...99
5.5.2 Intraspecific Variation ... 100
Appendix A Confirming Identification of Brassica Taxa Using AFLP ... 103
A.1 Methods ... 103
A.2 Results ... 105
Appendix B Lambda and Brassica Establishment... 108
B.1 Methods ... 108
B.2 Results ... 109
List of Tables
Table 1.1 Summary of Brassica species naturalised in New Zealand ...12 Table 2.1 Summary of Brassica populations recorded on the Canterbury Plains field surveys
over three years, 2010 - 2012, showing the total number of populations and turnover in each year, and the percentage of populations belonging to each taxon recorded. ...23 Table 2.2 Results of GLMs of the probability of Brassica population presence on the Canterbury
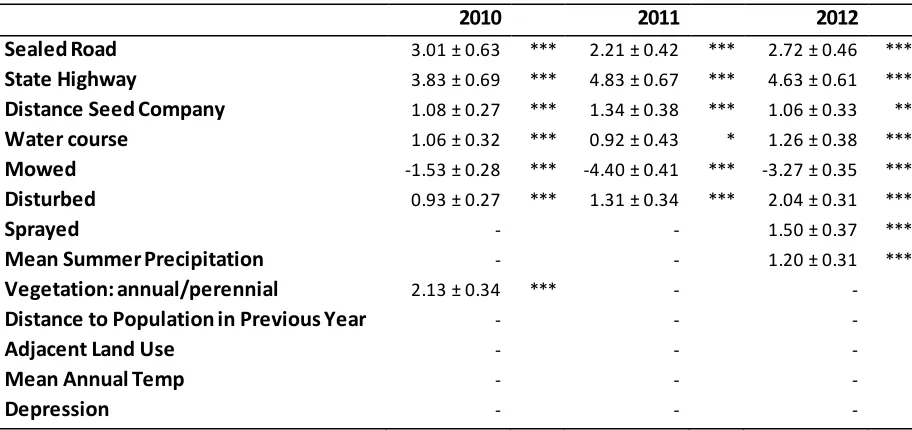
Plains for each year from 2010 - 2012, showing mean regression estimates ± standard errors of significant variables. Factor variables are in comparison to the reference class. A dash indicates the variable was not retained in the best model for that year. Significance: *** = p <0.001, ** = p < 0.01, * = p < 0.05. ...25 Table 2.3 Results Cox proportional hazard models of survival of Brassica populations on the
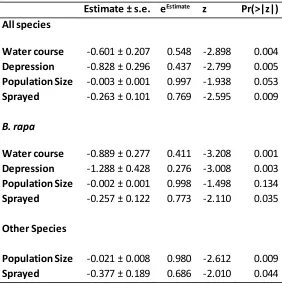
Canterbury Plains 2010 - 2012, showing mean parameter estimates ± standard errors, coefficient exponentials, z values and associated p values, fitted to data for all species combined, and separately for B. rapa and other species (B. napus, B. oleracea
and B. juncea). The coefficient exponentials are interpretable as the proportional effect of that coefficient on the probability of a population becoming locally extinct e.g. holding all other covariates constant, a population sited on a water course has on average 0.548 the risk of becoming extinct each year compared to populations not sited on a water course, an increase in population size of one individual reduces the yearly risk of population extinction by 0.3%. ...30 Table 2.4 Results of GLMs of the probability of Brassica population presence on the Canterbury
Plains for each year from 2010 - 2012, fitted separately to data for B. rapa and other
Brassica species (B. napus, B. oleracea and B. juncea) combined, showing the effect direction of significant variables (‘+’ indicates a positive parameter estimate, ‘-‘ indicates a negative parameter estimate). An ‘NA’ indicates the variable was not
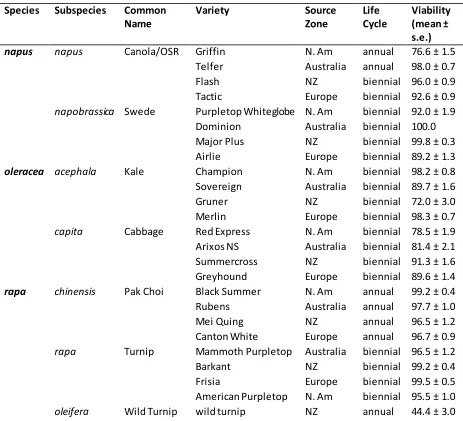
retained in the best model for that year. ...31 Table 3.1 Brassica taxa used in the 2011 seed sowing experiment. OSR is oilseed rape. Source
zone abbreviations are N. Am (North America) and NZ (New Zealand). Viability is the proportion of viable seeds at the time of sowing as measured using the protocols of the ISTA (Don 2003)...46 Table 3.2 For the 2011 seed sowing experiment, summary of explanatory variables included in
the GV model (total number of seeds germinated per 25 × 25 cm cell) and LV model (total number of Brassica individuals per 25 × 25 cm cell in each census), showing variable type (factor or continuous), levels (for factors), and mean, standard error, maximum and minimum values (continuous variables). For factor variables the reference class against which others are compared in G and L models is indicated with a ‘0’...54 Table 3.3 For the 2011 seed sowing experiment, coefficient estimates and 95% credible
intervals for the fixed effects of model GV (total number of seeds germinated per 25 × 25 cm cell). Significant pMCMC values (< 0.05) indicated in bold. Interaction terms are indicated with a ‘×.’ Factor variables are in comparison to the reference level for that factor (Bare Ground 0 – 5%, Road: Unsealed Road, Zone: New Zealand, Shade: Unshaded). Random effects: plot, variety, species, subspecies. n =7800. pMCMC values are calculated as the smallest proportion of estimates from the posterior
distribution lying to one side of 0. ...61 Table 3.4 For the 2011 seed sowing experiment, coefficient estimates and 95% credible
time. n = 54600. pMCMC values are calculated as the smallest proportion of
estimates from the posterior distribution lying to one side of 0...62 Table 3.5 For the seeds of the 25 taxa used in the 2011 seed sowing experiment, the
proportion of variation in viability rates at the time of sowing partitioned among taxonomic levels showing mean and 95% credible intervals for each level (variety, subspecies, species) plus the variation explained by the binomial distribution of
viable/dead seeds and the associated overdispersion. ...62 Table 4.1 Brassica taxa used in the 2011 seed sowing experiment. OSR is Oilseed rape. Viability
is the proportion of viable seeds at the time of sowing as measured using the
protocols of the ISTA (Don 2003), seed mass in milligrams. ...72 Table 4.2 Summary of explanatory variables included in the GV (total number of seeds
germinated per 25 × 25 cm cell)and LV (total number of Brassica individuals per 25 × 25 cm cell in each census), showing variable type (factor or continuous), levels (for factors) and mean, standard error, maximum and minimum values (continuous variables). For factor variables the reference class against which others are compared in G and L models is indicated with a ‘0’...78 Table 4.3 Coefficient estimates, 95% credible intervals (CI), and pMCMC values for the fixed
effects of the GV model (total number of seeds germinated per 25 × 25 cm cell). Interaction terms are indicated with a ‘×’, significant variables written in bold. Factor variables are in comparison to the reference level for that factor; these are Sowing Rate (S.R): 25 seeds/cell, Disturbance: Undisturbed, Bare Ground: 0 – 5%, Shade:
Unshaded. Random effects: plot, variety, species, subspecies. n = 1920...82 Table 4.4 From the 2011 Brassica seed sowing experiment, cotyledons per seed sown,
flowering individuals per seed sown, and λ values for all taxa combined and each species separately (mean ± standard error), for cells sown with 400 seeds/m-2, 4000 seeds/m-2 and with and without pre-sowing disturbance. Letters in parentheses indicate significant differences in the means; for cotyledons per seed sown and flowering individuals per seed sown means were compared using t-tests on log-transformed data; λ distributions were highly non-normal and heteroscedastic, to account for this means were compared using the methods of Herberich, Sikorski et al. (2010). ...83 Table 4.5 Coefficient estimate, 95% credible intervals (CI), and pMCMC values for the fixed
effects of the LV model (total number of Brassica individuals per 25 × 25 cm cell in each census). Interaction terms are indicated with a ‘×’, significant variables written in bold. Factor variables are in comparison to the reference level for that factor; these are Sowing Rate (S.R): 25 seeds/cell, Disturbance: Undisturbed, Bare Ground: 0 – 5%, Shade: Unshaded. Random effects: cell, plot, variety, species, subspecies, and time. n = 23040. ...84 Table 4.6 Estimated population growth rates (λ) for each of the 12 Brassica varieties grown in
the 2012 seed sowing experiment. Shown are λ values for the study region as a whole, and maximum values at the plot and cell scale. λ > 1 indicates an increasing population, written in bold. ...86 Table 4.7 Coefficient estimates, credible intervals (CI) and pMCMC values from the binomial
List of Figures
Figure 2.1 Frequency histograms of Brassica populations recorded on roadsides on the
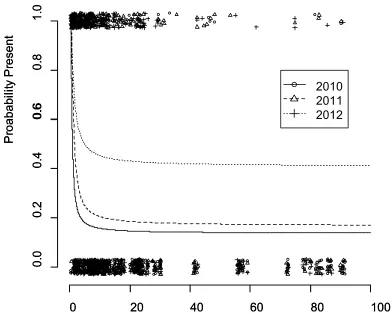
Canterbury Plains in three annual surveys from 2010 to 2012, classed by the number of Brassica individuals in the population (log scale). Black bars indicate populations that were extinct in the following year; grey bars indicate populations that survived until the following year (not shown for 2012, no survey was conducted in 2013). ...24 Figure 2.2 The relationships between the probability of Brassica population occurrence and the
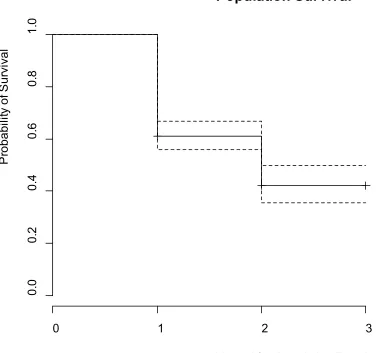
distance to the nearest company handling bulk quantities of agricultural seed. Lines show relationships derived from parameter estimates of GLMs fitted to data from field surveys in 2010 - 2012, symbols indicate survey sites where Brassica populations were present (i.e. probability present = 1) and absent (i.e. probability present = 0). ...26 Figure 2.3 Results of a Cox proportional hazards analysis based on 3 years’ survey data (2010 -
2012) showing estimated survival probability of Brassica populations on the
Canterbury Plains the associated 95% confidence interval. ...28 Figure 2.4 Results of Cox proportional hazards analyses showing estimated survival probability
of Brassica populations on the Canterbury Plains the associated 95% confidence intervals. a) Survival probability of populations from 2011 to 2012 for populations already present in 2010. b) Survival probability of populations from 2011 to 2012 for populations newly founded in 2011. c) Survival probability of B. rapa populations based on 3 years’ survey data (2010 - 2012)...29 Figure 3.1 Layout of a typical plot used in the 2011 seed sowing experiment to quantify Brassica
performance and naturalisation risk in roadside habitats. Transect tapes run between the plot corners which were permanently marked with metal pegs, tapes were used to position the metal frame shown over cells. Replicate rows run parallel to the road. ..47 Figure 3.2 For the 2011 seed sowing experiment, the proportion of variation in numbers of
Brassica seeds germinated per 25 × 25 cm cell (G) and total Brassica numbers per cell in each census (L) explained by a) taxonomic (species, subspecies and variety) differences and b) spatial (among and within plot) differences, along with the associated 95% credible intervals. Shown are results from are models fitted with intercept only (T, partitioning total variation) and models fitted with covariates as explanatory variables (V, Fixed effects: viability rate, vegetation height and cover, road type, precipitation, mean annual temperature, plot shading, geographic zone and its interaction with the previous three variables). n=7800 (G), n = 54,600 (L). Variation in Brassica performance due to time in L models has been omitted to allow comparison of taxonomic and spatial components between G and L models. ...57 Figure 3.3 For the 2012 seed sowing experiment, the proportion of variation in numbers of
Brassica seeds germinated per 25 × 25 cm cell (G) and total Brassica numbers per cell in each census (L) explained by differences among varieties within subspecies within species, among plots and within plots, along with the associated 95% credible intervals. Shown are results from models fitted with intercept only (T, partitioning total variation). n=1920 (G), n = 17,280 (L). Variation in Brassica performance due to time in L models has been omitted to allow comparison of taxonomic and spatial
components between G and L models. ...58 Figure 3.4 For the 2011 seed sowing experiment, the proportion of variation in numbers of
performance due to time in L models has been omitted to allow comparison of
taxonomic and spatial components between G and L models...59 Figure 4.1 Numbers of Brassica individuals per 25 × 25 cm cell from each census (grey dots,
jittered for clarity) at each census of the 2012 seed sowing experiment. 400 = seeds sown at 400 seeds/m-24000 = seeds sown at 4000 seeds/m-2, d = cell vegetation removed and soil disturbed prior to sowing, u = no disturbance treatment. Shown are mean numbers per cell (thick black line) and one standard deviation (grey shaded area)...81 Figure 4.2 Proportion of variation in Brassica performance (L, number of individuals per 25 × 25
cm cell at each census) explained by each taxonomic level (species, subspecies, variety) in the 2012 seed sowing experiment. 400 = seeds sown at 400 seeds/m-2, 4000 = seeds sown at 4000 seeds/m-2, D = cell vegetation removed and soil disturbed prior to sowing, U = no disturbance treatment. n = 23040. ...88
Figure A. 1 Principal Components Analysis plot of AFLP data for the 25 taxa used in the seed sowing experiments. Symbols indicate the identification of the taxa provided by the companies from which the seed was sourced; solid circles = B. oleracea acephala, open circles = B. oleracea capita, solid squares = B. napus napobrassica, open squares = B. napus napus, solid triangles = B. rapa rapa, open triangles = B. rapa chinensis, asterisk = B. rapa oleifera. Numbers indicate the ID numbers of the taxa, see Table A.1... 107
Figure B.1 Mean total Brassica numbers per 25 × 25 cm cell at each of seven censuses in the 2011 roadside seed sowing experiment, with 95% confidence intervals for total
1.1
Overview
1.1.1
Background
It is widely recognised that invasive species cause serious ecological and economic damage (2000, Pimentel et al. 2001, Crooks 2002, Vila et al. 2011, Pysek et al. 2012). This has driven a large research effort to understand the processes underlying invasion and identify potential invaders with the goal of mitigating these impacts (Pheloung et al. 1999, Mack et al. 2000, Champion and Clayton 2001, Byers et al. 2002, Leung et al. 2002, Hulme 2006, Cousens 2008, Hayes and Barry 2008, Gasso et al. 2010, Kumschick and Richardson 2013). This research has sought to understand why some alien taxa become invasive while others do not (Mack 1996, Pheloung et al. 1999, Kolar and Lodge 2001, Hayes and Barry 2008), and why some sites are invaded while others are not (Hastings et al. 2005, Pysek and Hulme 2005, Theoharides and Dukes 2007, Simberloff 2009). While much progress has been made, we still lack the ability to consistently predict which taxa will become invasive and where (Pysek et al. 1995, Mack et al. 2000, Byers et al. 2002, Hulme 2012).
The default approach in invasion ecology has been to treat species as the unit of observation, with the implicit assumption that most variation in traits related to invasiveness resides at the level of species, and that differences within species are comparatively small and negligible (e.g. Stohlgren et al. 1999, Pimentel et al. 2000, Sakai et al. 2001, Grotkopp et al. 2002, Strayer et al. 2006, Kumschick and Richardson 2013). This is despite longstanding recognition that variation within species may be an important driver of variation in invasiveness (McNeill 1976, Williamson 1992), and a small but growing body of studies that suggest there may be considerable variation in important ecological characteristics and invasiveness within alien species (Saltonstall 2002, Kinter and Mack 2004, Vellend et al. 2010, Merrill et al. 2012, Hierro et al. 2013). An understanding of how intraspecific variation can affect invasion outcomes may improve our understanding of the processes underlying invasions and our ability to predict the risks posed by alien species.
Brassica as a model system to answer this question because it has a well-defined and diverse hierarchical taxonomy (Tsunoda et al. 1980, Gupta 2009, Ramchiary et al. 2011, USDA 2013) and several species are widely naturalised worldwide and in New Zealand (Pessel et al. 2001, Randall 2002, Heenan et al. 2004b, Gulden et al. 2008, Peltzer et al. 2008, Mizuguti et al. 2011). I reframed the motivating question as a testable hypothesis for the genus Brassica: most variation in the performance of alien Brassica resides among species rather than within species. My core question was thus:
A) Does most variation in the performance of alien Brassica reside among species, or is there similar or greater variation in performance within species?
Before tackling the central question of my thesis I aimed to gain a better understanding of my chosen model system by asking:
B) What are the drivers of naturalisation of Brassica, i.e. biotic and abiotic correlates of population presence and persistence, and how do these vary among taxa?
C) What is frequency and annual rate of persistence of populations of alien Brassica taxa in the study system, and how do these vary among taxa?
Building on results obtained in objectives A, B and C, along with a knowledge the factors associated with Brassica naturalisation from the literature I asked:
D) Can limited recruitment of Brassica be overcome by increasing the availability of safe sites and seeds?
And I tested the robustness of my answer to A in an additional ecologically realistic scenario:
E) Does increasing the availability of safe sites and seeds alter how performance is partitioned among taxonomic levels?
1.1.3
Structure
In chapter one I discuss the choice of Brassica as a model system, and provide a concise review of relevant literature (the current species-based approach in invasion ecology; intraspecific variation in plant traits and naturalisation with a focus on Brassica; Brassica biology, ecology, and naturalisation). Chapter two presents the results of three annual field surveys of feral Brassica populations in Canterbury, in which I aim to identify biotic and abiotic correlates of population presence and persistence at landscape and local scales, and quantify population frequency and annual rate of persistence (objectives B and C).
Chapter three tackles the core question of my thesis (objective A); using a seed sowing experiment, I aim to identify how variation in Brassica performance is partitioned among taxonomic levels (species, subspecies and varieties) and locations (among and within plots).
In chapter four I manipulate seed sowing density and pre-sowing disturbance in a second seed sowing experiment to investigate if increasing the availability of seeds and safe sites can overcome limitations to Brassica establishment or alter the partitioning of performance among taxonomic levels (objectives D and E).
In chapter five I summarise, synthesise and discuss the main results. Appendices present material which would be presented as supplementary material in published papers, or would be omitted from published papers but is included here for completeness and to preserve data collected and analyses performed as part of the thesis.
1.2
Choice of
Brassica
as Model System
The core question that I sought to answer was: Does most variation in the performance of alien
Brassica reside among species, or is there similar or greater variation in performance within species? The high economic importance of Brassica cultivation in New Zealand makes this a practical test case of the issues involved. Active breeding programs (e.g. Lammerink and Hart 1985, Gowers and Nicol 1989, Ellis and Farrell 1995, Douglas 2005, Carter 2007, Christey et al. 2008, Jong et al. 2010) can be enhanced by the importation of new varieties and genotypes.
(Tsunoda et al. 1980, Gupta 2009, Ramchiary et al. 2011). Several Brassica species are known to have naturalised worldwide (Randall 2002); within Canterbury, New Zealand at least four species (B. rapa,
B. napus, B. oleracea and B. nigra) are known to form naturalised and casual populations along rural roadsides and other disturbed areas (Heenan et al. 2004b, Peltzer et al. 2008).
The choice of Brassica as a model system requires that there are some limitations on how broadly the results can be interpreted. The species chosen to test my core hypothesis are closely related, (U 1935), and I deliberately set out to maximise variation within species, which can be unusually large in
Brassica (Tsunoda et al. 1980, Gupta 2009, Ramchiary et al. 2011). Furthermore the Brassica are generally annual and biennial. Populations of annual and biennial taxa are by their nature often transient, forming part of a larger metapopulation, whereas many of the plants considered to be amongst the most problematic invaders are persistent perennials. The results presented here may not be generalizable to other genera, for example those containing less variation within species or perennial taxa.
1.3
Species-based approach in Invasion Ecology
variation in invasiveness within species (see below, 1.4 Intraspecific Variation in Plant Traits and Invasiveness).
The use of a species-based approach in invasion ecology most likely stems from three sources. First, using species as the unit of observation is prevalent throughout the biological sciences; indeed, species is generally viewed as the fundamental unit of our taxonomic system (Mishler and Donoghue 1982, Luckow 1995, Lee 2003). Second, intraspecific taxa are often difficult to identify on the basis of morphology (e.g. Garcia et al. 2002, Curn and Zaludova 2007). Other identification techniques, such as flow cytometry and AFLP, can be expensive and time consuming, and may still be unable to provide sufficient taxonomic resolution (Campbell et al. 2003), although the situation is improving (Agarwal et al. 2008). Data such as herbarium records and plant trait databases are also frequently not available at the level of subspecies, cultivars or varieties. Together these factors make studies of invasion at taxonomic levels below that of species difficult, and without a strong motivating research objective, hard to justify. Third, invasion ecology has a long history dating back to the 19th century when, for example, agriculturists had a keen interest in understanding what allowed weeds to invade cultivated fields. However, the current intense interest in the field is a relatively recent phenomenon, beginning with Elton’s (1958) seminal work on the topic, and research has burgeoned over the last 30 years (Richardson and Pysek 2008, Pysek and Hulme 2009). Perceived priorities such as disentangling the influences of alien species traits, biotic and abiotic environmental characteristics, introduction history and pathways, and anthropogenic habitat modification (to name a few of the multiple factors interacting to determine invasion outcomes) have been challenging (Catford et al. 2009, Romanuk et al. 2009, Heger et al. 2013). The sometimes serious impacts of invasive aliens along with the increasing rate at which species are being transported around the globe have lent urgency to the research program. As a result the possibility that intraspecific variation may result in substantial variation in invasiveness within species has been largely overlooked, or put aside to focus on more obvious research priorities.
1.4
Intraspecific Variation in Plant Traits and Invasiveness
in new habitats depending on the match between conditions in the source and recipient region (Saji et al. 2005, Nosil 2007, Sobel et al. 2010, Lekberg et al. 2012).
A recent meta-analysis quantified the proportions of variation residing among and within species for 10 commonly studied plant traits, using a database of 2.88 million trait entries for 69 000 plant species, and 3 million ancillary data which were used to account for trait variation due to phenotypic plasticity (Kattge et al. 2011). This study gives the best picture currently available of how variation in plant traits is distributed among and within species. The results showed that while most variation in the studied traits resides among species, intraspecific variation was substantial and accounted for around 40% of the overall variation in three traits (leaf phosphorus content per dry mass, leaf nitrogen content per area, and light saturated photosynthetic rate per leaf area). Around 10% of the overall variation in seed mass, 18% of the variation in plant height, and 30% of the variation in specific leaf area was within species. Of the traits analysed, that with the least variation residing within species (7%) was leaf longevity.
Intraspecific variation can also be substantial in traits thought to influence invasiveness such as seed mass (Baker 1965, Rejmanek et al. 2005), fecundity (Mason et al. 2008), tolerance of physical stress (Chahal et al. 2013, Gabler and Siemann 2013), growth rate (Grotkopp et al. 2010, Pan et al. 2012), and ploidy (Munzbergova 2006, Halverson et al. 2008). Here I focus on Brassica because intraspecific trait variation in the genus is comparatively well-documented and Brassica is the model system used in this thesis, but examples from other genera are included where examples from Brassica were not available. Seed mass can vary widely within species. Hendrix and Sun (1989) documented variation in seed mass of 3 - 16 fold within Umbellifer species, while Voller et. al (2012) suggested there is typically around 10 fold variation in seed mass within grassland species. Studies which compare the fecundity of genotypes within species while controlling for the confounding effects of environment are not common, but there can clearly be substantial variation. Miri (2007) compared 16 varieties of
of clover (Trifolium repens) originating from Europe, the Middle East, China, New Zealand and Australia there was a 3 fold difference in growth rates when grown in standardised conditions (Hofmann et al. 2000). Rapid cycling B. rapa (RCBr) completes its life-cycle far more rapidly than conventional annual and biennial varieties and can produce up to ten generations per year(Williams and Hill 1986, Kelly 2006). Brassicaceae is well known for its large variation in ploidy (Marhold and Lihova 2006); B. rapa has diploid, triploid and tetraploid varieties (Elling et al. 2010), while Cardamine
species can have cytotypes ranging as many as six ploidy levels (Marhold et al. 2010).
Little is known about the magnitude of variation in invasiveness within species. Williamson (1992), and Williamson and Fitter (1996) in reviews of the potential hazards of genetically modified organisms and the characteristics of successful invaders compiled examples of how small genetic differences can alter ecological characteristics and may lead to increased invasiveness. However, these examples were generally speculative, pertained to taxa that were classified as (closely related) distinct species, or did not show a causative link between within species variation in genes or traits and variation in invasiveness. For example, it has been speculated that the observed switch of
Epilobium angustifolium from a rare British native herb to a wide-spread invasive species early this century may have been due to the introduction of new genes from garden stocks or North American congeners (Salisbury 1961), but evidence to support this interpretation is lacking. Another example illustrates how changes in ploidy can give rise to invasive genotypes, even without any new genes, although the new genotype bears its own species epithet. Common cordgrass, Spartina anglica, is an allelotetraploid that arose from hybridisation of Spartina maritima and Spartina alterniflora
(Marchant 1967). Neither of the progenitor taxa are invasive, but S. angelica invades waterways and intertidal flats and is considered to be a serious pest in the U.K., Asia, Australia, New Zealand and North America (Hedge and Kriwoken 2000, Grevstad et al. 2003, An et al. 2007, Nehring and Hesse 2008).Similarly, Impatiens capensis, introduced from North America is invasive in England, while its allospecies I. noli-tangere (Hulten and Fries 1986) is a rare and declining English native, yet trait differences between the two appear to be trivial (Perrins et al. 1992). Chondrilla juncea is an obligate apomict alien introduced into Australia from the Mediterranean. As a result of its obligate apomixis there are at least three genetically isolated, distinct races (Burdon et al. 1981).The rust fungus
whether any increase in performance is the result of genetic diversity per se, or a sampling effect where more diverse genetic mixtures of an invader are more likely to include high performance, invasive genotypes (Dlugosch and Parker 2008). Vellend et al. (2010) added mixtures of dandelion (Taraxacum officinale) seeds containing from one to five dandelion genotypes to plots of Kentucky bluegrass (Poa pratensis) and measured dandelion performance. More diverse mixtures performed better. While this result may be in part due to increased invasiveness due to higher genetic diversity, the identity of genotypes was more important in explaining performance than genetic diversity, and the authors suggested that the better performance of more diverse dandelion mixtures was largely due to a sampling effect and the eventual dominance of highly productive dandelion genotypes (Vellend et al. 2010). Furthermore, in a separate common garden experiment Vellend et al. (2009) found differences of over an order of magnitude in plant size and seed production among six T. officinale genotypes, as well as significant differences in the timing of reproduction. While the authors did not test for links between these traits and invasiveness or population performance, such variation among genotypes suggests there is potential for selection among genotypes during invasion (Vellend et al. 2009).
A few studies have shown a link between genetic or trait differences and invader performance. Perhaps the best studied case is that of cheatgrass (Bromus tectorum). Cheatgrass was introduced into New Zealand and the USA from Europe over 100 years ago. In New Zealand it has proved to be a benign casual occupant of disturbed areas such as roadsides, while in the USA it has invaded large areas of intact shrub- and grassland, resulting in a range of economic, community and ecosystem impacts (Kinter and Mack 2004). Common greenhouse experiments indicate that differences in performance between the two recipient regions can be explained by the introduction of different genotypes, with plants from North American populations being larger and more vigorous than those from New Zealand populations (Kinter and Mack 2004). Genetic analysis indicates that specialist B. tectorum genotypes are allowing further expansion into previously uninvaded habitats in the USA (Merrill et al. 2012). Another example of the introduction of genotypes with traits leading to increased invasiveness was documented by Hierro et al. (2013). They used a reciprocal common garden experiment to show that the seed mass of demes of the invasive ruderal Centaurea solstitialis
(Belzile et al. 2010, Mozdzer and Zieman 2010), and have invaded large areas where the species was previously absent, displacing the native genotype and other native species (Saltonstall 2002, Guo et al. 2013).
1.5
Brassica
Biology, Ecology and Naturalisation
The genus Brassica (Brassicaceae) comprises mostly monocarpic annuals and biennials native to Western Europe, the Mediterranean and temperate Asia. It is has a long history of intense artificial selection, and is one of the most diverse genera of cultivated plants. The six commonly cultivated
Brassica species are interrelated; three diploid species (B. oleracea, B. nigra and B. rapa) appear to have given rise to three amphidiploids (B. napus, B. juncea and B. carinata) via interspecific hybridisation (U 1935). The genus contains considerable variation in morphology, breeding traits, ploidy, phenology and ecological tolerances (Tsunoda et al. 1980, Gupta 2009). Recently the genus has been the subject of considerable genetic modification research, and has been widely utilised in studies of the risks posed by genetically modified crops through gene flow via hybridisation (Bing et al. 1996, Allainguillaume et al. 2006, FitzJohn et al. 2007, Devos et al. 2009).
Brassica are widely grown in New Zealand and other temperate regions globally for crops, seed and forage, and are of considerable economic importance. Fifteen species are recognised as having been imported into New Zealand (MAF 1998) of which 8 are considered naturalised, occurring primarily on road-verges and wasteland (Table 1.1, Webb et al. 1988, Heenan et al. 2002, Heenan et al. 2004a, Heenan et al. 2008); the wild turnip (B. rapaoleifera) is notable for being widespread and displaying weedy characteristics (Heenan et al. 2004b). Within these species there are approximately 45 subspecies and varieties, encompassing approximately 200 cultivars and hybrids (Gareth Holmes, personal communication).
around 20 °C (Morrison and McVetty 1991, Jensen et al. 1996), with a minimum of competition from other vegetation (Miller and Schemske 1990, Miller 1995, Diepenbrock 2000) and post-emergence disturbance (Eager et al. 2013). The time until flowering varies widely among and within Brassica
species, as well as with temperature (Gomez-Campo 1999); there is also evidence that some genotypes are sensitive to photoperiod, requiring short days to flower (Parkinson 1952, Tommey and Evans 1991). Some taxa are nominally biennial although this most likely reflects the usual time taken to complete the juvenile stage and reach the conditions necessary to trigger flowering, rather than a strict requirement to pass through a winter before flowering (Gomez-Campo 1999). Seeds form in siliques; the number of seeds produced depends largely on the strength of competition for resources, plant size, availability of nitrogen and water and shading (Sharma and Ghildiyal 1992, Gammelvind et al. 1996, Gomez-Campo 1999).
Research on Brassica naturalisation has focussed on oilseed rape (canola, Brassica napus) due to its commercial importance and concerns about gene flow from genetically modified varieties and the large areas cultivated (Pessel et al. 2001, Heenan et al. 2004b, Gulden et al. 2008, Knispel and McLachlan 2010, Mizuguti et al. 2011). Feral populations are common along road verges in areas of production globally (Randall 2002, Heenan et al. 2004b, Saji et al. 2005, Knispel and McLachlan 2010, Squire et al. 2011). Few of these studies have investigated biotic and abiotic site characteristics which influence Brassica naturalisation, although they are thought to rely on disturbance to establish in predominantly perennial roadside habitats (Crawley and Brown 1995). Observations suggest weed control practices such as mowing and herbicide application may disturb established vegetation and facilitate Brassica establishment (Knispel and McLachlan 2010). Most research has focussed on propagule supply and mechanisms of recruitment. Specifically, whether populations are: 1) transient populations reliant on seed immigration to maintain a presence in the landscape, 2) persistent due to longevity of seeds below ground and extended dormancy resulting in survival through seed banks, or 3) persistent due reproduction and local recruitment. This is largely due to an interest in whether populations persist and can act as reservoirs for transgenes (Ellstrand et al. 1999, Jenkins 2005, FitzJohn et al. 2007), but also reflects the fact that propagule pressure is likely to have a major influence on naturalisation (Lockwood et al. 2005, Colautti et al. 2006, Simberloff 2009). Surveys of
10 years (Hails et al. 1997, Pessel et al. 2001, Pivard et al. 2008b). Evidence for local recruitment is scantier although seed set has been recorded in up to 30 - 48% of feral populations (Elling et al. 2009). Still other studies have found contributions from all these processes, suggesting around half of populations are ephemeral (35% resulting from seed escapes from adjacent fields and 15% from seeds spilt during transport) and half persistent (40% from seed banks and 10% from local recruitment) (Pivard et al. 2008a). Whether immigrant seeds come from adjacent fields or spills during transport is also debated; again evidence supports both (Crawley and Brown 1995, Pivard et al. 2008b). While there is good evidence that trucks do spill seeds during transport (von der Lippe and Kowarik 2007, Bailleul et al. 2012), and that major roads tend to have more populations than minor ones (Pivard et al. 2008a, Knispel and McLachlan 2010), it is unclear whether this road effect is the result of higher propagule pressure of different management and disturbance regimes (although see Crawley and Brown 1995). Furthermore, there may be significant inter-year variation in the relative importance of these processes (Peltzer et al. 2008).
1.6
Summary
Table 1.1 Summary of Brassica species naturalised in New Zealand
Species Life cycle Distribution Habitat Height (m) Flowering
Time Petal Colour
fruticulosa biennial to
perennial Palmerston North, Raumati, Wellington
Waste land, roadsides, cliffs, and sandy places
< 1 Jan - Dec yellow
juncea annual Northland,
Canterbury
Roadsides, sandy beaches, waste land
1 - 2 Sep - Feb yellow
napus annual or
biennial Throughout NZ Locally naturalised on coasts, and an occasional casual escape from cultivation on roadsides and in cultivated fields
< 1.5
(Sep)-Oct-Dec-(Apr) yellow
nigra annual Auckland
(Waitemata Harbour), Canterbury, Otago
A rare casual weed on waste land and among crops
0.6 - 1 - (2) Dec - May yellow
oleracea biennial to
perennial Throughout NZ Locally established on coastal cliffs, a casual cultivation escape inland
1 - 2 - (3)
(Jul)-Oct-Nov-(Apr) pale yellow or white
oxyrrhina annual Known from
Tokerau Beach, Northland only
Established on sand dunes among lupin scrub
< 0.50 Nov - Jan cream with purple veins
rapa annual Throughout
NZ Common and persistent weed of pastures, roadsides, waste places and gardens
< 1.5
(Jul)-Sep-Feb-(Jun) yellow
tournefortii annual Auckland,
Tauranga, Taranaki, Wanganui, Horowhenua, Marlborough, Canterbury Occasionally established in sandy coastal sites, especially in North; casual in railway yards and near flour mills in South
< 1
2.1
Abstract
Alien plant populations often become extinct due to demographic and environmental stochasticity, unsuitable traits, and Allee affects. Such aliens may appear to persist and be naturalised if new populations are founded by dispersed or immigrant propagules at a rate on average equal to that of extinction. Differentiating between transient and persistent populations is crucial to our understanding and management of invasions.
I recorded roadside alien Brassica populations present on the Canterbury Plains in New Zealand in three annual surveys, along with measures of seed sources, site and management characteristics that may influence the probability of population presence and survival. Using GLMs and proportional-hazard models I assessed which factors were associated with population presence and survival, and the probability of population survival from year to year.
Brassica appears to be adventive and may fail to persist in the landscape much beyond ten years without anthropogenic seed input. Around 60% of populations were extinct two years after foundation, but seed rain focused around transportation routes and seed companies founded new populations, compensating for the rate of extinction. Presence of Brassica populations was not related to proximity to Brassica fields or other feral populations. Stochasticity and trait-site mismatch were major causes of population extinction. Adventive aliens can be controlled by managing propagule sources, and accounting for population extinctions is important to accurately assess distributions from cumulative presence data.
2.2
Introduction
Understanding the factors that drive variation in the temporal and spatial distribution of introduced
Chapter 2
Landscape-Level Persistence and Distribution of Casual Alien Feral
landscape and give the appearance of population persistence. This can occur both when continued external propagule inputs (such as accidental anthropogenic seed dispersal) result in sink populations continually appearing and disappearing in the landscape, and when seed emigration from populations prior to local extinction founds new populations in new locations, resulting in a dynamic metapopulation at the landscape scale (Shmida and Ellner 1984, Pulliam 1988, Crawley and Brown 1995, 2004). Removing the propagule supply of aliens which are present in the landscape only as sink populations will prevent further populations being founded and offers the hope of easy control or eradication (e.g. Hayward 2006); species which establish persistent populations and metapopulations are likely to be harder to control. Differentiating among transient, persistent and metapopulations, and identifying the factors which drive these differences is crucial to our understanding of the processes underlying alien invasions and efforts at their management and control.
drop in demographic rates simultaneously is reduced. The degree to which metapopulation is buffered against fluctuations in the environment depends on the extent to which those fluctuations covary across occupied patches (Stacey and Taper 1992). Second, Allee effects, i.e. reduced survival or reproductive success at low densities, can drive populations below a threshold density where extinction becomes inevitable (Courchamp et al. 1999, Taylor and Hastings 2005). Third, biotic or abiotic conditions may be a poor match for the alien’s requirements for growth and reprodcution, leading to an inexorable decline in numbers to extinction (Maron and Vila 2001, Levine et al. 2004). Fourth, alien populations may be eradicated by either targeted or non-targeted management (Navie et al. 2010, Baider and Florens 2011).
Feral Brassica populations are commonly found along road verges in areas where commercial
2004b), but it is unclear whether their continued presence in the landscape is due to continual seed rain founding a series of transient sink populations (i.e. Brassica are adventive), the existence of a self-sustaining meta-population, or individual self-sustaining populations. It is also unknown whether the prevalence of B. rapa reflects higher propagule pressure or less stringent biotic and abiotic conditions required for the foundation and/or persistence of populations of this species. In three annual field surveys I systematically recorded the occurrence of populations of Brassica species, along with measures of propagule pressure, and site characteristics which may influence the likelihood of populations being founded or persisting.
I set out to determine 1) whether populations were transient sink populations or persistent, and the probability of population survival from one year to the next; 2) which factors were associated with population presence and population survival from one year to the next, and which factors may explain why some populations are transient and while others persist: i.e. species identity, biotic and abiotic site characteristics, management practices, and propagule sources (seed spill from trucks, seed spill from adjacent fields, reproduction and seed set, and immigration from other nearby
Brassica populations resulting in a metapopulation). In line with current knowledge I expected that most populations would be transient and that population presence would be driven by external seed inputs and disturbance, while population persistence would be associated with larger populations in unmanaged sites. The results have implications for understanding the processes underlying invasions by alien species and targeting management.
2.3
Methods
2.3.1
Study Area
The area is covered by a network of roads, ranging from minor dirt and gravel roads to sealed state highways. These roads have a verge, ranging in width from approximately 2 to 5 metres, where the resident vegetation is largely a reflection of the species grown in neighbouring fields; perennials dominate, particularly alien grasses (Loliumperrene and Dactylisglomerata) and clovers (Trifolium repens and T. pratense ). Naturally occurring populations of introduced Brassica (mostly B. rapa, with some B. napus, B. juncea and B. oleracea) occur along these road verges, although these are comparatively rare (Heenan et al. 2004b, Peltzer et al. 2008). The vegetation of the road verges is managed to control weed populations (including Brassica) to variable extents and this can range from frequent mowing and spraying with herbicides (particularly around drainage ditches and fence-lines) to no management.
2.3.2
Field Surveys
From 2010 to 2012 vehicular surveys of Brassica populations along roadsides were conducted in September and October, to coincide with the peak flowering time for Brassica. I used the sampling regime established in a 2003 survey of roadside Brassica populations in the study area so that my results would be comparable to those of the 2003 survey (Heenan et al. 2004b, Peltzer et al. 2008). I conducted surveys by motor vehicle at as near as possible to a constant speed of 70 km/h; Brassica
The following variables were recorded for each Brassica population located: species, subspecies (for
B. napus and B. rapa), number of Brassica plants and location. For populations of up to 100 individuals, the number of plants was counted; above this the population size was estimated by determining the area occupied by 100 plants and using this to extrapolate the total population size. The geographic location and altitude of each population was recorded using GPS. I expected the probability of a Brassica population being present, and the likelihood of it persisting from year to year, to be influenced by propagule pressure, site and management characteristics, and climate, so I collected data to quantify these for each Brassica population. Variables associated with propagule pressure were land use in the adjacent field (Brassica or other), distance to the nearest location of a company handling bulk quantities of agricultural seed, distance to the nearest Brassica population in the previous year, and road type. Seeds which escape fields during sowing may establish populations in the same year in adjacent road verges. Data about land use in the year prior to populations being recorded were unobtainable, so I was unable to account for seeds which may have escaped during harvest and germinate that autumn or the following spring. Traffic is thought to be a major dispersal pathway for Brassica seeds (Crawley and Brown 1995), state highways are thus likely to experience higher propagule input than minor or unsealed roads. Roads closer to seed companies are likely to carry more seed transportation trucks, and are expected to be positively associated with Brassica
presence. In addition, populations which set seed are an additional source of seeds; these may be dispersed and found populations at other sites, although it is thought dispersal of Brassica seeds along roadsides is usually limited to a few metres (Garnier et al. 2008). Site characteristics were management (mowed or sprayed with herbicides), occurrence along a water course or in a depression, disturbance and vegetation type. Water courses were mostly artificial drainage and irrigation ditches and culverts, but also included streams; these are moist and often less intensively managed than more accessible road side areas. Depressions were any surface irregularities which prevented mowing of the vegetation down to the same level as the surrounding area. Disturbances (e.g. by vehicles or stock) are thought to facilitate Brassica establishment by reducing competition for space and nutrients (Crawley and Brown 2004, Claessen et al. 2005). Vegetation was characterised as consisting of predominantly perennial or annual/biennial species. Climatic variables (mean winter and summer precipitation, plus mean annual, maximum January and minimum July and air temperatures) were obtained from the National Institute of Water and Atmospheric Research (NIWA) 500 × 500 m resolution climate maps (Tait 2007a, b); these covary with altitude. I expected
Brassica populations to be more frequent in locations with higher precipitation and temperatures.
within each of the 50 surveyed squares (500 total). These sites were selected by calculating one tenth of the total road length in each plot, and stopping regularly at this interval within the plot. No
Brassica populations were recorded at these sites in 2011 or 2012. Although some variables may change between years at the specific sites measured (i.e. mowing, herbicide use, disturbance, adjacent land use, distance to the nearest Brassica population in the previous year), I assumed that the variables recorded at these sites in 2010 characterised sites where Brassica were absent in the landscape, and could be used to characterise sites where Brassica were absent in 2011 and 2012.
To be able to determine whether the density of Brassica seeds in the soil at a site influenced the likelihood of a Brassica population persisting until the following year, from each population present in summer 2010 I collected soil samples in March 2011, at the end of the growing season and after seed set had occurred. From a 2 × 2m plot at the centre of each population I collected 10 randomly located samples, each of 100 ml of soil; these were bulked to make a single sample of 1 L of soil from each population (n = 121). Each bulked sample was spread evenly to a depth of approximately 2 cm over a bed of sterile seed germination mix (60% Peat, 40% sterilised pumice, plus 2kg Osmocote exact mini (16-3.5-9.1), 4kg Dolomite, 1kg Hydrafloin per cubic metre) on a tray within 48 hours of collection (Roberts 1981, Gross 1990). These were kept in a glasshouse and watered sufficiently to keep moist. Every two weeks any germinated seedlings were pricked out and the number of Brassica
seedlings recorded, until no further germination occurred.
2.3.3
Analysis
Influence of Seed Sources, Management and Local Site Characteristics on the Probability of
Brassica
Population Presence
herbicides), and to assess how abiotic and biotic site characteristics were related to the probability of
Brassica presence (disturbance, water course, depression, vegetation type, precipitation and air temperature). Distance to the nearest Brassica population in the previous year was omitted from the model for 2010 because no data were available on the locations of Brassica populations in 2009. Continuous variables were standardised to make them comparable by subtracting the mean and dividing by two standard deviations (Gelman A 2007). Climatic variables covaried with each other and elevation so I selected one measure each of temperature and precipitation which best explained the probability of a Brassica population being present. I fitted simple models with Brassica
presence/absence as the response variable and each climatic variable as the explanatory variable; models using mean annual minimum temperature and mean summer rainfall had the lowest AIC values so I retained only these climatic variables in my analysis. To fit the models I included all significant variables in a maximal model and used step-wise backwards selection based on AIC values to arrive at the best model.
Survival of
Brassica
Populations
To test which variables influenced the likelihood of Brassica populations persisting from year to year I fitted Cox proportional hazard models in R (R Development Core Team 2012) using the function coxph from the package survival. I used this modelling method because the data was censored; I did not know whether populations recorded in 2010 were newly formed that year, or had survived from 2009 or earlier; similarly, populations recorded in 2012 may persist beyond the study timeframe. The Cox method is a semi-parametric procedure analogous to multiple regression. It is most often used to examine the effects of explanatory variables on the survival times of subjects and is appropriate for censored datasets because it allows for survival beyond the bounds of observations (Cox 1972, Caesar 2003). Here Cox proportional hazard models were used to assess the baseline yearly survival probability of Brassica populations, and the relative effects of management, propagule pressure, climate, and abiotic and biotic site variables on the yearly survival probability of Brassica populations.
To assess the baseline yearly survival probability of Brassica populations I first fitted a model without any explanatory variables; this model gives a measure of the overall yearly survival rate of Brassica
populations and the associated uncertainty (Cox 1972). I fitted a second model which allowed me to test which management practices, site characteristics, and seed sources influence yearly survival of
stochasticity (Cohen 1966, Matthies et al. 2004), so for each population I included the mean population size (over the three survey years) as an additional explanatory variable. To test if B. rapa
populations had a greater probability of persisting than populations of other species I included species (classed as B. rapa or other) as an additional explanatory variable. Management, disturbance, vegetation type and adjacent land use data could not be recorded for sites prior to the first detection of a population; for example if a population was first recorded in 2011, these data were not recorded in 2010. To account for this I used the mean of the available observations for these variables. This gives a measure of the probability of each state occurring in any given year; i.e. that a site was mowed, sprayed, disturbed, had annual/biennial vegetation or was adjacent to a Brassica crop. I arrived at the best models by including all explanatory variables in a maximal model which I simplified by AIC backwards step-wise selection.
To quantify the baseline yearly survival probability of B. rapa populations and that of other Brassica
species I re-fitted the model without explanatory variables to the data for B. rapa populations and the data for all other Brassica species combined. To test if different factors were associated with survival of B. rapa populations and other Brassica species, I re-fitted the model with explanatory variables to the data for B. rapa populations and the data for all other Brassica species combined.
Brassica napus, B. oleracea and B. juncea populations did not occur frequently enough to have sufficient data points to fit a model for each of these species individually.
To test whether populations which had already survived at least one year had a greater probability of surviving to the next year than newly founded populations, I fitted two additional Cox proportional hazard models; one to the data from populations present in 2010 and 2011, and another to data from populations absent in 2010 but present in 2011. These models did not have any explanatory variables and allowed me to estimate the probabilities of established and newly founded Brassica
populations surviving to the next year, along with the associated uncertainties.
2.4
Results
2.4.1
Frequency, Dynamics, Size and Taxonomic Composition of
Brassica
Populations
A total of 401 separate Brassica populations were recorded in all surveys (Table 2.1). Populations were widespread but infrequent; over the three survey years there was on average around one population present per 15km of road, or 6.4 individuals per kilometre of road. Most populations did not survive for more than one or two years; the percentage of populations recorded in 2010 that were still present in 2011 was only 43.8%, and by 2012 this was only 15.7% (Table 2.1, see also Fig. 2.1 black bars vs. grey bars).
There was a large turnover of populations from year to year: in the interval from 2010 to 2011 around half of the populations became extinct, but around twice as many new populations were founded; in the interval from 2011 to 2012 around three quarters of the populations became extinct, but a similar number of new populations were founded (Table 2.1, Populations Extinct and Populations Founded in Previous Year). The total number of populations recorded was variable among years (mean ± s.e., 150 ± 19), and tended to increase over the course of the study. Around 60% of surveyed 3 × 3 km squares contained no Brassica populations in each year; as such these proved to be unsuitable replicate units for a statistical analysis of variation in the number of populations among years.
Most populations were small, comprising fewer than ten individuals, few populations comprised more than 1000 individuals, and the largest was estimated to contain 5000 individuals (Fig. 2.1). Much of the increase in the number of populations from year to year comprised small populations of a few individuals (Fig. 2.1).
The taxonomic composition of populations was remarkably stable among years (Table 2.1), comprising mostly B. rapa (63.2 ± 2.3%), followed by B. napus (24.9 ± 2.5%) with smaller amounts of
Table 2.1 Summary of Brassica populations recorded on the Canterbury Plains field surveys over three years, 2010 - 2012, showing the total number of populations and turnover in each year, and the percentage of populations belonging to each taxon recorded.
2010 2011 2012 mean ± s.e. Populations: Total 121 177 190 150 ± 19
Total Extinct in Previous Year - 68 143 105 ± 21
Total Founded in Previous Year - 124 156 130 ± 13
Brassica rapa (%) 64.5 57.6 68.4 63.2 ± 2.3
oleifera (%) 48.8 47.5 47.4 47.9 ± 0.5
chinensis (%) 8.3 9.0 19.5 12.3 ± 3.6
rapa (%) 7.4 1.1 1.6 3.4 ± 2.0
Brassica napus (%) 24.0 29.9 27.4 24.9 ± 2.5
napus (%) 21.5 28.8 27.4 25.9 ± 2.2
napobrassica (%) 2.5 1.1 0 11.2 ± 0.7
Brassica rapa × napus (%) 4.1 5.6 0.5 2.8 ± 1.2
Brassica oleracea (%) 0.8 1.1 1.1 3.0 ± 2.0


![5 [(6 Chloro [1,3]benzothiazol 2 ylamino)methylene] 2,2 dimethyl [1,3]dioxane 4,6 dione](data:image/gif;base64,R0lGODlhAQABAIAAAP///wAAACH5BAEAAAAALAAAAAABAAEAAAICRAEAOw==)