SAND:
Smart
and
Adaptable
Networking
Design
Using
Virtual
Slicing
over
Software-Defined
Network
Farah
I.
Kandah
1,*,
Steven
Schmitt
21,2 ComputerScienceandEngineeringDepartment
UniversityofTennesseeatChattanooga,
Chattanooga,TN37403
Abstract
The importance of reliable and adaptable networks has become increasingly relevant with the escalation of connectivity in our lives. The growth of streaming of entertainment and development of always online software has created an environment of large data flows that need to be handled efficiently. Historically this problem has been solved with hardware-based load-balancers. These solutions often times are expensive and lack flexibility and scalability. With the use of Software-Defined Networking, a more dynamic solution can be created to meet network load balancing needs. We propose a Smart and adaptable network design seeking to utilize network resources more efficiently by identifying traffic patterns and analyzing network metric to dynamically build virtual slices. With this design, we were able to solve the aforementioned issues through minimizing packet loss, maximizing network link utilization, and efficiently reduce the load on the controller.
Received on 12 December 2017; accepted on 14 January 2018; published on 23 January 2018
Keywords: Load balance, SDN, Virtual Slicing.
Copyright © 2018 Farah I. Kandah et al., licensed to EAI. This is an open access article distributed under the terms of the Creative Commons Attribution license (http://creativecommons.org/licenses/by/3.0/), which permits unlimited use, distribution and reproduction in any medium so long as the original work is properly cited.
doi:10.4108/eai.6-4-2018.155333
1. Introduction
The emergence of Software-Defined Networking (SDN) has brought along a wave of new technologies and developments in the field of networking with hopes
of dealing with network resources more efficiently [1].
SDN allows for both flexibility and adaptability by separating the control and data planes in a network
environment by virtualizing network hardware [2][3].
Through the programmablity features of SDN, handling
data transfer between hosts become more efficient. The
idea is to connect hosts through the use of virtual switches and virtual controllers that can be used to automate network functions programmatically. Our research seeks to develop an SDN system that uses metric-based analysis to virtually and automatically slice our network. These virtual slices will group hosts
based on network activity aiming for efficient use of
∗
Corresponding author. Email:[email protected]
network resources. Our goal, by dynamically slicing the network based on metrics such as link utilization and packet drop rate, is to create an intelligent and adaptable network design that outperforms traditional methods.
The remainder of this paper is organized as follows:
We will discuss the related work in Section2followed
by our motivations and contributions in Section 3.
Our problem statement is outlined in Section 4. Our
proposed smart and adaptable network design (SAND)
is presented and discussed in Section5followed by our
analysis and performance evaluation in Section 6. We
will summarize and conclude this paper in Section7.
2. Related Work
Several solutions have been proposed recently with the
aim on providing an efficient technique to balance the
load on the network. Ghaffarinejadet. al.in [4] provided
an SDN-based implementation of a load balancing scheme, which uses the flexibility of Openflow to
equally distribute the workload across the network
servers. The authors in [5] proposed a cloud-based
solution that focuses on equal distribution of the work over the network. The authors showcased both static and dynamic load balancing methods stating that dynamic load balancing performs better due to increased adaptability. We, in this work, present a smart and dynamic scheme based on network metrics
to offer a more dynamic solution to load balancing
by automating network decisions based on the current state of the network.
In [6], Cardellini et. al. presented a load balancing
scheme, which consists of spreading network load across multiple web servers using a variety of methods such as client-based and DNS-based approaches. This
approach does offer a solution to handle large flows
of traffic at a macro level, but it fails to address the
flexibility needed to survive in the current data climate. The solution also has a high entry cost due to the need for multiple web servers to achieve optimal load balancing. Our proposed scheme in contrast allows itself to be implemented in a variety of scenarios at low cost. The idea of virtually slicing a network using SDN technologies seeks to allow multiple tenants to
occupy one physical network [7]. Our proposed scheme
will use automate traffic pattern recognition to virtually
slice the network, in order to create a dynamic network environment that can support the use of the network
resources more efficiently.
3. Motivations
With many solutions focusing on balancing the load in the network, we observed that expensive hardware-based load balancing may be out of many customers’
budget, while SDN based load balancing offers greater
utility at a lower cost.
Our main focus in this research is to develop a network that is able to smartly handle network
traffic by creating an adoptable network that is
capable of automatically coping with different changes
in network traffic. We observed that allowing the
network to automatically measure the network traffic
by recognizing traffic patterns through monitoring
the network activities will tailor the network to any
evolving traffic needs. Also, with this technique, we can
create a more adaptable network that is able to auto
slice itself to manage network traffic more efficiently,
reduce the load on the controller, and act as a cheaper alternative to expensive hardware-based load balancing
solutions [8]. Besides that, we observed that balancing
the network traffic evenly across network’s resources
creates congested areas and might prevent the network
from handling more traffic, therefore, we decided to
consider link utilization while balancing the load in
the network to ensure that traffic flows are routed
efficiently and avoid creating small bandwidth holes,
where the links have small remaining unused space and
are not able to handle any more traffic.
We summarize our contributions as the following:
• Develop a dynamic traffic pattern analysis
technique that will form a base for our network slicing.
• Identify the common network patterns based on hosts communication and interactions.
• Develop a dynamic and adaptable networking design through auto slicing to achieve our main network resource utilization and use the network
resources more efficiently.
4. Problem Statement
The main issues with current load balancing solutions are the high costs and low flexibility and scalability. In our current technological environment, networks must be able to rapidly adapt to new changes and threats that may be introduced. Our research seeks to solve these issues by implementing an SDN based scheme that can
dynamically adapt to network changes and traffic rates.
The following definitions are used throughout our research:
Definition 1.A virtual switch is a software-based implementation of a hardware switch in a network. It
often serves as a node to route traffic between hosts on
a network. 2
Definition 2.A virtual controller is a software-based implementation of a hardware controller in a network. A controller often serves as a primary point of control
that can designate work to network switches. 2
Definition 3.Anetwork linkis a route between any two virtual switches that allows for the transmission of
traffic. 2
Definition 4.A flow is defined by the source host (src),
the destination host (dst) and the requested bandwidth
(Breq), which is defined by the amount of traffic being
generated during the flow. 2
Definition 5.APath(Pathsrc−dst) is defined by the set of
switches that form a path from the source host (src) to
the destination host (dst). 2
Definition 6.AResidual bandwidth(Tres) is the
remain-ing unused bandwidth on the network link, which is
given in Eq. 4.1, where Tmax is the full bandwidth
capacity of the network link, andTcur is the bandwidth
amount being used by the current flow. 2
Definition 7.A flow collision is the event where two
large traffic flows are routed through the same network
link which does not have the available bandwidth to
accommodate the flows. 2
OurSmart and Adaptable Network Design (SAND)
problem can be stated as:Given a bi-connected network
topology, our design seeks to create a dynamic load balancing scheme that smartly routes traffic flows by virtually slicing the network based on common traffic flows with the goal to minimize packet loss and maximize link utilization while minimizing the load on the controller.
5. Design and Implementation
OpenFlow Switch (S1)
OpenFlow Switch (S2)
OpenFlow Switch (S4) OpenFlow
Switch (S3) FloodLight Controller
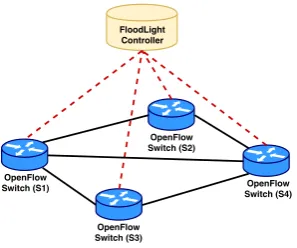
Figure 1. Biconnected Topology
The core idea of our research is to design a system that works with SDN to achieve dynamic resource utilization through virtual slicing. In order to achieve this we first designed a standard topology for testing that is at least bi-connected. This allows the formation
of alternate routing paths when rerouting traffic flows.
Fig. 1 shows the topology we will use throughout
our discussion. Note that, our proposed design is not topology dependent and scales as needed by the network.
Once the OpenFlow switches are identified in the network, a pulling system is used to periodically
retrieve network metrics to identify the traffic patterns.
The metrics we gather consist of link utilization, network utilization, packet rate, bit rate, throughput, and packet loss.
For our evaluation, we will introduce three traffic
routing systems; First, we will present the Floodlight’s default forwarding system as a baseline for our comparison. Next, we will introduce the reactive based
load balancing system presented in [5][9]. Finally we
will introduce our smart networking design system that
uses virtual slicing to make efficient use of the network.
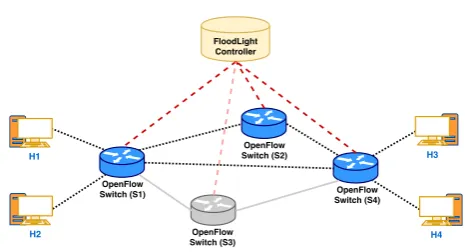
5.1. Floodlight Forwarding
The Floodlight forwarding algorithm offers a routing
system that finds a route between any two switches
by always choosing the shortest available path [10].
An example of the floodlight forwarding scheme is
illustrated in Fig. 2. It can be seen that no matter
which hosts connected to S1 are transmitting to hosts
connected to S4, the Floodlight routes traffic from S1
toS4(highlighted with blue color) down the same link
due to it is being the shortest available path (depicted with dotted lines). In this scenario if the link cannot
accommodate the amount of traffic produced by both
traffic flows packet loss will occur.
OpenFlow Switch (S1)
OpenFlow Switch (S2)
OpenFlow Switch (S4) OpenFlow
Switch (S3) FloodLight Controller
H1 H3
H2 H4
Figure 2. Floodlight Forwarding
5.2. Reactive Load Balancing
The reactive load balancing algorithm offers a routing
scheme that routes new flows down the shortest
available path [5]. The difference between the reactive
and Floodlight algorithms is that when a link reaches a predetermined utilization cap the reactive algorithm will then reroute the flows to be evenly distributed throughout the network. This in fact avoids major
packet loss, but does not attempt to efficiently use
network links. An illustration of this scheme is given
in Fig. 3. For instance, let us assume that host (H1) is
sending to host (H4), and host (H2) is sending to host
(H3), the reactive algorithm will reroute both traffic
flows fromS1toS4when the link cannot accommodate
both of them (depicted by the dashed lines and blue highlighted switches). This in fact avoids major packet
loss, but does not attempt to efficiently use network
links.
5.3. SAND: Smart and Adaptable Network Design
Our smart and adaptable network design (SAND)
begins with aninitialization phasethat initializes the
controller (Algorithm1). The controller will listen for
OpenFlow switch connections on the network and find all available paths between each set of switches. This produces an ordered list of routes based on shortest
path (Algorithm 1: Lines1 - 3). The final step in the
initialization phase is to setup the flow table entry (FTE)
(see table 1) at the switches which will be based on
OpenFlow Switch (S1)
OpenFlow Switch (S2)
OpenFlow Switch (S4) OpenFlow
Switch (S3) FloodLight Controller
H1 H3
H2 H4
Figure 3. Reactive Load Balancing
network. With these flow entries we will setup different
thresholds at which rerouting will be initiated.
As we are aiming to slice the network and utilize
the resources more efficiently, we will define the link
utilization [LU] as the current consumed throughput
of a link [Tcur] divided by the maximum available
throughput of the link [Tmax] (Eq.5.1).
LU = Tcur
Tmax
(5.1)
With that, we also can define thenetwork utilization
[NU] as the summation of all current link throughput
[Tcur] divided by the max possible throughput across
the network [Nmax] (Eq.5.2).
NU=
P
Tcur
Nmax
(5.2)
The flow table entry (FTE) at each switch will be checked on whether there was any previous entries.
If found, the utilization threshold (threshi) will be set
based on the previous traffic data requirement (Tcur),
which is defined by the amount of required throughput that was consumed to satisfy that communication. This will allow us to allocate specific portion of the network that is being used and will lead to the creation of virtual
slices in the network. If no prior traffic data exists on the
OpenFlow switches, then all link utilization thresholds will be equal across all links.
Our SAND design starts with the initialization phase
(Algorithm1). An (available paths) set will be created
to store all the available paths between the network switches, which will define the network topology and cover any future updates such as new available paths
or in case of any paths failure (Algorithm 1 - Line
1). Another set (available links) will be maintained to
contain all the available network links that will be used to form paths between sources and destinations based
on the network flows and requests (Algorithm1- Line
2). A polling interval for network statistics collection
will be defined, which will allow the monitoring of the network and cover any updates happen to the network
Table 1. Switch’s flow table entry (FTE)
Flow ID src dst in out T Dur
ID x y Si Sj Tcur TTL
ID y w Si Sk Tcur TTL
that will drive the rest of the SAND design (Algorithm
1- Line3).
Algorithm 1 - SAND:Initialization phase
1: AvailPaths← ∅ 2: AvailLinks← ∅
3: Define pulling interval:I ←∆;
4: Prevf low← ∅
5: Set the controller (C) to listen for connections;
6: foreach switch (Si) connected toCdo
7: Assign switch ID
8: Identify available port(s)
9: end for
10: foreach switch (Si)do
11: AvailPaths←available path(s) to other switches 12: setTcur= 0
13: end for
We will keep track of all the flows coming and
leaving the network through thePrevf low set in which
we will compare and update the network to make it
self intelligent and be able to adopt based on the traffic
being supplied to the network (Algorithm1- Line 4).
At the initial stages of the network, the controller will communicate with the switches to realize the topology and maintain the set of all available paths which will drive the network resource utilization in the rest of the
design (Algorithm1- Lines5-13).
T LL= Breq
Drate
+β (5.3)
Tcur = (Tcur+|Breq−Tcur|)∗α (5.4)
After finishing with the initialization phase, we will
move to the execution phase, which actively identify
the traffic patterns through monitoring the network
activities and building initial slices (Algorithm2).
We start by accepting flows in the network, which are
defined by the source hostsrc, destination hostdst, and
the requested bandwidthBreq. Since we already pulled
the list of available paths (Algorithm1- Line11) in the
network, we can simply identify the path that will be
used to support this flow (Pathsrc−dst). With that, we can
start the process of updating the flow tables for all the
switches within thePathsrc−dst.
For each coming flow we need to check whether this flow was previously appeared in the network and it is
Algorithm 2 - SAND:Execution phase
1: foreachf lowsrc−dstdo
2: foreach switch (Si)∈pathsrc−dstdo
3: iff lowsrc−dst∈Prevf lowthen
4: ifTcur ≤Breqthen
5: update FTE withT as given in Eq.5.4
6: end if
7: else ifTres≥Breqthen
8: Prevf low←f lowsrc−dst
9: Add FTE and setT as given in Eq.5.4
10: else
11: Go to Algorithm3
12: end if
13: end for
14: end for
15: Go to Algorithm4
expired for that flow), Algorithm2 - Lines(3-13). If the flow is still alive and the current threshold is less the the requested bandwidth, then we need to update the flow table entry with a new threshold as given in Eq.
5.4, otherwise, we will go through the updating phase
(Algorithm3). If this is a new flow and have never been
identified previously, we will pull the best path from the AvailPaths set and assign it as a path for the flow as long as the residual bandwidth on the path’s links satisfies the requested bandwidth, otherwise, we will go
through the updating phase (Algorithm3).
Algorithm 3 - SAND:Updating phase
1: foreach network linke∈AvailLinksdo
2: iferes≤Breqthen
3: SL←e
4: end if
5: end for
6: from all network links in Succlinks find a path
pathsrc−dst betweensrcanddst
7: AvailPaths←pathsrc−dst
8: foreach switch (Si)∈pathsrc−dstdo
9: update FTE withT as given in Eq.5.4
10: end for
If the flow was not previously identified in the
Prevf low set, then we will revisit the network links to
find a best path that can support this flow (Algorithm
3). We will start by pulling all the network links form
the AvailLinks set, and check the residual bandwidth available on these links. If a link cannot support the flow request, due to unavailability of enough bandwidth, then the link will be excluded, otherwise it
will be added to the successful links (SL) set (Algorithm
3- Lines (1-5).
From all the links in the successful links set, we will find a path that can support the flow and add that path
to the AvailPaths set (Algorithm 3 - Lines (6-7). With
that, the last step will be to update the flow entries for the switches within the path to accommodate the
changes in the network paths ((Algorithm3- Lines (8
-10).
Algorithm 4 - SAND:Re-engineering phase
1: foreachflowij∈Prevf lowdo
2: Si ←Switch connected to sourcei
3: Sj←Switch connected to sourcej
4: Currf low←flowij 5: Currpath←pathSi−Sj
6: forallPathsSi−Sj ∈AvailPathsdo
7: Sort paths based onTresin ascending order
8: ifTres≥Breqthen
9: Assign this to be the path for this flow
10: update FTE withTas given in Eq.5.4
11: end if
12: end for
13: end for
After assigning paths for the network flow, our design will go through the process of re-engineering and reorganizing the flows in the network to define common flows, build virtual slices and utilize the network
resources more efficiently (Algorithm4). The idea here
is to look into the flows that are available in the network
and reorganize them in an efficient way taking into
consideration the links capacity, by switching the flows
to different paths to utilize the network capacity more
efficiently, and help the network to handle more future
traffic with a lower drop rates.
We will start by looking into each flow, and identify
the first switch (Si) that is connected to the source
host of the flow and the last switch (Sj) that is directly
connected to the destination host (Algorithm4- Lines
1-5). Later, we will take the paths between Si and Sj
that are currently identified in the AvailPaths set and
sort them in ascending order based on the residual bandwidth, and check if the requested bandwidth can be satisfied by the residual bandwidth, then the flow will be routed and the flow table entity for all the switches in the new path will be updated accordingly
(Algorithm4- Lines6-12).
We, with our smart, dynamic and adaptable design (SAND), can reserve link capacity for common network flows between hosts, while routing smaller network
flows to fill in utilization gaps. In Fig. 4 we can see
an example of how our algorithm slices the network
based on prior traffic flows. In this scenario since hosts
H1 and H3 commonly use a large portion of the link
utilization betweenS1andS4, we can reserve the space
for future routing. The benefit of this is since we know an approximate amount of link utilization that can be
Table 2. Evaluation Flows
Flow 1 (2 hosts)
Flow 2 (4 hosts)
Flow 3 (6 hosts)
Flow 4 (8 hosts)
Hosts Range
(Mbps)
Range (Mbps)
Range (Mbps)
Range (Mbps)
H1 2 - 4 4 - 6 6 - 8 6 - 8
H2 4 - 6 4 - 6 6 - 8 6 - 8
H3 2 - 4 4 - 6 4 - 6
H4 2 - 4 4 - 6 4 - 6
H5 2 - 4 2 - 4
H6 2 - 4 2 - 4
H7 2 - 4
H8 2 - 4
fill any gaps in link utilization, which allows us to leave
more free links to accommodate future traffic flows in
the network.
OpenFlow Switch (S1)
OpenFlow Switch (S2)
OpenFlow Switch (S4) OpenFlow
Switch (S3) FloodLight Controller
H2 H1
H4 H3
Figure 4. Our Smart Load Balancing
6. Analysis and Performance Evaluation
The foundation of this research uses SDN technologies to provide the functionality needed to implement solutions to dynamic load balancing. At the heart of software-defined networking is the functionality between the virtual controllers and virtual switches. For this research a Floodlight controller was used
[10], along with OpenFlow switches to structure the
topology of our network. The OpenFlow switches share direct connections with the Floodlight controller. In order to benchmark our network the network simulator
Mininet was used [11], along with the Distributed
Internet Traffic Generator (D-ITG) [12] to allow hosts
to populate the network with multiple types of traffic.
To illustrate the performance of our scheme, we
implemented our solution (denoted by Smart in the
figures), and compared it with the default Floodlight
forwarding scheme (denoted byNormalin the figures)
and the reactive load balancing scheme in [4][5]
(denoted by Reactive in the figures). To perform
our experiments, we considered the network topology
presented in Fig.5. All links in our test network have a
maximum throughput of 9.89Mbps.
Figure 5. Test network architecture - Mininet
For our evaluation purposes, we defined four test
cases consisting of different flows that simulate traffic
being transmitted on the network for ten minutes as
shown in Table 2. In each case we set each host to
transmit data at a set rate with an average deviation of
1Mbps. The deviation allows to simulate the instability
in the throughput in the network. We considered flows with 2, 4, 6, and 8 hosts with each Openflow switch
containing two hosts as shown in Fig.5.
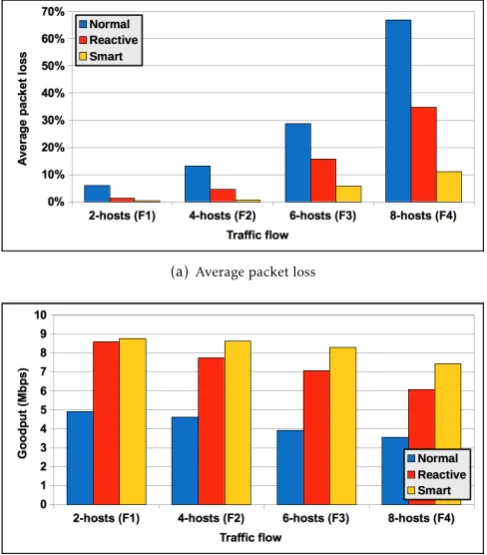
(a)Average packet loss
(b)Average goodput
Figure 6. Network performance
To show the performance of our proposed scheme compared to previous schemes, we considered the
as the amount of packets received at the destination host compared to the amount sent from the source
host. Our results are presented in Fig. 6(a). It can be
seen across all tests that our smart design outperforms previous schemes, which is attributed to our scheme’s
ability to use network links efficiently across the
network, thus allowing the network to handle more traffic efficiently.
Our second performance evaluation metric is the
Goodput, which is defined as the amount of network throughput that resulted in successful transmission.
Our results are presented in Fig.6(b). Compared to the
previous schemes, it can be seen that we were able to avoid drops in the goodput due to high link congestion, by dynamically slicing the network and allowing the reserved links to transmit data uninterrupted.
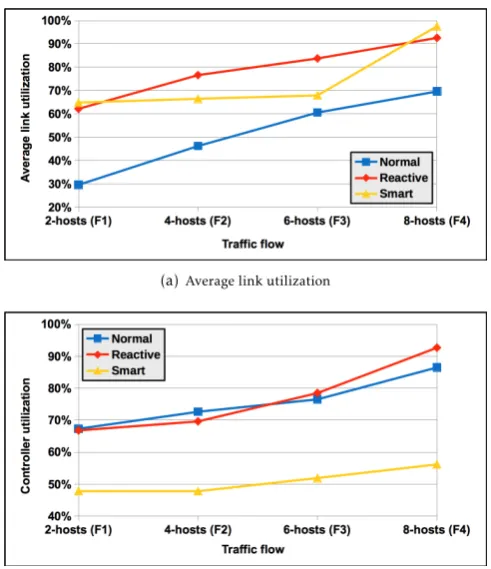
(a)Average link utilization
(b)Average controller utilization
Figure 7. Network resource utilization
To show the efficiency of network resource
utiliza-tion, we considered theAverage link utilizationas our
third performance evaluation metric, which is defined as the current consumed throughput compared to the
maximum throughput for a link (See Fig.7(a)). It can
be seen that our smart scheme outperforms the reactive scheme by only utilizing links when necessary. For instance, in Flow 4 with 8 hosts, compared to the Floodlight and reactive schemes, it can be seen that our
scheme uses the network’s links more efficiently which
resulted in maintaining more unused links’ capacity to
accommodate more requests and reduce the packet loss rate.
Our fourth performance evaluation metric is the
Con-troller utilization, which is defined as a combination of controller memory usage along with the amount of hits/requests the controller has to process during the test in which it will have to update the flows entries.
Our results in Fig. 7(b) shows that, on average, our
proposed schemes is able to produce less load on the controller compared to that with the other schemes. This is due to the initial virtual slicing that is done to the network. Since the reservations are already in place the Openflow switches can rely less on the controller for routing decisions. It can be also seen that both the Floodlight and reactive algorithm’s controller usage scales heavily with the number of hosts involved.
7. Conclusion
In this work, we presented a smart, dynamic and adaptable network design (SAND) that is able to
effectively mitigate large traffic flow while minimizing
packet loss and maximizing goodput. By relying on the current state of the network we were able to automate the process of network decisions involving routing. In comparison to other related work, we have shown that our dynamic load balancing scheme has increased scalability and adaptability to network changes. We have shown that our research is a step in the direction of building more reliable and resilient networks that are able to adapt and scale based on the evolving data climate.
Acknowledgements. The authors acknowledge the sup-port of the University of Tennessee at Chattanooga. Research reported in this publication was supported by the 2018 Center of Excellence for Applied Computa-tional Science competition.
References
[1] Cisco. The zettabyte era: Trends and analysis. Cisco, page 7, June 2017.
[2] D. Kreutz, F. M. V. Ramos, P. E. VerÃŋssimo, C. E. Rothenberg, S. Azodolmolky, and S. Uhlig. Software-defined networking: A comprehensive survey. Proceed-ings of the IEEE, 103(1):14–76, Jan 2015.
[3] T. Wang, F. Liu, and H. Xu. An efficient online algorithm for dynamic sdn controller assignment in data center networks. IEEE/ACM Transactions on Networking, PP(99):1–14, 2017.
[4] A. Ghaffarinejad. Comparing a Commercial and an SDN-based Load Balancer in a Campus Network. 2015.
[5] Pabitra Mohan Khilar Padhy, Ram. Load balancing in cloud computing. International Journal of Recent Trends in Engineering and Research, pages 260–267, 2017. [6] V. Cardellini, M. Colajanni, and P. S. Yu. Dynamic
[7] Zdravko Bozakov and Panagiotis Papadimitriou. Autoslice: Automated and scalable slicing for software-defined networks. In Proceedings of the 2012 ACM Conference on CoNEXT Student Workshop, CoNEXT Student ’12, pages 3–4, New York, NY, USA, 2012. ACM. [8] Wolfgang Braun and Michael Menth. Software-defined networking using openflow: Protocols, applications and architectural design choices. Future Internet, 6(2):302– 336, 2014.
[9] Hong Zhong. An efficient sdn load balancing scheme based on variance analysis for massive mobile users. Mobile Information Systems, page 9, 2015.
[10] Floodlight. http://www.projectfloodlight.org/floodlight/, 2017.
[11] Mininet. http://mininet.org/, 2017.