
DOI 10.1186/s13408-016-0042-0
R E S E A R C H Open Access
A Theoretical Study on the Role of Astrocytic Activity
in Neuronal Hyperexcitability by a Novel Neuron-Glia
Mass Model
Aurélie Garnier1·Alexandre Vidal2· Habib Benali1
Received: 28 January 2016 / Accepted: 26 November 2016 /
© The Author(s) 2016. This article is distributed under the terms of the Creative Commons Attribution 4.0 International License (http://creativecommons.org/licenses/by/4.0/), which permits unrestricted use, distribution, and reproduction in any medium, provided you give appropriate credit to the original author(s) and the source, provide a link to the Creative Commons license, and indicate if changes were made.
Abstract Recent experimental evidence on the clustering of glutamate and GABA transporters on astrocytic processes surrounding synaptic terminals pose the question of the functional relevance of the astrocytes in the regulation of neural activity. In this perspective, we introduce a new computational model that embeds recent findings on neuron–astrocyte coupling at the mesoscopic scale intra- and inter-layer local neural circuits. The model consists of a mass model for the neural compartment and an as-trocyte compartment which controls dynamics of extracellular glutamate and GABA concentrations. By arguments based on bifurcation theory, we use the model to study the impact of deficiency of astrocytic glutamate and GABA uptakes on neural activ-ity. While deficient astrocytic GABA uptake naturally results in increased neuronal inhibition, which in turn results in a decreased neuronal firing, deficient glutamate uptake by astrocytes may either decrease or increase neuronal firing either transiently or permanently. Given the relevance of neuronal hyperexcitability (or lack thereof) in the brain pathophysiology, we provide biophysical conditions for the onset iden-tifying different physiologically relevant regimes of operation for astrocytic uptake transporters.
Keywords ODE model in neuroscience·Qualitative analysis of dynamical systems·Bifurcations·Neuron-astrocyte interactions·GABAergic and
B
A. VidalA. Garnier
H. Benali
1 Laboratoire d’Imagerie Biomédicale (LIB), Sorbonne Universités, UPMC Univ Paris 06, CNRS, INSERM, Paris, 75013, France
glutamatergic neurotransmissions·Excitability modulation·Neuronal hyperexcitability
1 Introduction
Neural activity in the brain results from an interplay between neuronal excitation and inhibition and is subjected to the supply of nutrients by the cerebral blood flow. At the subcellular (microscopic) scale, neural activity propagates through axons and, mostly, chemical synapses which transmit electrical signals from one (presynaptic) neuron to another (postsynaptic) one, by release of neurotransmitters, like glutamate and GABA for example, in the extracellular space (or synaptic cleft) between pre- and postsynaptic terminals [1,2]. These neurotransmitters diffuse in the synaptic cleft, binding and activating postsynaptic receptors, which can regulate the depolarization state of the postsynaptic neuron, triggering firing thereof. In parallel, spillout of these neurotransmitters from the synaptic cleft to the perisynaptic extracellular space may also activate receptors and transporters on perisynaptic astrocytic processes, with the potential to trigger glutamate release by the latter glutamate into the extra-synaptic space [3,4].
particular, we benefit from the bifurcation analysis of the Neural Mass Model (NMM) performed in [29] to characterize in this study, the impact of astrocyte on neuronal activity. More exactly, our focus for the present study is on Noise Induced Spiking (NIS), which is characterized by quiescent phases of neuronal activity separated by isolated spikes resulting from synchronous neuronal activations. NIS typically mim-ics local field potentials (LFP) recordings obtained during pre-ictal phases of epilepsy as shown in [29] and may thus be used as a predictor for the insurgence of neuronal hyperexcitability.
A novel computational model based on the neural mass approach that focuses on astrocyte dynamics at the mesoscopic scale has recently been proposed [30]. This model links the LFP signal representative of neural activity measured by intracranial EEG to the cerebral blood flow dynamics measured by laser doppler recordings of astrocyte activity. Although this model incorporates astrocytic recycling of glutamate and GABA it does not take into account the modulation of neuronal excitability by extracellular neurotransmitter concentrations. In the following, we present an exten-sion of this model that includes such modulation in the context of bilateral neuron– astrocyte interactions. In particular, we pursue an analytical characterization of the impact of the key model parameters of astrocytic activity on neuronal hyperexcitabil-ity.
Analytical investigation of our model allows us to make several predictions on the effect of deficiencies of GABA and glutamate astrocytic uptake on neural activity. In particular, we identify three possible neural regimes in the presence of deficiency of astrocytic glutamate uptake, respectively, consistent with reduced activity, tran-sient or permanent hyperexcitability. Such a spectrum of responses is substantiated by the analysis of the dynamical structure of the model, which allows us to derive ex-plicit conditions on the parameters involved in the astrocytic feedback corresponding to each type of regime and put emphasis on the delicate balance between neuronal excitation and inhibition and its sensitivity to extracellular concentrations of neuro-transmitters.
2 Bilaterally Coupled Neuron–Astrocyte Mass Modeling
Fig. 1 Scheme of neurotransmission mechanisms and neurotransmitter uptake. Red circles: glutamatergic
vesicles. Blue circles: GABAergic vesicles. Red arrows: exchanges of glutamate. Blue arrows: exchanges of GABA. A: astrocytes
our neuron–astrocyte mass model. Hence, feedbacks from the glial compartment onto the neural dynamics stand for the modulations of excitability (or more precisely the activation threshold of each population) by the extracellular concentration of each neurotransmitters.
In the following, we set to describe our mass modeling approach to account for the effect of extracellular glutamate and GABA concentrations on neural activity. With this aim, we start by recalling the NMM setup originally studied in [29,30], its properties and time-series pattern that it produces. We then introduce our modeling arguments to develop bilateral coupling between the astrocytic and neuronal com-partments of the model. Finally, we leverage on the novel dynamical features brought forth by inclusion of this bilateral coupling with respect to the original model in [29,30].
2.1 Neural Mass Model
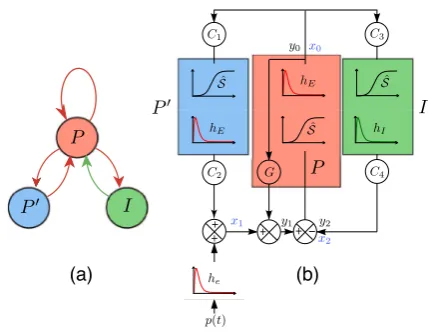
pyra-Fig. 2 Two schematic representations of the NMM with double excitatory feedbacks.P: main popula-tion of pyramidal neurons.I: interneuron population.P: secondary population of pyramidal neurons.
Red (resp. green) arrows in (a): excitatory (resp. inhibitory) interactions. BoxhE(resp.hI): second-order process converting action potentials into excitatory (resp. inhibitory) postsynaptic potential. BoxSˆ: pro-cess converting average membrane potential into average action potential density discharge by neurons of populationsP,P, andI, respectively.Ci for 1≤i≤4: coupling gain parameters depending on the maximum numberCof synaptic connections between two populations.G: direct feedback coupling gain.
p(t ): external input.y0,y1,y2: state variables.x0,x1,x2: intermediary variables
midal neuronsPinteracting withP through synaptic connections. Both direct and indirect approaches model the excitatory synaptic interaction between neighbor prin-cipal cells, usually named collateral excitation. From the modeling perspective, we cannot privilege one type of feedback over the other, since both these couplings are physiologically relevant and can co-exist, a very local one and a more or less dis-tant one. The NMM used in this article, proposed and studied in [29], includes both feedback circuits. Hence, it includes three feedback loops on populationP activity: an inhibitory feedback through the interneuron populationI, a direct excitatory feed-back of P onto itself (referred to as “direct feedback”) and an indirect excitatory feedback (referred to as “indirect feedback”) involving the populationP(Fig.2(a)). The conversion process of average pulse density into excitatory and inhibitory postsynaptic potential, respectively, are based on the following α-functions intro-duced by Van Rotterdam et al. [31]:
hE(t )=Aat e−at,
hI(t )=Bbt e−bt.
These are fundamental solutions (also known as Green’s functions) for the differential operatorsFEandFI, respectively, defined by
FE(hE)=
1 A
1 a
d2hE dt2 +2h
E+ahE
, (1a)
FI(hI)=
1 B
1 b
d2hI
dt2 +2hI+bhI
In this framework, the parameterA(resp.B) stands for the average excitatory (resp. inhibitory) synaptic gain and tunes the amplitude of excitatory (resp. inhibitory) post-synaptic potentials. Additionally, 1a (resp. 1b) represents the time constant of ex-citatory (resp. inhibitory) postsynaptic potentials representative of the kinetics of synaptic connections and delays introduced by circuitry of the dendritic tree [31–
33]. Following Freeman’s work [32], the functions converting the average membrane potential into an average pulse density can be approximated by sigmoids of the type
S(x, xth, rsl)=
1 1+ersl(xth−x).
Yet, for the sake of compactness of the NMM presentation, we introduce an auxiliary parameterization after [32]:
ˆ
S(x, v)=2e0S(x, v, r)=
2e0
1+er(v−x),
where 2e0 represents the maximum discharge rate,v the excitability threshold and
rthe sigmoid slope at the inflection point. Finally, the NMM receives an excitatory inputp(t ) standing for the action on populationP of neural populations in other areas through long-range synaptic connections. This input can be either deterministic or stochastic, and in this case, being modeled for example by a Gaussian process.
Now we can write the dynamics for the intermediary variablesx0,x1andx2, which
represent the outputs of the populationP, the sum of populationP output and the external inputp(t ), and the populationI, respectively (Fig.2(b)):
d2x0
dt2 =AaSˆ(x1+Gx0−x2, vP)−2a
dx0
dt −a
2x
0, (2a)
d2x1
dt2 =AaC2Sˆ(C1x0, vP)−2a
dx1
dt −a
2x
1+Aap(t ), (2b)
d2x2
dt2 =BbC4Sˆ(C3x0, vI)−2b
dx2
dt −b
2x
2. (2c)
ParametersCi (i∈ {1,2,3,4}) represent the average number of synapses between
two populations. Following [34], eachCi is proportional to the maximum numberC
of synapses between two populations. The excitation ofP by its own output, resulting from the intra-population synaptic connections, is weighted by the coupling gainG.
For the sake of comparison, we use a variable change to obtain the same state variables as in the Jansen–Rit model [35]: the excitatory output (y0=x0) and the
excitatory (y1=x1+Gx0) and inhibitory (y2=x2) inputs of the main populationP.
The output y0 acts on the secondary pyramidal neuron population P and on the
interneuron populationI. To analyze the model, we write the dynamics of the state variablesy0,y1, andy2as a system of first order differential equations:
dy0
dt =y3, (3a)
dy1
dy2
dt =y5, (3c)
dy3
dt =AaS(yˆ 1−y2, vP)−2ay3−a
2y
0, (3d)
dy4
dt =AaC2Sˆ(C1y0, vP)+AaGSˆ(y1−y2, vP)
−2ay4−a2y1+Aap(t ), (3e)
dy5
dt =BbC4Sˆ(C3y0, vI)−2by5−b
2y
2. (3f)
In this study, we consider the local field potential LFP(t )=y1(t )−y2(t )[33] as the
main output of the model. It is important to note that, generally, studies of neural mass models, such as Jansen–Rit model, only considered the case with the same constant excitability thresholds for all populations, i.e.
vP =vP=vI=v0.
2.2 Astrocyte Model: Glutamate and GABA Concentration Dynamics
For reproducing the astrocyte activity, we use the model introduced in [30]. It focuses on the dynamics of glutamate and GABA concentrations, which are the main neuro-transmitters of the central nervous system. In [30], the neuron–astrocyte coupling is feedforward: the astrocyte dynamics is driven by the neural activity, generated by the Jansen–Rit model, but it does not impact the neural compartment. The model considers the dynamics of glutamate and GABA concentrations, locally to the main populationP of pyramidal neurons, at different stages of the recycling mechanism. The local nature of this interaction implies that the firing rate of the secondary pop-ulationPof pyramidal neurons does not impact the astrocyte dynamics associated with the neighboring astrocytes of the main populationP. The mechanism is as fol-lows (Fig.3): excited pyramidal neurons (resp. interneurons) release glutamate (resp. GABA) in the extracellular space (synaptic cleft). Astrocytes and presynaptic neurons uptake the neurotransmitters. Astrocytes recycle or consume the neurotransmitters, while the presynaptic neurons capture them to complete their stock.
Following [30] the astrocyte compartment is built on the firing rate of the pyra-midal neuron population and the firing rate of the interneuron population. The state variables are (i)JG andJγ: the fluxes of glutamate and GABA from neurons to
ex-tracellular space, (ii)[Glu]eand[GABA]e: the neurotransmitter concentrations in the extracellular space, (iii)[Glu]aand[GABA]a: the quantity of neurotransmitters recy-cled and consumed by the astrocytes. The dynamics governingJGandJγ is driven
by second-order differential operators similar to those for synaptic transfer dynamics introduced in (1a)-(1b) [31,36], i.e.:
FG(hG)=
1 W
1 w1
d2hG dt2 +
w1+w2
w1
dhG
dt +w2hG
,
Fγ(hγ)=
1 Z
1 z1
d2hγ dt2 +
z1+z2
z1
dhγ dt +z2hγ
Fig. 3 Neuron-astrocyte model with astrocyte feedback.PandP: main and secondary populations of pyramidal neurons.I: interneuron population.p(t ): external input on populationP.[Glu]eand[GABA]e: glutamate and GABA extracellular concentrations.[Glu]aand[GABA]a: glutamate and GABA astrocyte concentrations. Red arrows:P→P,P→IandP→Pcouplings. Orange arrow:P→Pcoupling.
Green arrow:I→Pcoupling. Cyan arrows: glutamate and GABA release by populationsPandIinto extracellular space (fluxesJγenandJγ). Purple arrows: astrocyte and neural uptakes of neurotransmitters.
Red dashed arrows: glutamate feedbacks on populationsPandI. Brown dashed arrow: GABA feedback on populationP
Like for the synaptic transfer functions in (1a)-(1b), the parameterW (resp.Z) tunes the peak amplitude of glutamate (resp. GABA) concentrations and the param-etersw1andw2(resp.z1 andz2) tune the rise and decay times of glutamate (resp.
GABA) release transfer function. This dynamics is well suited to reproduce qualita-tive and quantitaqualita-tive properties of rise and decay of neurotransmitter concentrations as shown in [30].
Astrocytic uptake of glutamate and GABA from the extracellular space may be modeled by Michaelis–Menten kinetics [30], using the following function:
H(x, k)= x
x+k. (4)
The dynamics of the extracellular concentrations ([Glu]eand[GABA]e) result from neurotransmitter fluxesJG andJγ originating from synaptic release fluxes as just
described. Intracellular concentrations of glutamate and GABA in the astrocyte in-stead mirror uptake dynamics and a nonspecific first order (linear) kinetics degrada-tion [27].
To summarize, the feedforward model obtained by coupling the neural mass model defined by (3a)-(3f) with astrocytic dynamics introduced in [30] reads
d2y0
dt2 =AaSˆ(y1−y2, vP)−2a
dy0
dt −a
2y
d2y1
dt2 =AaC2Sˆ(C1y0, vP)+AaGSˆ(y1−y2, vP)
−2ady1 dt −a
2y
1+Aap(t ), (5b)
d2y2
dt2 =BbC4Sˆ(C3y0, vI)−2b
dy2
dt −b
2y
2, (5c)
d2JG
dt2 =W w1Sˆ(y1−y2, vP)−(w1+w2)
dJG
dt −w1w2JG, (5d) d[Glu]e
dt =JG−
VGae+VGneS[Glu]e, sg, rg
, (5e)
d[Glu]a
dt =V
ae
GS
[Glu]e, sg, rg
−VGc[Glu]a, (5f)
d2Jγ
dt2 =Zz1Sˆ(C3y0, vI)−(z1+z2)
dJγ
dt −z1z2Jγ, (5g)
d[GABA]e
dt =Jγ−V
ae
γ H
[GABA]e, Kγae−VγneH[GABA]e, Kγne, (5h) d[GABA]a
dt =V
ae
γ H
[GABA]e, Kγae−Vγc[GABA]a. (5i)
In the sigmoidal functions for[Glu]edynamics (5e), parametersVGaeandVGneare the maximum rates of glutamate uptakes by the astrocytes and the neurons, respectively, sg represents the activation threshold andrg the sigmoidal slope at the inflection
point. Parameters Vγae and Kγae (resp. Vγne and Kγne) in Eq. (5h) are, respectively, the maximum rate and concentration for astrocyte (resp. neural) GABA transporter. Finally,VGc andVγcare the glutamate and GABA degradation rates in astrocytes. We refer the reader to [30] for a detailed explanation of the dynamics.
System (5a)-(5i) is built as a feedforward coupling of the neural compartment onto the astrocyte one. Hence, in this model, the neural compartment is not impacted by the neurotransmitter concentrations in the extracellular space. As mentioned in the introduction, these concentrations have been proven to modulate the local neuron ex-citability and this feedback has been identified in recent studies [1] to be an essential mechanism of several pathologies triggered by astrocytic uptake deficiencies. Conse-quently, our aim is to include such feedback in the model in order to study the effects of different astrocyte dysfunctioning on the neuronal activity.
2.3 Astrocytic Feedback and Neuron–Astrocyte Mass Model
The concentrations of neurotransmitters in a synaptic cleft act on the excitability threshold of the postsynaptic neuron. In the neuron–astrocyte model (5a)-(5i) the al-teration of this neural excitability threshold can be reproduced by dynamical changes invP,vPandvI. In the following, we describe how we model the modulation of the
Extracellular concentrations of neurotransmitters have a thresholded impact on neural activity [1]. Precisely, on one hand, the impact of neurotransmitter concentra-tions on neural activity is implicitly taken into account in the neuronal compartment, thus the astrocyte feedback steps in only when the concentrations become larger than physiological ones. On the other hand, the postsynaptic neurons are saturated when these concentrations become too large and, consequently, the neural excitability re-mains bounded. As explained in the introduction, quantitative experimental data of the impact of neurotransmitter concentrations on neural excitability do not exist up to now. For fixing ideas, we consider sigmoidal functions to model the astrocyte feed-back on neural excitability which is a natural choice for aggregating the qualitative experimental knowledge. Yet the upcoming mathematical analysis can easily be ex-tended to any bounded increasing functions with a unique inflection point.
We introduce three sigmoidal functions to model the components of the astrocyte feedback:
(a) mPGS[Glu]e, vG, rG
for glutamate feedback on pyramidal neurons,
(b) mIGS[Glu]e, vG, rG
for glutamate feedback on interneurons,
(c) mγS
[GABA]e, vγ, rγ
for GABA feedback on pyramidal neurons.
Note that glutamate binding mechanisms are the same for both pyramidal neurons and interneurons since both cell types express the same type of transporters [10,37]. Thus, only parametersmPG and mIG representing the maximum coupling gains of the glutamate-dependent component of the astrocyte feedback discriminate between the coupling functionsmPGS([Glu]e, vG, rG)andmIGS([Glu]e, vG, rG), insofar as the
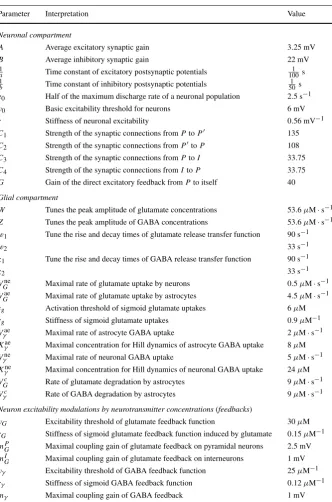
number of transporters is cell-specific and so is the ensuing uptake rate. Model pa-rameters are summarized in Table1and their values used in the simulations of this study were chosen to qualitatively reproduce typical physiological data.
We previously mentioned that astrocyte feedback acts on the excitability thresh-olds of neurons. More specifically, if there is an excess of neurotransmitter in a synapse from a neuron n1 of population N1 to a neuron n2 of population N2, the
extracellular concentration of neurotransmitter acts on the postsynaptic neuron n2by
changing its excitability threshold. In system (5a)-(5i) the excitability threshold of neurons, that is, a parameter at the single cell scale, does not appear explicitly. How-ever, when the excitability of the population N2neurons changes at the individual
scale, the number of neurons activated in this population by a given input changes as well and so does the output of this population. Following the mass approach, we scale this feature to the population, and, consequently, we choose to change parametervN2
in the equation corresponding to the output of population N2 since this parameter
represents a modulation of the threshold of the sigmoidal functionSˆ.
Let us now describe how we build the feedbacks on the dynamics of the neural compartment using the sigmoidal functions of the neurotransmitter concentrations. The dashed arrows in Fig.3illustrate these feedbacks. We need to consider separately each type of synapse in the NMM, and the variablesx0,x1, andx2for the feedbacks
Table 1 Descriptions and values of the neuron–astrocyte mass model parameters
Parameter Interpretation Value
Neuronal compartment
A Average excitatory synaptic gain 3.25 mV
B Average inhibitory synaptic gain 22 mV
1
a Time constant of excitatory postsynaptic potentials 1001 s 1
b Time constant of inhibitory postsynaptic potentials
1 50s
e0 Half of the maximum discharge rate of a neuronal population 2.5 s−1
v0 Basic excitability threshold for neurons 6 mV
r Stiffness of neuronal excitability 0.56 mV−1
C1 Strength of the synaptic connections fromPtoP 135
C2 Strength of the synaptic connections fromPtoP 108
C3 Strength of the synaptic connections fromPtoI 33.75
C4 Strength of the synaptic connections fromItoP 33.75
G Gain of the direct excitatory feedback fromPto itself 40
Glial compartment
W Tunes the peak amplitude of glutamate concentrations 53.6μM·s−1
Z Tunes the peak amplitude of GABA concentrations 53.6μM·s−1
w1 Tune the rise and decay times of glutamate release transfer function 90 s−1
w2 33 s−1
z1 Tune the rise and decay times of GABA release transfer function 90 s−1
z2 33 s−1
VGne Maximal rate of glutamate uptake by neurons 0.5μM·s−1
VGae Maximal rate of glutamate uptake by astrocytes 4.5μM·s−1
sg Activation threshold of sigmoid glutamate uptakes 6μM
rg Stiffness of sigmoid glutamate uptakes 0.9μM−1
Vγae Maximal rate of astrocyte GABA uptake 2μM·s−1
Kγae Maximal concentration for Hill dynamics of astrocyte GABA uptake 8μM
Vγne Maximal rate of neuronal GABA uptake 5μM·s−1
Kγne Maximal concentration for Hill dynamics of neuronal GABA uptake 24μM
VGc Rate of glutamate degradation by astrocytes 9μM·s−1
Vγc Rate of GABA degradation by astrocytes 9μM·s−1
Neuron excitability modulations by neurotransmitter concentrations (feedbacks)
vG Excitability threshold of glutamate feedback function 30μM
rG Stiffness of sigmoid glutamate feedback function induced by glutamate 0.15μM−1
mPG Maximal coupling gain of glutamate feedback on pyramidal neurons 2.5 mV
mIG Maximal coupling gain of glutamate feedback on interneurons 1 mV
vγ Excitability threshold of GABA feedback function 25μM−1
rγ Stiffness of sigmoid GABA feedback function 0.12μM−1
we detail the modulation of neural intermediary variables for each kind of synapse separately, then we gather these changes to specify the coupling terms reproducing the astrocyte feedback.
In the framework of the local neuron–astrocyte mass model, the astrocyte feedback does not impact the synaptic connections of typeP→P or P →P. As a matter of fact, the astrocyte compartment only takes into account neurotransmitters released locally by neurons of populationsP and I, whereas populationP is nonlocal to populationP. Hence, extracellular concentrations of neurotransmitters in the vicinity of P have no impact on the neuronal activity of P and the concentrations in the neighborhood ofP andIdo not influence the postsynaptic neurons of populationP. A synaptic connection of typeP →I concerns the variablex2. As shown in [1,
38], in the case of glutamate excess in the extracellular space, the postsynaptic neu-ron is more excitable. Consequently, more neuneu-rons are activated in the populationI. We model this mechanism at the mesoscopic scale by introducing a dependency of populationI excitability thresholdvI on the extracellular glutamate concentration
and set in Eq. (2c):
vI=v0−mIGS
[Glu]e, vG, rG
.
While experiments have evidenced impacts of extracellular glutamate concentra-tions on the excitability of GABAergic neurons [38], we lack experimental data and conclusions on the way GABA acts on the excitability of each subtypes of GABAer-gic neurons. In particular, observations raise the question of whether all subtypes are subject to mechanisms of GABA-mediated excitability modulation in the same way [39,40]. Since our model is not subtype-specific for the sake of compactness, we chose not to embed any GABA feedback on interneuron population dynamics.
On the one hand, a synaptic connection of typeI→P is concerned by extracel-lular concentrations of GABA since it involves GABAergic interneurons. In case of a GABA excess in the extracellular space, the inhibition of the postsynaptic neuron is strengthened (see e.g. [1]), i.e. less neurons are activated in populationP, which is translated in the NMM by an increase of the threshold of the sigmoidal term in the x0dynamics. On the other hand, a synaptic connection of typeP →P is impacted
by the extracellular concentration of glutamate implying a modulation of variable x0dynamics as well. In the case of an excess of glutamate in this kind of synapse,
the postsynaptic neuron is more excitable [1]. Hence, more neurons are activated in populationP which can be reproduced by a decrease in the threshold parameter ap-pearing in (3d). Gathering both modulations impacting the excitability of population P, we set in Eq. (3d)
vP=v0+mγS
[GABA]e, vγ, rγ
−mPGS[Glu]e, vG, rG
.
The new neuron–astrocyte mass model embedding the astrocyte feedback is ob-tained from model (5a)-(5i) by considering the dynamical entriesvI andvP
men-tioned above. Accordingly, the sigmoidal functions appearing in Eqs. (5a), (5b), (5c), (5d), and (5g) become
ˆ
S(y1−y2, vP)= ˆS
y1−y2, v0+mγS
[GABA]e, vγ, rγ
−mPGS[Glu]e, vG, rG
ˆ
S(C1y0, vP)= ˆS(C1y0, v0), ˆ
S(C3y0, vI)= ˆS
C3y0, v0−mIGS
[Glu]e, vG, rG
.
2.4 Bifurcation-Based Characterization of the Neural Activity: The Case of Noise-Induced Spiking
The behavior of NMMs can be deduced from the bifurcation diagram according to the valuep(t )=p considered as a parameter, as it has been performed in [28] on the Jansen–Rit model. In [29], we have classified the types of time-series patterns generated by model (3a)-(3f) and the associated bifurcation structures according to the strengths of the different excitatory inputs to populationP. Let us recall the bi-furcation diagram underlying the predominant type of generated time series, which we will consider in this article.
Model (3a)-(3f) has the following useful features [29]. First, for a fixed value of parameterp, they0value of a singular point suffices to have explicit expressions of all
the other components. Second, for a giveny0value, there exists a unique value ofp
such thaty0corresponds to a singular point. In other terms, the set of singular points
obtained for the different values ofp is a graph overy0. Hence, we can visualize
the shape of the singular point locus in the plane(p, y0): in the case presented here
(see top panel of Fig.4), this curve of singular points is S-shaped. In the following description, for a given bifurcation “X” according to parameterp, we denote bypX
the bifurcation value and, if the bifurcation involves a singular point, we denote by yXthe correspondingy0value.
Two saddle-node bifurcations SN1and SN2split the curve of singular points into
three branches. We name “lower branch”, “middle branch”, and “upper branch” the sets of singular points, respectively, satisfying y0< ySN1, ySN1 < y0< ySN2, and y0> ySN2. Singular points on the lower branch are stable (blue) and those on the
middle branch are unstable (cyan). Singular points on the upper branch are unstable (green) forp < pH1 and stable (blue) otherwise. Atp=pH1 the system undergoes a
supercritical Hopf bifurcation H1giving birth to a stable limit cycle forp < pH1that
persists untilp=pSN1 =pSNIC where it disappears by a saddle-node on invariant
circle (SNIC) bifurcation (dashed orange line). The existence of the SNIC bifurcation is essential because it implies the appearance of a large amplitude stable limit cycle with large period. Hence, according to the value ofp, the system alternates between oscillatory phases (forp > pSNIC) and quiescent phases (forp < pSNIC). In other
terms,pSNICplays the role of an activation threshold for the neural compartment.
This means that, given a constant inputp(t )= ¯psuch thatp < p¯ SNIC, we expect
Fig. 4 Bifurcation diagram according top(left) and associated LFP andy0time series (right). Blue
curves: stable singular points. Cyan (resp. green) curves: singular points with one (resp. two)
eigenval-ues with positive real parts. Black curves:y0extrema along stable limit cycles. Black points (SN1 and SN2): saddle-node bifurcations. Red point (H1): supercritical Hopf bifurcation. Dashed orange line: Sad-dle-Node on Invariant Circle (SNIC) bifurcation. Horizontal gray bar: confidence interval of the Gaussian variablep(t )used to generate the time series i.e.[ ¯p−σ,p¯+σ]wherep¯andσ are the mean and the variance of the associated normal distribution, respectively
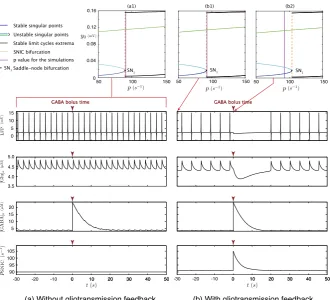
Fig. 5 Comparison of the effects of a GABA bolus on the feedforward and bilaterally coupled
neuron–as-trocyte mass models. Bifurcation diagrams according top(top panels) computed for the model without feedback for allt(a1) and for the model with feedback att=0 s (b1) andt=30 s (b2). Time series
(bot-tom panels) corresponding to LFP, glutamate and GABA extracellular concentrations and time variations
ofpSNICgenerated by the models without feedback (left) and with feedback (right). The purple lines on the bifurcation diagrams materialize the fixed value of inputp. The dark red arrows above each time series materialize the time of GABA bolus injection
we study the variations of the activity when the neural dynamics is altered by the surrounding activity, i.e. the astrocyte feedback.
2.5 NMM Dynamics: Example from GABA Injection
To illustrate the impact of the astrocytic feedback on neural excitability and intro-duce the dynamical tools that we are using in the remainder of the article, we set to study LFP dynamics generated by our model both with and without astrocytic feed-back, leveraging on the role of the SNIC bifurcation occurring atp=pSNICon the
emergence of different regimes of neuronal firing.
With this aim, we simulate injection of GABA (20 AU) into the extracellular space att=0. Assumingp(t )=ppSNIC(Fig.5, panels (a1) and (b1)). Either in the
NIS right after injection time. Nonetheless it may be noted that, in the presence of astrocytic feedback, even if extracellular GABA concentration is low—and the corre-sponding sigmoidal feedback is consequently very weak—this is sufficient to affect neural activity—as reflected by the difference in spike frequency between the two LFP time series.
In the time series generated by the model without feedback (left panels of Fig.5), the neural activity and the glutamate concentration dynamics remain unchanged (Fig. 5(a)) after the instantaneous increase of [GABA]e at t =0, which mimics GABA injection. In contrast, in the model with astrocyte feedback (right panels of Fig.5), the strong increase of [GABA]e halts neuronal activity, which, in turn re-duces synaptic release of glutamate. Once[GABA]e has become sufficiently low, neural activity re-emerges and both glutamate and GABA concentrations come back to their respective basal values, oscillating with neural activity.
These phenomena can be well accounted by arguments based on bifurcation anal-ysis (top panels of Fig.5). In the model without astrocytic feedback, neural dynam-ics is decoupled from astrocytic dynamdynam-ics. Hence, the bifurcation diagram of the NMM remains unchanged during all simulated time (Fig.5(a1)). In this fashion, the excitability thresholdpSNIC of the neural compartment is constant in time (Fig.5,
bottom panel). On the other hand, in the system with feedback,vP,vP andvI
de-pend on GABA and glutamate concentrations. Consequently, the bifurcation diagram for the neural compartment is time dependent, and so is the value ofpSNIC, which
changes along with the astrocytic variables. Thus, right after GABA injection,pSNIC
is larger than the input valuep(Fig.5(b2)), and becausepSNICplays the role of
ac-tivation threshold for the neural population, then as long as GABA concentration re-mains high, the neural population rere-mains quiescent. One may easily see by a simple algebraic calculation (not shown) that the astrocytic compartment admits a unique singular stable point for any neural state. Hence, starting from a high extracellular GABA concentration, this concentration decreases toward the attractive state slowly decreasingpSNIC, as shown in the bottom panel of Fig.5, case (b). Once, GABA is
low enough,pSNICbecomes smaller thanp, and the system oscillates again.
This analysis shows how the model with feedback can take into account changes in glutamate and GABA dynamics to modify all the dynamics of the system and il-lustrates the interest of embedding the astrocyte feedback in such neuron–astrocyte model. Our model allows us to study the effects of variations in glutamate or GABA dynamics on neural activity. In the following, we study the effects of deficiencies in the uptake of neurotransmitters by the astrocytes both on extracellular concentrations and neural activity. For both types of deficiency (GABA and glutamate uptake), we first describe the biologic context and mechanisms and their outcomes, then we pro-vide a mathematical analysis of the underlying dynamical mechanisms to explain the effects that can be expected in a biological system.
3 Deficiency of Astrocytic GABA Uptake
Because a single astrocyte may ensheath hundreds of thousands of synapses [41,42], the increase of extracellular GABA resulting from slow, defective astrocytic uptake is expected to promote neuronal inhibition and thus reduces synaptic release in line with what is elucidated in the previous Sect.2.5. Thus, once we consider many de-fective astrocytes, all neurons in the proximity of these astrocytes are likely to be inhibited [43].
To simulate deficiency of astrocytic GABA uptake in our model, we decrease the maximum (saturated) rate of astrocytic GABA uptake from the extracellular space (Vγae) as this parameter directly depends on the uptake efficiency of astrocytic GABA transporters. At the neuronal population level we are interested instead in deriving the dependence ofpSNIC on astrocytic feedback. With this aim, because glutamate
binding by neuronal receptors is independent of cell types, we may set:
mIGS[Glu]e, vG, rG
≡v1,
mPGS[Glu]e, vG, rG
≡mPG mIGv1, mγS
[GABA]e, vγ, rγ
≡v2,
where v1 and v2 are defined within the boundaries of mIGS([Glu]e, vG, rG) and mγS([GABA]e, vγ, rγ), that is, 0≤v1≤mIGand 0≤v2≤mγ.
With these new notations, the dynamical excitability thresholdsvP,vP, andvIof
populationsP,P, andI become
vP =v0+v2−
mPG
mIGv1, vP=v0,
vI=v0−v1.
By these new parameters, an increase (decrease) of extracellular GABA or gluta-mate are represented by an increase (decrease) ofv2orv1, respectively. Accordingly,
because a deficiency of astrocytic GABA uptake increases extracellular GABA con-centration, then we aim at characterizing the dependency ofpSNICon the value ofv2.
In particular we formalize our first model prediction in Proposition3.1and exem-plify it by numerical continuation of the SNIC bifurcation for varyingv2in Fig.6
(left panel). In carrying out our following analysis, we assumev1constant, leaving
justification of such assumption a posteriori at the end of the section.
Proposition 3.1 The threshold for neuronal activation, pSNIC, linearly increases with the GABA-induced modulation of neural excitabilityv2.
Proof The set of the system singular points obtained for the different values of
pa-rameterpcan be explicitly expressed according toy0,v1, andv2all other parameters
being fixed. Using system (3a)-(3f), a singular point satisfiesy3=y4=y5=0.
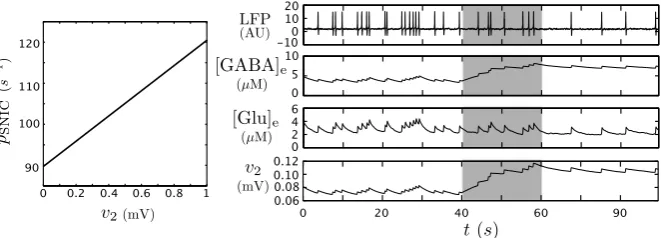
Fig. 6 The dependency of the SNIC value onv2explains the impact of an alteration of the GABA as-trocytic uptake on the neural activity. Variation ofpSNICvalue according tov2(left). Time series corre-sponding to LFP,[GABA]e,[Glu]eandv2=mγS([GABA]e, vγ, rγ)(right from top to bottom) forp(t ) a Gaussian variable. Att=40 s, the GABA astrocytic uptake is artificially altered by settingVγae=0 for any subsequent time. The gray time window highlights the transient toward the new behavior
respect toy0. Then annihilation of the r.h.s. of (3d) provides y1 as function ofy0.
Finally, by annihilation of Eq. (3e), we find that they0 components of the singular
points for given values ofp,v1andv2are characterized as solutions of
p=f (y0, v1, v2), (6)
where
f (y0, v1, v2)=
a
A
v0−
mPG
mIGv1+v2
− a
Arln
2Ae0−ay0
ay0
−aG
A y0
−C2Sˆ(C1y0, v0)+
aB
bAC4Sˆ(C3y0, v0−v1). (7) All the other components of a given singular point can be explicitly expressed as functions of they0 component. The calculation is straightforward from the
annihi-lation of the vector field (5a)-(5i) as explained above. Since these components are not needed for the following analysis and are only minor calculus details, we do not specify these heavy expressions. We rewrite Eq. (7) as follows:
f (y0, v1, v2)=
a
Av2+q(y0, v1). (8)
Obviously the two saddle-node bifurcation valuespSN1andpSN2are relative extrema
of f (y0, v1, v2). In particular pSN1 =pSNIC coincide with the local maximum of f (y0, v1, v2)and, as such, is of the solution of
p=f (y0, v1, v2), (9a)
∂f ∂y0
(y0, v1, v2)=0, (9b)
∂2f
Since ∂y0∂f(y0, v1, v2)is independent onv2, so isySNICand it can be considered as a
parameter in Eq. (9a). From (8) and (9a)-(9c) we obtain the following expression for pSNIC:
pSNIC=
a
Av2+q(ySNIC, v1).
Let us consider the model generating an oscillatory output with a fixed value of p(pSNIC< p). If the extracellular concentration of GABA increases (e.g. by an
in-jection of GABA as in Fig.5), the value ofv2increases and Proposition3.1asserts
that the value ofpSNICalso increases. As already explained, the closestpSNICis to
p, withpSNIC< p, the largest is the limit cycle period, thus the oscillation frequency
of the outputs decreases. IfpSNICincreases enough such thatpSNIC> p, the stable
limit cycle of the system disappears, and the neural compartment becomes quiescent. In the case of deficiency of GABA uptake, the extracellular concentration of GABA increases, and we can use Proposition3.1to explain the following effects. For that purpose, we use the following in silico protocol: we initialize the neuron– astrocyte model in an oscillatory phase with a low oscillation frequency and consider p(t )a Gaussian input. Att=40 s, we turn off the GABA astrocyte uptake by setting Vγae=0 (Fig.6). The result is an increase in GABA extracellular concentration im-plying an increase inpSNIC. AspSNICincreases, the probability forp(t )to overcome
pSNICalong the associated Brownian motion decreases, and also does the oscillation
frequency (Fig.6). Consequently, we observe a decrease in the oscillation frequency aftert >40 s. In the time series, the oscillation frequency decreases gradually during a transient (40 s< t <60 s) until reaching its minimum. This can be explained by the slow increase of GABA extracellular concentration that reaches its new baseline att=60 s.
To summarize, our hitherto analysis reveals that a deficiency of astrocytic GABA uptake causes a decrease of neural firing, leaving extracellular glutamate concentra-tion close to its baseline. This emphasizes that, under such condiconcentra-tions, changes in glutamate-induced modulation of neuronal excitability (v1) are overall negligible
in-sofar as neural activity is sufficiently inhibited by high extracellular GABA.
4 Deficiency of Astrocytic Glutamate Uptake
We now focus on the impact of deficient astrocytic glutamate uptake on neuronal activation. This scenario results in an increase of extracellular glutamate which in principle is expected to make neurons more excitable and thus more prone to fire. However, such increase in excitability may be (at least partly) counteracted by the re-sulting boost in interneurons firing which triggers synaptic release of GABA, overall increasing extracellular levels of this species and promoting, in turn, neural inhibi-tion. This suggests that the possible balance between glutamatergic neuronal excita-tion and GABAergic inhibiexcita-tion may lead to nontrivial dynamics regimes for neural activity. Considering the rationale outlined in the previous section, we now set out to characterize the changes in the SNIC bifurcation valuepSNIC (i.e. the threshold
for neural activation) withv1value. The latter variable, introduced in the beginning
both interneuron and pyramidal neuron excitabilities. Hence, it depends directly on the astrocytic glutamate uptake. We therefore analyze the various consequence on the neural activity of a deficiency of astrocytic glutamate uptake simulated by choosing small values for the maximum uptake rateVGae.
We note in this regard, however, that, for certain parameter sets of the whole model, the SNIC bifurcation may be lost asv1changes. Due to the high
dimension-ality of our parameter space, it is difficult to estimate the region of existence of the SNIC for any value ofv1, yet by the arguments exposed in [29] we may safely state
that this region is large enough to be always found for our choice of parameters (see Table1). Accordingly, in the following, we assume thatpSNICalways exists and the
associated saddle-node bifurcation is not degenerate for anyv1such as 0≤v1≤mIG,
that is the maximum interval of values taken byv1=mIGS([Glu]e, vG, rG).
We recall thatpSNICcan be written as follows:
pSNIC=f (ySNIC, v1, v2), (10)
wheref is given by (7). Since we considerv2fixed we introduce the function
g(y0, v1)≡f (y0, v1, v2)|v2=const.
As explained above, for eachv1, there exists a unique bifurcation valuepSNIC
oc-curring at the non-hyperbolic (saddle-node) singular point characterized byySNIC,
which is defined by
∂g ∂y0
(ySNIC, v1)=0,
∂2g
∂y02(ySNIC, v1) <0.
This value satisfiespSNIC=g(ySNIC, v1). We cannot find the explicit expressions of
ySNIC(v1)andpSNIC(v1). Thus, for characterizing the variations ofpSNICwithv1, we
take advantage of the implicit definitions above and focus on localizing the extrema ofpSNIC(v1).
Proposition 4.1 Assume that, for allv1such that 0≤v1≤mIG,pSNICexists and the associated saddle-node bifurcation is not degenerate. Noteχ=Be0rC42b . Then: 1. ifm
P G
mI G
χ,pSNIC(v1)has no local extremum,
2. if 0<m
P G
mI G
< χ,pSNIC(v1)may admit two local extrema: a minimum atv∗1 and a maximum atv1∗∗. If both exist, thenv1∗< v∗∗1 .
Proof Let us search for local extrema of the functionpSNIC(v1), which is implicitly
defined by (9a)-(9c). Hence, we are interested in the following constrained optimiza-tion problems:
max
g(y0, v1)
∂g ∂y0
(y0, v1)=0
min
g(y0, v1)
∂g ∂y0
(y0, v1)=0
We introduce the associated Lagrangian function
L(y0, v1, λ)=g(y0, v1)−λ
∂g ∂y0
(y0, v1).
The necessary condition for the existence of an extremum ofgunder the constraint
∂g ∂y0 =0 is
− →∇
L(y0, v1, λ)=0,
that is,
∂g ∂y0
(y0, v1)−λ
∂2g
∂y02(y0, v1)=0, (12a)
∂g ∂v1
(y0, v1)−λ
∂2g ∂v1∂y0
(y0, v1)=0, (12b)
∂g ∂y0
(y0, v1)=0. (12c)
By assumption, the saddle-node bifurcation associated with the SNIC bifurcation is not degenerate, i.e. every solution of (11) such as 0≤v1≤mIG satisfies ∂
2g
∂y2 0
(y0,
v1) =0. Thus, system (12a)-(12c) reads
λ=0, (13a)
∂g ∂v1
(y0, v1)=0, (13b)
∂g ∂y0
(y0, v1)=0. (13c)
Therefore, if the problem under constraint admits an extremum, at this extremum it is
∂g
∂v1 =0. Following the assumption that a SNIC bifurcation occurs for any value ofv1
between 0 andmIG, then Eq. (13c) admits a solution for anyv1as well. Hence, if our
constrained problem admits an extremum, this corresponds to the SNIC bifurcation occurring at(y0, v1)such that
∂g ∂y0
(y0, v1)=0.
From (7), we obtain
∂g ∂v1
(y0, v1)= −
a A
mPG
mIG + B
bC4 ∂Sˆ
∂v(C3y0, v0−v1)
.
Using the facts that, for any fixed value ofy0, function v1→ ∂v1∂g(y0, v1) is
Fig. 7 Interval ofmPG/mIG
values corresponding to a realized local minimum of neural excitability threshold. Graphic representation of the functionhdefined by (19) and interval[I1, I2]for which
v1∗∈ [0, mIG]
function∂v1∂g(y0, v1)vanishes inv1if
0<m P G
mIG< χ . (14)
If m P G
mIG χ, the function ∂g
∂v1(y0, v1)admits no zero, which proves the first item of
Proposition4.1.
Now, we assume that condition (14) is fulfilled and we search the values ofv1
satisfying ∂v∂g
1(y0, v1)=0, i.e. mPG
mIG + B
bC4 ∂Sˆ
∂v(C3y0, v0−v1)=0. NotingX=er(v0−v1−C3y0)=(S(C
3y0, v0−v1, r))−1−1, this equation reads
mPG
mIGX
2+
2
mPG
mIG−2χ
X+m
P G
mIG =0. (15)
Setting
V±=2χm I G
mPG−1±2 χ mIG
mPG
χm I G mPG −1
, (16)
we obtain the two solutionsv1∗< v∗∗1 of ∂v1∂g(y0, v1)=0:
v1∗=v0−C3y0−
1
v1∗∗=v0−C3y0−
1
rln(V−). (18)
Note that v1∗ (resp. v∗∗1 ) corresponds to the extremum when the saddle-node SN1
(resp. SN2) crosses the fold of the surfaceg(y0, v1)=p. We considerv1=v1∗and
we notey0∗the value ofy0corresponding to the SNIC connection for this value ofv1, i.e. the solution of
∂g ∂y0
y0, v1∗
=0,
∂2g ∂y02
y0, v1∗
<0.
To prove thatpSNIC reaches a local minimum at v1=v∗1, we introduce the
bor-dered Hessian matrixH associated with the Lagrangian function at its singular point (y0, v1, λ)=(y∗0, v1∗,0)(solution of system (13a)-(13c)):
Hy0∗, v1∗,0= ⎛ ⎜ ⎜ ⎜ ⎝
0 ∂2g
∂y02
∂2g ∂v1∂y0 ∂2g
∂y02
∂2L ∂y02
∂2L ∂v1∂y0 ∂2g
∂v1∂y0 ∂2L ∂v1∂y0
∂2L ∂v12
⎞ ⎟ ⎟ ⎟ ⎠
|(y∗
0,v∗1,0)
= ⎛ ⎜ ⎜ ⎜ ⎝
0 ∂2g
∂y02
∂2g ∂v1∂y0
∂2g ∂y02
∂2g ∂y02
∂2g ∂v1∂y0
∂2g ∂v1∂y0
∂2g ∂v1∂y0
∂2g ∂v2 1 ⎞ ⎟ ⎟ ⎟ ⎠
|(y∗0,v∗1,0)
.
The determinant ofH (y0∗, v∗1,0)is given by detHy0∗, v∗1,0
= −∂2g
∂y02
y0∗, v∗1∂
2g
∂y02
y0∗, v1∗∂
2g
∂v21
y0∗, v1∗−
∂2g ∂v1∂y0
y0∗, v1∗
2
.
On one hand, the saddle-node associated with the SNIC bifurcation is not degenerate and is a local maximum ofg(y0, v1), thus ∂
2g
∂y2 0
(y0∗, v1∗) <0. On the other hand, for anyy0,v1→∂v1∂g(y0, v1)is increasing at(y0, v1∗)(see Fig.7), thus
∂2g ∂v2 1
(y0∗, v1∗) >0. Finally
detHy0∗, v1∗,0<0
and(y0∗, v1∗)corresponds to a local minimum ofpSNIC. A similar argument proves
that(y0∗∗, v1∗∗)corresponds to a local maximum ofpSNIC(wherey0∗∗is they0value
The above proposition can be interpreted as a necessary condition for having a change in the sense of variations ofpSNICwhenv1varies in[0, mIG]. We now derive a
necessary and sufficient condition so thatv∗1actually lies in[0, mIG]. Sincev1∗satisfies
∂g
∂v1(y0∗, v1∗)=0, one obtains, from Eq. (15),
mPG
mIG =4χ
1−SC3y0∗, v0−v1∗, r
SC3y0∗, v0−v∗1, r
=4χ hv1∗. (19)
For anyy0, functionh:v1→(1−S(C3y0, v0−v1, r))S(C3y0, v0−v1, r)is strictly
increasing over[0, mIG], and 0≤v1∗≤mIGif and only ifI1≤
mPG
mIG ≤I2where I1=4χ
1−SC3y0∗, v0, r
SC3y0∗, v0, r
, (20a)
I2=4χ
1−SC3y0∗, v0−mIG, r
SC3y0∗, v0−mIG, r
. (20b)
Figure7gives an illustration of the functionhas well as howI1andI2are built.
In conclusion, for a fixed value ofv2,pSNICreaches a local minimum at a value
v1∗such that 0≤v∗1≤mIGif and only if mPG
mIG ∈(0, χ )∩ [I1, I2].
Moreover, in Sect.3about the astrocyte GABA uptake deficiency, we proved that, for a fixed value ofv1,pSNIC is linear and increasing withv2. Both results allow us to
predict that there exist three shapes ofpSNIC(v1, v2)according to the value of m P G
mIG.
(a) IfmPG
mIG < I1thenv ∗
1<0 andpSNICstrictly increases withv1andv2.
(b) Ifm P G
mI G
> I2, thenv1∗> mIGandpSNICstrictly decreases whenv1increases (forv2
fixed) and strictly increases withv2(forv1fixed).
(c) IfI1≤
mP G
mIG ≤I2, then 0≤v ∗
1≤mIG andpSNICdecreases when v1 increases in
[0, v1∗]and increases withv1> v∗1(forv2fixed).
In the following we illustrate the three qualitative types of neural activity resulting from an astrocyte deficiency to capture glutamate using the following values:
(a) m P G
mIG =1.7< I1, (b) m
P G
mIG =3.2> I2, (c) m
P G
For each case, we provide simulations representing the value ofpSNIC in(v1, v2)
space and time series generated by the model when the glutamate astrocytic uptake is altered (Fig.8).
For mPG
mIG =1.7< I1(panel (a) of Fig.8),v ∗
1 is negative and thuspSNICincreases
withv1. Hence in this scenario, whenv1 increases as a consequence of the
astro-cytic glutamate uptake deficiency, we expect to observe a decrease in the oscillation frequency in the neural activity. This is possible because, although a reduction of as-trocytic glutamate uptake is paired with a strong decrease of neural activity, it limits synaptic glutamate release allowing deficient astrocytic uptake to still stabilize extra-cellular glutamate levels and thus neural activity.
Panel (b) of Fig.8is obtained with m P G
mI G
=3.2> I2. Sincev∗1>1,pSNICdecreases
as v1 increases. Thereby, an astrocyte glutamate uptake deficiency triggers an
in-crease of thev1value, and we observe an increase in the oscillation frequencies in the
neural time series. Since the astrocytic uptake is reduced, glutamate accumulates in the extracellular space and the corresponding concentration baseline increases dras-tically.
Finally, the intermediate scenario wheremPG
mIG =2.43∈ [I1, I2]is shown in panel (c)
of Fig.8. In this casepSNICdecreases forv1< v1∗and increases otherwise. Therefore,
in the presence of deficient astrocytic glutamate uptake, we observe only a transient increase of the frequency of LFP spikes. This is the scenario presciently mentioned at the beginning of the section where the effect of increased extracellular glutamate levels on neuronal excitability are counterbalanced by increased extracellular GABA levels resulting from increased interneurons firing and accounts for the delay ob-served in our simulations in reaching steady frequency of LFP oscillations.
This scenario is physiologically relevant insofar as it is conceivable that an ex-cess of extracellular glutamate concentration is regulated after a delay, triggering a decrease of neural activity after the initial increase. Moreover, the frequency after the regulation delay can be greater or lower than the initial one, depending on the value
of the ratio m P G
mI G
. Note that this value can be tuned to obtain v1∗ small enough and pSNIClarge enough so that the frequency after regulation is equal or lower than the
one before uptake deficiency. This property offers the possibility of fitting the model outputs to experimental data and allows us to propose hypotheses about physiological and pathological mechanisms.
5 Discussion and Conclusions
We have introduced a novel neuron–astrocyte mass model, which combines two pre-viously studied models [29,30] by bidirectional neuron–astrocyte coupling based on astrocytic uptake-mediated modulations of extracellular glutamate and GABA con-centrations and their effect on neural activity in agreement with experimental obser-vations [10,37,44,45].
Fig. 8 Alteration of astrocytic glutamate uptake: (a) lessening the excitability, (b) resulting in sustained
hyperexcitability, (c) resulting in transient hyperexcitability. In each case, the colormap on the left displays the value ofpSNICin(v1, v2)plane, and the time series on the right correspond to LFP,[GABA]e,[Glu]e andv1=mIGS([Glu]e, vG, rG). The black curves on the colormap are the trace of (mIGS([Glu]e, vG, rG),
mγS([GABA]e, vγ, rγ)) along the associated orbits of the model. Att=20 s, we alter the glutamate astrocytic uptake by settingVGae=0. The three cases are obtained with: (a) m
P G
mIG=1.7, (b) mPG mIG =3.2, (c)m
P G
impact of the neurotransmitters-mediated modulation of neuron excitability. Based on the interpretation of the aggregated—yet biophysically significant parameters of our model—we have reproduced in silico both glutamate and GABA uptake deficiency in astrocytes and illustrated by numerical simulations the different types of change in the neural activity resulting from such deficiency.
Our study leads to several predictions. First is the observation that deficiency of GABA uptake by astrocytes increases the threshold for neuronal activation in a linear fashion. In other words, neurons tends to fire more the slower astrocyte GABA uptake is, or equivalently, the larger extracellular GABA concentration is, which is consis-tent with experimental findings [46,47]. The second prediction comes instead from the analysis of the neuronal response in the presence of deficient astrocytic glutamate uptake. In this case, neural activity may either be reduced or enhanced or, alterna-tively, may display a transient of high activity before stabilizing around a new regime whose firing frequency is close to the one measured in the absence of astrocyte de-ficiency. A prominent feature of our model is its mathematical tractability, despite the fact that, differently from the sole neural mass model in [29], an explicit for-mula for the SNIC bifurcation underpinning the rise of neural activity in the presence of bilateral neuron–astrocyte coupling cannot be obtained. It is nonetheless possible to recast the characterization of variations of neuronal excitability upon astrocytic uptake as an optimization problem under an equality constraint resulting from the implicit characterization of the SNIC bifurcation. In particular, we identify by the quantitymPG/mIG, which denotes the ratio between maximally affecting concentra-tions of extracellular glutamate impacting on excitability of pyramidal neurons and interneurons, respectively, the biophysical conditions for the occurrence of different neural activity regimes caused by deficient astrocytic glutamate uptake. In this regard, our analysis suggests that a neural population may counteract the effect of excess ex-tracellular glutamate resulting from deficient astrocytic uptake only if the value of
mPG
mIG lies in a well-defined interval[I1, I2]which depends on inherent biophysical and
cellular properties of the population under consideration. Outside this interval, for
values of mPG
mI G
< I1, the frequency of neural activity decreases and may enter
quies-cence while for values ofm P G
mIG > I2, neural firing drastically and persistently increases
leading to epileptiform activity in agreement with experiment [48]. On the other hand,
forI1<m P G
mIG < I2neural activity may recover to close-to-baseline levels after a high
frequency transient, regardless of large extracellular concentrations of glutamate and GABA. We note that while bothI1 andI2depend on the strength of inhibition of
pyramidal neurons by interneurons onlyI2further depends onmIG. Hence, one might
interpret the latter dependence as an estimator of the balance between glutamatergic astrocytic feedbacks on pyramidal neurons and correlated interneuron hyperexcitabil-ity that the system should seek to recover from astrocytic uptake deficits and avoid hyperexcitability.
A further interesting prediction of our model is that, whenm P G
mIG > I1, an increase of



![Fig. 7 Interval ofintervalv mPG/mIvalues corresponding to aGrealized local minimum ofneural excitability threshold.Graphic representation of thefunction h defined by (19) and [I1,I2] for which∗1 ∈ [0,mIG]](https://thumb-us.123doks.com/thumbv2/123dok_us/913921.1589234/22.439.121.385.49.348/interval-ofintervalv-corresponding-agrealized-excitability-threshold-representation-thefunction.webp)

