www.j-sens-sens-syst.net/6/185/2017/ doi:10.5194/jsss-6-185-2017
© Author(s) 2017. CC Attribution 3.0 License.
Quantitative, time-resolved detection of CH
4
concentrations in flows for injection analysis in CNG
engines using IR absorption
Stephan Bauke1, Kai Golibrzuch1, Frank Rotter1, Hainer Wackerbarth1, Olaf Thiele2, and Thomas Berg2
1Laser-Laboratorium Göttingen e.V., Hans-Adolf-Krebs-Weg 1, 37077 Göttingen, Germany 2LaVision GmbH, Anna-Vandenhoeck-Ring 19, 37081 Göttingen, Germany
Correspondence to:Stephan Bauke ([email protected])
Received: 6 September 2016 – Revised: 24 March 2017 – Accepted: 8 April 2017 – Published: 8 May 2017
Abstract. The reduction of CO2and other greenhouse gas emissions is an important driving force for the
de-velopment of modern engines. Especially in the transport sector, the use of alternative fuels like methane, the main component of compressed natural gas (CNG), is an applied measure to achieve this goal. This work de-scribes the development of an optical measurement system for accurate quantification of CH4densities in gas
flows based on broadband absorption of infrared light, i.e. non-dispersive IR absorption spectroscopy (NDIR). We demonstrate the capability of the system to achieve high time resolution as well as high measurement accu-racy and precision. The optical set-up of the system is designed for usage at the inlet manifold of CNG-fuelled spark ignition engines. It allows for detailed analysis of the mixture formation during single engine cycles. CH4
densities can be determined by monitoring the infrared light attenuation around 3.3 µm caused by theν3
anti-symmetric C–H-stretch vibration. We calculate the nonlinear relation between transmittance and CH4density
from absorption cross sections calculated from the HITRAN database. The theoretical transmittance signals are corrected for spectral influences of the bandpass filter, the detector sensitivity, the fibre transmittance and the emission spectrum of the light source in order to calculate CH4densities directly from the measured
transmit-tance. A calibration function corrects remaining differences between experimental and simulated values and improves the accuracy. We show that the sensor system is capable for determination of air–fuel ratios (λ-values) and demonstrate the dynamic quantification of a CH4injection into a flow channel under various flow conditions.
Furthermore, we present the first measurements with a prototype probe capable of measurements inside the inlet manifold of a four-stroke spark ignition engine. We validate the detection strategy in experiments with premixed gases using a modified inlet geometry and demonstrate its application under standard engine operation with port fuel injection while varying the injection parameters.
1 Introduction
The worldwide climate change calls for changes and new developments in almost all areas of technology and soci-ety. One of the most important tasks is the emission reduc-tion of greenhouse gases. Especially the reducreduc-tion of car-bon dioxide (CO2) emissions, which is one of the primary
products of combustion processes, is a significant challenge since combustion of fossil fuels is still one of the great-est energy sources used today (International Energy Agency,
2016). Common strategies to reduce the overall emissions are a continuous improvement of combustion system efficiencies as well as the use of alternative fuels that inherently emit less greenhouse gases.
higher number of battery electric vehicles (BEVs) can sig-nificantly reduce greenhouse gas emissions from transporta-tion (Faria et al., 2012). Through technological development and policies favouring electric mobility, this presents a rising competition to internal combustion engine vehicles (ICEVs; Dijk et al., 2013). Nevertheless, BEVs still struggle with short ranges, long charging times and higher capital costs than ICEVs (Ma et al., 2012; Yilmaz and Krein, 2013). Fur-thermore, their CO2balance only becomes more favourable
than conventional fuels if the electricity originates from re-newable sources (Ma et al., 2012). In conclusion, combus-tion engines are likely to stay the standard driving technol-ogy for the next years. Consequently, the European Union set new limits for CO2and NOxemissions of cars, which result
in higher technological requirements for spark ignition (SI) engines (European Parliament and Council, 2009). Increas-ing the efficiency and lowerIncreas-ing the emissions of convention-ally fuelled car engines need more and more effort. There-fore, the use of alternative fuels such as compressed natural gas (CNG) is an attractive opportunity for emission reduc-tion (Edwards et al., 2011; Turrio-Baldassari et al., 2006). Already based on its chemical structure (carbon–hydrogen ratio), it is capable of reducing CO2 emissions by 25 % in
certain scenarios (Deutsche-Energie-Agentur, 2011). In con-clusion, CNG can serve as a bridging technology before elec-tric mobility becomes competitive. Moreover, CNG replaced by or blended with biogas allows for a striking CO2
bal-ance (Deutsche-Energie-Agentur, 2011; Kramer et al., 2015). However, CNG-fuelled engines do not yet reach efficiencies of gasoline-fuelled engines and still require significant im-provement. For optimization of CNG-fuelled engines, de-tailed knowledge of the air–fuel mixture formation prior to the combustion is essential since the process determines properties of combustion (Korakianitis et al., 2011).
One of the best-known methods to achieve time-resolved measurements of mixture formation is gas sampling followed by analysis in a flame-ionization detector (FID; Turrio-Baldassari et al., 2006; Collings, 1988; Cheng et al., 1989; Galliot et al., 1990). However, this method suffers from a time delay caused by the length of the sampling pipe, a draw-back that can be overcome by optical sensor technologies (Grosch et al., 2011). Beside gas sampling systems, there are different optical methods to analyse mixture formation. Laser-induced fluorescence (LIF) allows spatially resolved measurements of temperature and air–fuel ratios but requires sufficient optical access. Additionally, LIF experiments are very time-consuming, need thorough preparation, including a careful selection of a fluorescent tracer molecule, and of-ten do not allow real-time measurements (Luong et al., 2008; Schulz and Sick, 2005). Another laser-based detection tech-nique employs the 3.392 µm emission of a He–Ne laser to de-termine fuel concentrations from absorption measurements. However, the pressure and temperature dependent absorption cross sections of hydrocarbons (in conventional fuels or of CH4) can make quantification difficult regarding the
vary-ing conditions in engines (Tomita et al., 2003a, b; Klvary-ingbeil et al., 2006). Tuneable diode laser absorption spectroscopy (TDLAS) uses scanning of a specific molecular absorption line for fast measurements of temperature and species con-centration and is widely applied in combustion diagnostics (Bolshov et al., 2015). In TDLAS experiments, it is crucial to select the respective absorption line with great care, and the zero emission line has to be controlled thoroughly regard-ing effects of light scatterregard-ing and beam steerregard-ing. Wavelength modulation techniques overcome part of these problems, but need sophisticated computational modelling, which intro-duces additional uncertainties (Bolshov et al., 2015). Over-coming problems of temperature and pressure dependence as well as selection of appropriate tracer molecules or absorp-tion lines, sensor systems based on nondispersive infrared (NDIR) absorption to measure the local fuel concentration and exhaust gas recirculation at the spark plug of an engine were developed (Hall et al., 2001; Hall, 1999; Koenig and Hall, 1998, 1997). Using broadband infrared light sources, concentrations of several molecular species can be measured simultaneously by selecting their absorption range with in-frared bandpass filters. Since NDIR systems usually cover the complete absorption band of a molecule, pressure and temperature influences are much weaker than in the case of narrow band detection of single absorption lines. A high time resolution and acquisition rate can be achieved allowing for single-cycle-based measurements. However, in situ calibra-tion using a gas of well-defined concentracalibra-tion is necessary to calculate species concentration from transmission signals (Grosch et al., 2007; Hall, 1999).
con-Figure 1.Schematic overview of the optical measurement system.
ditions and transfer the principle geometry into a first pro-totype inlet probe. The propro-totype sensor system is tested at an SI engine fuelled with methane performing validation ex-periments with premixed gases as well as standard engine operation with port fuel injection.
2 Experimental section
2.1 Measurement system
The detection system used in this work was originally devel-oped to measure simultaneously air–fuel ratios and exhaust gas recirculation (EGR) rates inside the combustion chamber of a gasoline-fuelled SI engine (Grosch et al., 2007, 2011, 2014). The schematic concept is shown in Fig. 1. The light of a 150 W quartz–tungsten–halogen (QTH) lamp is cou-pled into a ZrF4fibre through a chopper wheel that applies a
30 kHz modulation. This allows a constant measurement and subtraction of background infrared radiation, e.g. from hot surfaces or a flame during combustion. The fibre guides the light to a sensor probe where the gas in the absorption path causes a wavelength dependent attenuation of the incident radiation. The remaining light is coupled into a second ZrF4
fibre and guided to the detection unit. The latter consists of a cascade of four mercury–cadmium–telluride (MCT) detec-tors covered by different IR bandpass filters. Each detector produces a voltage output according to the incident light in-tensity. Division of the detector signal with absorbing species present inside the measurement volume by the signal without absorbing species gives a broadband transmittance value,τ. The quantification method presented in this work is then able to assign a specificτ-value to the corresponding CH4density
for given pressure and temperature. Hereinafter, each combi-nation of filter and detector is referred to as a “channel” or a “detection channel”. The bandpass filters select a detection frequency range matched to the molecule of interest and are
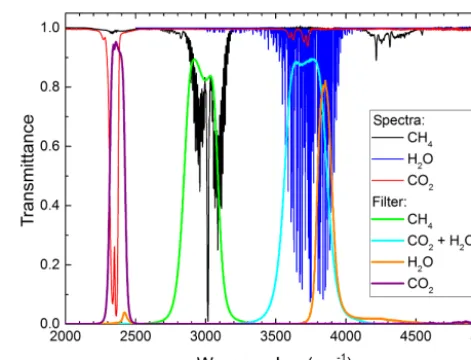
Figure 2. Absorption bands with marked detection regions for H2O, H2O+CO2, CO2and CH4of the prototype system used. The H2O and CO2absorption enables determination of EGR rates but is not considered here. The H2O spectrum was calculated using HI-TRAN (resolution: 0.01 cm−1at 100 kPa, 298 K, 40 cm absorption path length). CH4 and CO2 spectra were measured with a FTIR spectrometer (Bruker Vector 33, resolution 0.9 cm−1) in a pressure cell (400 kPa, 298 K, 6 cm absorption path length, 0.2 and 0.02 % mole fractions, respectively).
shown in Fig. 2. We note that the system used in this work is a prototype system for developing quantification strategies, i.e. the two filters around 2.7 µm marked as “CO2+H2O” and
“H2O” as well as the filter around 4.2 µm marked as “CO2”
enable the determination of EGR rates. The quantification of exhaust gas concentrations is not considered in this work but will be presented in a future publication. Here, we focus on the ability of the filter at 3.3 µm (marked as “CH4”) to
deter-mine air–fuel ratios. The spectral region around 3.3 µm cor-responds to theν3vibrational band of CH4, which represents
the anti-symmetric C–H-stretch vibration and is present in all hydrocarbons. Consequently, the same bandpass filter may be used for the detection of different hydrocarbon molecules, e.g. fluid hydrocarbon fuels, as well. Nevertheless, the quan-tification procedure is different for CH4 because its small
molecular structure results in an absorption spectrum with distinct peaks that exhibit strong influences of pressure and temperature.
A major issue of NDIR detection is the selection of an appropriate bandpass filter regarding sensitivity and reduc-tion of cross sensitivity to other molecular species, i.e. CO2
and H2O. Figure 2 illustrates that the CH4channel shows no
overlap with CO2and only a very weak overlap with H2O
absorption lines. We estimated that even in the case of 100 % humidity at room temperature (∼3 % H2O vapour) and the
whole beam path exposed to ambient air, the absorption of H2O vapour will only reduce the integrated transmittance to
signal-Figure 3.Schematic drawing of the flow channel with details of the mixing module and the optical set-up.
to-noise ratio (typically∼250) of the detector and thus can be neglected in our quantification method.
Since the sensor system was developed for usage in engines, where significant background radiation may be present, the signal is constantly modulated by the chopper wheel at 30 kHz while acquiring a crank angle (CA) resolved trigger and an additional trigger once or twice every cycle. After each measurement, the acquisition software maps the data to the trigger signals according to the desired resolution, typically 1◦CA. In our flow channel and pressure cell
exper-iments there are no trigger signals available. In this case the system simulates a user defined engine speed and maps the data accordingly.
2.2 Flow channel
The flow channel depicted in Fig. 3 serves as idealized model geometry for an inlet manifold of an SI engine. Note that the time-resolved quantification of CH4in an inlet manifold
is the primary goal of the presented measurement technique here. Nevertheless, a transfer to other environments and ge-ometries is possible with only little effort.
A fan draws ambient air from the laboratory into the chan-nel through a filter as shown in Fig. 3. The air passes a flow meter and then enters a mixing module. The module en-ables addition of gas via a mass flow controller (MFC) to the stream of air and produces a homogenous mixture. A draft of this module is sketched in the lower part of Fig. 3. The module comprises three stages. Each stage consists of a sep-arating plate splitting the flow channel into consecutive sec-tions. The air flow has to pass each of these separation plates through a particular aperture influencing the flow behaviour. The gas is introduced to the air flow in front of the first sep-arating plate. This plate’s aperture has an oval shape and is aligned close to the plate’s edge to induce a rotation in a plane parallel to the flow channel. The plate of the second stage has an aperture in the centre and is equipped with baffle plates to produce a swirl around the flow channel centre line. The first
two stages serve for the mixing of the gas. The third plate has regularly arranged holes, like a strainer, and serves to align the mixture flow. Along 50 cm downstream of the mix-ing module, the flow channel is continued in a straight line to settle down the flow before the gas–air mixture reaches the detection region.
The optical set-up shown in Fig. 3 starts with an optical fibre guiding the incident light to the flow channel, where a lens collimates it to a∼8 mm wide beam. After collimation, the light passes a 50 % beam splitter, enters and exits the flow channel through two quartz windows and is reflected back to the beam splitter passing the flow channel a second time. A second lens couples the light to a second optical fibre guid-ing it to the detection unit. The geometry described here is chosen instead of a simple transmittance set-up, because it is more compact and in its final form (see Sect. 2.4) only re-quires optical access from one side. Thus, it is easier to adapt to an SI engine where free space around the inlet manifold is limited.
All experiments were performed under ambient conditions (298 K, 100 kPa). The flow channel has a profile area of 28×38 mm2and the light passes through the short side. Due to the optical set-up with reflector and beam splitter, the light passes the flow channel twice, leading to an absorption path length of 56 mm. The maximum flow velocity in the flow channel is about 13 m s−1, leading to a pressure drop of the order of 1 kPa inside the channel. The temperature was mon-itored via a type K thermocouple measuring the room tem-perature inside the laboratory. For acquisition of calibration data, we use MFCs to mix a defined amount of CH4into the
air flowing through the channel. In engine applications, the air–fuel ratio is typically stated as theλ-value. This value is defined as the mass ratio of air to fuel divided by the ratio under stoichiometric conditions, but can also be converted to a volumetric ratio. For CH4a stoichiometric mixture with an
air-to-fuel volume ratio of 9.52 : 1 corresponds toλ=1. This ratio is equivalent to the flow ratio of air and CH4 flowing
through the channel. Therefore, we can adjust theλ-value of the mixture inside the channel by measuring the flow of air and adjusting the flow of CH4through the MFC accordingly.
We perform the calibration measurements with a fixed air flow of 0.66 and 1.1 m s−1. Further experiments with higher air flows showed no influence of flow velocity on the mea-sured signal (see inset in Fig. 7). The flow through the MFCs is adjusted equivalent to values ofλ=0.25–4. Prior to each measurement, we measure the ambient air signal without CH4 in the flow channel. Each pair of ambient air and air–
CH4mixture is measured six times. Each measurement
measure-Figure 4.Experimental set-up for engine validation measurements with premixed gas. The optical set-up is covered by a housing and screwed into the inlet manifold via a threaded stainless steel tube. The latter is sealed by a 2 mm thick sapphire window which is level with the inlet manifold’s wall. This set-up can either be used with a closed inlet with premixed gases or opened inlet and regular injec-tion and air flow.
ments are averaged and the 95 % confidence interval is taken as uncertainty.
To perform measurements with injection of CH4, the
mix-ing module and the MFC in Fig. 3 are removed and we install a CNG injector from a standard SI engine 5 mm upstream to the detection region. The time resolution of the experiment again is∼0.17 ms and the duration of a measurement cycle with one injection is 1200 ms. The injection starts 200 ms af-ter the beginning of a cycle, to monitor the signal level prior to injection. The injector is backed with a CH4 pressure of
700 kPa and opens for 7 ms in this experiment. Every mea-surement consists of 50 recorded cycles where the first 10 are without injection of CH4. This procedure allows one to
take the first 10 cycles of every recording as a background signal. The signal with CH4 injection is divided by the
av-eraged background signal, resulting in a broadband transmit-tance value. We average these values over the 40 cycles with injection, which minimizes the effect of small variations of single injections, and repeat every measurement three times.
2.3 Pressure cell
The environmental conditions inside an engine differ from those inside the flow channel as mentioned above, e.g. re-garding dynamical changes in pressure and temperature. Ad-ditionally, the optical system does not include quartz win-dows, which results in different spectral calculations. There-fore, we performed a series of calibration measurements on pressure cells with highly purified premixed gases. The
mixtures were composed of 2.62 %, 9.5 % and 30 % CH4
(99.9995 %) in N2 (99.9999 %), corresponding toλ-values
of 3.9, 1.0 and 0.25, respectively. The pressure cell is capa-ble of enduring pressures up to 400 kPa and temperatures up to 500 K. It serves not only as a calibration environment for the inlet manifold, but also for the combustion chamber. The calibration data covers a pressure range from 50 to 350 kPa at temperatures of 300 and 473 K. Here, we consider only the data at low pressures important for measurements in the inlet manifold. Pressure and temperature in the inlet mani-fold are not expected to reach higher values than in the pres-sure cell experiments. Since in a combustion chamber typi-cal temperatures are higher than in our pressure cell exper-iments, we validated that the calibration is independent of temperature (see Fig. 10 and the description). Further exper-iments with quantification of CH4densities inside the
com-bustion chamber are subject to current research and will be considered in future publications. We repeat each measure-ment six times and calculate the average value with a 95 % confidence interval. At the start of the measurements, the cell is evacuated to determine the background signal without any absorber present. Afterwards, the cell is filled with the pre-mixed gas and evacuated again, after the signal at maximum pressure was measured.
2.4 Prototype engine inlet probe and engine conditions
time resolution of 1◦CA by a piezo resistive pressure sensor (Kistler type 4007B). Both, thermocouple and pressure sen-sor, were located close to the detection position at a distance of 1.5 cm. The premixed gases consisted of 2.52 and 9.51 % CH4(99.9995 %) in N2(99.9999 %) givingλ-values of 4.06
and 1.0, respectively. Background measurements with am-bient air were performed before and after every measure-ment and both mixtures were measured six times at 800 rpm engine speed. At this speed 1◦ CA corresponds to a time resolution of ∼0.21 ms, resulting in an acquisition rate of
∼4.8 kHz. Each measurement acquires 100 single engine cy-cles that are averaged for further analysis. For measurements with injection of CH4under standard engine operation, the
modifications of the air and gas input shown in Fig. 4 were removed.
2.5 Quantification method
Inside the detection volume, the CH4molecules absorb parts
of the infrared light according to Beer–Lambert’s law, result-ing in an attenuated intensity of lightI(ν) compared to the initial intensityI0(ν):
I(ν)=I0(ν)e−σ(ν, p, T)×ρ(p, T)×L, (1)
whereσ(ν, p, T) is the pressure and temperature dependent absorption cross section at a specific frequency ν, ρ(p, T) is the density of the absorbing molecule,Lis the length of the absorption path andp andT are pressure and tempera-ture, respectively. Our quantification method uses absorption cross sections calculated from the spectroscopic parameters of the HITRAN database (Rothman et al., 2013) by a Lab-View program. The program generates absorption cross sec-tions in the respective spectral range for pressures from 20 to 400 kPa in increments of 20 kPa and temperatures from 250 to 1000 K in 5 K steps. The simulated resolution of the absorption cross sections is 0.01 cm−1 for 20–280 kPa and 0.1 cm−1from 300 kPa and the frequency ranged from 2500 to 3500 cm−1. Note that the transmittanceτ(ν)=I(ν)/I0(ν)
in Eq. (1) is a function of frequency, whereas the detection system measures only integral broadband transmittance val-uesτ. Consequently, we integrate Eq. (1) over the simulated spectral range, considering the transmittance of the system
τsys comprised of filter transmittance, detector sensitivity,
fibre transmittance and the emission spectrum of the QTH lamp:
τ =
R
e−σ(ν,p, T)×ρ(p, T)×L×τsysdν
R
τsysdν
. (2)
Here, the system transmittance is defined as multiplication of filter transmittance τfilter(ν), detector sensitivity Sdetector(ν),
fibre transmittanceτfibre(ν) and lamp intensityIQTH(ν). τsys(ν)=τfilter(ν)×Sdetector(ν)×τfibre(ν)×IQTH(ν) (3)
The black line in Fig. 5 shows a transmittance spectrum of the methaneν3absorption band from 2600 to 3300 cm−1
Figure 5.Principle of broadband transmittance measurements for a CH4spectrum: the grey area corresponds to the voltage output of the detector.
measured with a FTIR spectrometer (Bruker Vector 33) in a pressure cell filled with 0.2 % CH4at 500 kPa and 298 K.
The different peaks in the spectrum correspond to different rotational transitions. Especially in the case of CH4,
pres-sure and temperature have a severe influence on the spec-trum. At constant density, higher pressures lead to broader but lower peaks (pressure broadening), whereas high tem-perature mainly broadens the whole spectrum. The latter is a result of the occupation of higher rotational quantum states through thermal excitation. As a result, the same CH4density
can cause different values ofτ when pressure and tempera-ture change. This can be taken into account by measuring the pressure and estimating the temperature. Fortunately, the pressure and temperature inside the inlet manifold are rather low and normally do not exhibit strong dynamic changes. They typically range around 20–250 kPa and 280–470 K de-pending on the location inside the inlet manifold. The highest temperatures are reached closest to the cylinder head where exhaust gas from a previous engine cycle may enter the inlet manifold through an open inlet valve. The determination of fast changing pressure is possible with piezo resistive pres-sure sensors and available at typical engine test stations. Fac-ing the problem of dynamical temperature changes is subject to current research.
Regarding the quantification of CH4 densities, Fig. 5
shows an overview of all known optical elements of the detection system with major spectral influence on the broadband transmittance measurements of CH4. The figure
system transmittance as well. The resulting system transmit-tance is shown as a purple curve in Fig. 5 and the effectively measured spectrum (orange curve) is the multiplication of the spectral transmittance of CH4 by the system transmittance.
The detector’s voltage output is proportional to the grey area under the curve corresponding to the numerator of Eq. (2). The area decreases with increasing CH4density at constant
temperature and pressure. Previous publications only consid-ered the influence of the filter in the calculations (Grosch et al., 2011). We find that inclusion of the detector sensitivity, the light source emission, the fibre transmittance and, in the case of flow channel experiments, the quartz window trans-mittance, significantly improves the quantitative agreement with the experimental data.
We use Eq. (2) to build a database of expected broadband transmittance values as a function of pressure, temperature and mole fractionxmof CH4. The CH4densityρ(p, T) for
a given pressurepand temperatureT results from the ideal gas law.
ρ(p, T)=xm p
RT (4)
This constructed database works as a three-dimensional look-up table and allows us to connect the measured inte-grated transmittance signal to a corresponding CH4 density
with pressure and temperature as additional input parame-ters. Since the grid of the look-up table is still rather coarse, we use the built-in scattered interpolant function of MAT-LAB from MathWorks to perform a trilinear interpolation based on a triangulation algorithm. This allows us to obtain the CH4 density for any combination of the three input
pa-rameters within the range of the look-up table.
To calculateλ-values at every measurement point, we need to set the density of air in relation to the density of CH4and
calculate the ratio to the stoichiometric value for ideal com-bustion. The total gas densityρtot(pT) can be calculated by
the ideal gas law employing measured pressure and temper-ature. Subtracting the measured CH4densityρCH4yields the
density of ambient air, and thus theλ-value is
λ= ρtot−ρCH4
9.52×ρCH4
. (5)
In applications, it is possible that the available light inten-sity changes over time or even during a single measurement due to impurities (e.g. oil droplets), intensity fluctuations of the light source, beam steering or vibrations. Since these ef-fects do not depend on the radiation frequency, we use the signal from the filter marked as “CO2+H2O” in Fig. 2 as an
offline reference to correct signal variations that are not due to a changing absorber density. Note that we can only apply this correction if the amount of CO2and H2O in the ambient
air remains constant during a single measurement within the resolution of the detection. This assumption should be ful-filled very well under our conditions since we draw ambient air from the laboratory environment for only a few seconds.
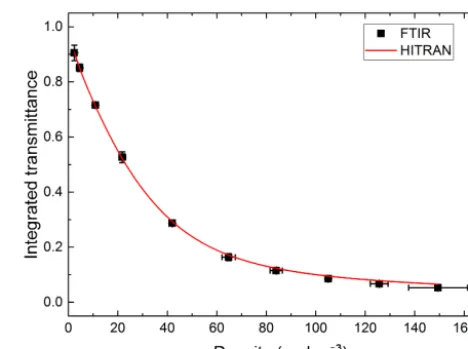
Figure 6.Integrated transmittance values as calculated from FTIR measurements of 9.5 % CH4in N2compared to calculations using the HITRAN database.
For the validation experiments performed with an SI engine, the correction is straightforward, because all gas in the inlet manifold is taken from premixed CH4–N2gas bottles.
We validate our calculations by comparison to experimen-tal CH4spectra acquired in a pressure cell by a FTIR
spec-trometer (Bruker Vector 33). The cell was subsequently filled up to different pressures at room temperature with a CH4–N2
mixture equal toλ=1, where N2 is used as an IR inactive
buffer gas to reach the desired pressure conditions. After ac-quisition of the spectra, we calculated broadband transmit-tance values using the same system transmittransmit-tance as for the up table described in Eqs. (2) and (3). From the look-up table, we calculated the expected broadband transmittance values with temperature, pressure and the respective CH4
density as input parameters. The comparison of measurement to calculations in Fig. 6 shows a very good agreement with a maximum absolute deviation of∼1.3 % in the transmittance value at the highest measured density.
3 Results and discussion
3.1 Flow channel
Figure 7 shows the results of the calibration measurements performed with defined CH4–air mixtures prepared in the
mixing module. In general, the time dependent signal inten-sities indicated a good homogeneity. The peak-to-peak fluc-tuation during a measurement was less than 0.6 and 2.2 % of the detection signal for ambient air and CH4–air mixtures
Figure 7.Results of the calibration measurement (black dots) as well as calculated (green: only filter; red: all spectral influences) and calibrated values (blue). The inset shows in a line-of-sight-geometry measured transmittance values for different air flows.
including only the filter in transmittance calculations leads to significantly larger deviations from the measurements. Since the quartz windows of the flow channel have a spectral in-fluence as shown in Fig. 5, their transmittance spectrum was added as a factor to the system transmittance in Eq. (3). As a result of this additional spectral influence, the flow chan-nel experiments require a separate calibration compared to engine measurements with the prototype sensor probe. The calculated curve in Fig. 7 shows the same behaviour as the measured data and the relative deviation is at the maximum
∼1.1 % with a mean relative deviation of 0.5 % (see Fig. 8). Relative deviation is defined here as the absolute value of 1 minus the ratio of calculated to measured value. However, we found that even small errors in the calculated transmittance values can have a strong impact on the quantification, espe-cially at highλ-values corresponding to low CH4
concentra-tions. Therefore, we apply an empirical calibration procedure successfully used in previous work (Grosch et al., 2011). We note that differences between calculations and measurements may result from errors determining the exact absorption path length or unknown spectral influence of the different opti-cal elements, e.g. frequency dependent fibre coupling. All these influences are assumed to be considerably weak com-pared to the ones considered, but can still sum up and explain the deviations between calculation and experiment. Further-more, we cannot exclude errors resulting from the HITRAN simulations as suggested by the small deviations observed in comparison to FTIR data (Fig. 6). In addition to possible errors in the quantification model, theλ-uncertainty at high
λ-values increases because the MFC reaches its lower flow limit, which could explain the increasing difference between measurement and calculation. The inset of Fig. 7 shows fur-ther measurements with defined λ-values for different flow
Figure 8.Relative deviation of calculated to measured transmit-tance values before (black squares) and after (red dots) calibra-tion. Inset: relation between measured and calculated broadband transmittances for several methane densities in flow channel exper-iments. The green line illustrates the behaviour for perfect agree-ment.
velocities inside the flow channel. These were done using an optical set-up in line-of-sight geometry where the light beam is directly coupled into the detection fibre on the opposite side of the channel. Consequently, the light passes the detec-tion region only once, resulting in a shorter absorpdetec-tion path and explaining higher transmittance values compared to the calibration measurements. The data demonstrate that there is no influence of flow velocity on measured transmittance.
We find that the agreement between experimental and cal-culated data can be further improved by an empirical calcu-lation. In our calibration procedure, we plot measured over calculated transmittance for all densities of the calibration experiment. The inset of Fig. 8 shows the plot and the linear relation between measured and calculated values as well as the expectation for perfect agreement (green line). A slight deviation from the linear fit occurs at high transmittance val-ues, but overall the linear fit matches the data well. The fit yields a linear function linking measured transmittanceτmeas
to calculated transmittanceτcalc:
τmeas=0.9441×τcalc+0.0458. (6)
The blue curve in Fig. 7 shows that the calibrated cal-culations match the measured data better than the uncali-brated ones. This results in a lower relative deviation below 0.5 % (red circles in Fig. 8). The average deviation is 0.18 %, demonstrating the working function of the calibration proce-dure.
Figure 9.(a)Broadband transmittance values for a CH4injection into the flow channel for different flow velocities.(b)Data analysis results of the injection measurements. The inset shows a zoom into the injection from 200 to 250 ms.
Independent of the flow velocity, the transmittance drops sharply directly after the injection at 200 ms followed by a flow velocity dependent increase in transmittance due to re-moval of CH4from the detection region. The curves in Fig. 9
show clearly that the latter process becomes slower at lower flow velocities. At the slowest flow speeds (black–red curve), a small amount of CH4remains in the measurement volume
at the end of the recording cycle, causing a transmittance < 1. The signal reaches 1 (no CH4) just before the next injection.
In conclusion, only tiny amounts of CH4(∼0.05 %) stay at
the measurement position until the next injection. This holds only for slow airflows. Higher flows remove all CH4in less
than 100 ms (green–blue curve in Fig. 9).
We showed in the previous section that a broadband trans-mittance value can be directly related to a CH4density or a λ-value of the CH4–air mixture using calculations based on
the HITRAN database and a calibration function. We limit the quantification of the λ-value to a maximum of λ=10 (∼1 % CH4–air), which corresponds to a transmittance of ∼0.96 at ambient conditions with this optical set-up. Al-though the sensor is able to resolve higher transmittances this upper limit suits typical engine applications, because higher
λ-values are barely of any interest. The results in the lower panel of Fig. 9 showing a different behaviour compared to the transmittance values due to the upper limit forλand its def-inition. The differences between high and low flow velocity are more pronounced. At highest velocity the injection ap-pears only as a narrow 12 ms wide peak. For slow velocities of 0.66 and 1.1 m s−1, the peak width is 320 and 200 ms, re-spectively. The initial drop reaches down to aλ-value around
λ=0.5 (∼17.4 vol % CH4) independent of flow velocity.
In summary, we have shown that the detection system as well as the HITRAN-based analysis model is capable of
Figure 10.Linear relation between measured and calculated trans-mittance from pressure cell experiments. The green line indicates perfect agreement.
quantifying CH4densities in gas flows under highly dynamic
conditions with high accuracy and precision. The achieved accuracy in theλ-value is on average better than 0.5 %. The acquired data suggest that the detection principle might also be applicable to the inlet manifold of an engine, where con-ditions are more complex and quantification can be difficult.
3.2 Engine experiments
After successful application and validation of the general op-tical layout of a sensor probe in an idealized flow channel environment, we proceed to the application of the measure-ment principle at the inlet manifold of an SI engine. For this purpose, we constructed a prototype sensor probe that allows stable attachment to an SI engine.
The first step before conducting engine experiments is the calibration of the HITRAN-based look-up table, which dif-fers from the one used in the flow channel experiments since the prototype probe assembly does not include any quartz windows. The results of the calibration measurements are shown in Fig. 10. Again, we plot measured versus calcu-lated transmittance values and find a linear relation between calculations and measurement, consistent with our previous observation. Since in a combustion chamber typical temper-atures are higher than in our pressure cell experiments, we validated that the calibration is independent of temperature (see Fig. 10 and caption). Further experiments with quan-tification of CH4 densities inside the combustion chamber
are subject to current research and will be considered in fu-ture publications. We apply a linear fit to obtain a calibration function in the form of Eq. (5). Here we consider only the part of the results in the transmittance range important in en-gine inlet manifolds. The linear fit gives a different result of
calibra-Figure 11.Normalized raw signal of CH4and CO2+H2O detec-tion channels for background measurement with ambient air(b)and measurement with premixed gas as well as the corrected CH4 sig-nal(a). The intensity fluctuations are likely caused by engine vibra-tions. Due to the similarities between CH4and CO2+H2O signals in the background measurement, the latter is used as a reference for signal correction.
tion at the flow channel and caused by the absence of quartz windows. It is interesting to note here that the calibration seems to be independent of temperature. The results for 300 and 473 K overlap considering the error bars of the individ-ual data points. Therefore, we can apply a single calibration that is valid for the complete temperature range of interest.
Normalized raw signals of the detector voltage from the engine validation experiments for background (ambient air) and actual (CH4–N2 mixture) measurement of CH4 and
CO2+H2O channels are shown in Fig. 11. The intensity
fluc-tuations are quite similar for both channels and we do not observe any significant absorption features in the CO2+H2O
channel. Consequently, the CO2+H2O channel can serve as
an offline reference for correction of the I0 signal of the
broadband transmittance. TheI0 signal without CH4in the
absorption region corresponds to the average signal of the CH4channel in a background measurement with ambient air.
Small signal variations between two measurements, e.g. due to variations in light intensity, are taken into account by com-paring the signal of the CO2+H2O in background and actual
measurement and determining a correction factor. Accord-ingly, the I0signal of the CH4channel results from the
av-erage detector signal in the background measurement multi-plied by the correction factor. The curves in Fig. 11 illustrate that both signals exhibit periodic fluctuations. We account for this modulation by applying a crank angle dependent correc-tion. In detail, we divide the CH4signal during the
measure-ment by the transmittance in the CO2+H2O channel for each
crank angle. Note that the CO2+H2O channel can be used as
a reference for signal correction, because premixed CH4–N2
Figure 12.Measuredλ-values for gas mixtures withλ=1.0 and
λ=4.06. The nominal value is depicted as a green line. The differ-ent colours indicate six differdiffer-ent measuremdiffer-ents taken under iddiffer-enti- identi-cal conditions. Here a 1◦crank angle at 800 rpm≈0.21 ms.
gas is used and therefore CO2 and H2O are absent and do
not influence the signal. In the case of fired engine operation and EGR entering the inlet manifold, an additional detection channel that is neither sensitive to CH4nor to exhaust gas is
required.
The crank angle resolved results for predefinedλ=4.06 andλ=1 mixtures are shown in Fig. 12. The green line in-dicates the nominal value of the premixed gas used. For both measurement series, we find small periodic and reproducible fluctuations which likely result from engine vibrations influ-encing the optical system of the probe. It was not possible to completely eliminate these fluctuations through the sig-nal correction procedure. We speculate that the fluctuations influence the coupling of light into the detection fibre that might result in wavelength dependent signal variations. A reference channel at a different wavelength cannot correct such wavelength dependent fluctuations. However, the fluc-tuations are rather small, with 0.3 % (0.4 %) inλ-values for
λ=1.0 (4.06) for the range−90–360◦CA.
Figure 13. (a)Measured pressure for all six measurements with
λ=1. The different colours indicate six different measurements taken under identical conditions. The inlet valve opens at −320◦ CA and closes at −124◦ CA.(b) Example of a typical pressure curve for the presented injection measurements at the four-cylinder engine test station. The pressure fluctuations are much smaller com-pared to validation experiments.
density from the measured transmittance is only weakly de-pendent on temperature, a wrong temperature induces a sig-nificant error in the calculation of the total gas density, which is required for calculation of the air–fuel ratio.
To estimate the precision of the measurements, we cal-culated the average measured λ-value and its 95 % confi-dence interval over all data points to beλ=3.96±0.1 and
λ=0.985±0.016, giving a precision of∼3 and∼2 %, re-spectively. The accuracy can be estimated by calculating the absolute value of the deviation to the nominalλ-value of the premixed gas for every data point and averaging the results. This gives an accuracy of∼2.5 and∼1.6 % for theλ=4.06 andλ=1.0 mixture, respectively. If we exclude the region at which we observe the drop in λ-value, which likely oc-curs from a temperature drop characteristic of the experimen-tal conditions, accuracy and precision improve even further. For the range from −90 to 360◦ CA, we achieve a preci-sion ofλ=0.994±0.015 (4.01±0.1) and accuracy of 0.8 % (1.4 %) forλ=1.0 (4.06).
The red curve of the λ=4.06 mixture in Fig. 12 is an exception and lies a few percent under the other measure-ments over the complete engine cycle. This variation is due to the high transmittance values around 95 % in these measure-ments and their sensitivity to variations of the background signal. The intensity of the light source and emission spec-trum varies over time due to small temperature fluctuations of the QTH lamp. This affects the calculation of broadband transmittance values from the recorded voltage signals. Thus, the real background signal in the actual measurement can differ from the recorded background signal if there is too
Figure 14.Normalized raw signal of CH4and exhaust detection channel for background and injection measurements. We find pe-riodic intensity fluctuations overlaying the detector signal likely caused by engine vibrations. The fluctuations are different for mo-tored(b)and fired(a)engine operations. Here a 1◦crank angle at 1000 rpm≈0.17 ms.
much time (e.g. a few minutes) between measurements. It is not possible to compensate for the difference completely through other detection channels. We found that a very small change of 0.15 % in the averaged background signal would be enough to put the red curve in Fig. 12 level with the other curves. This sensitivity in the background signal is a specific challenge of the validation experiments with premixed gases. Note that this likely is also a reason why there are remaining fluctuations after signal correction as mentioned above. In measurements with injection of CH4into the inlet manifold,
theI0signal can be directly extracted in every single engine
cycle at regions without CH4present, e.g. between closing of
the inlet valves and the start of the next injection.
We have to note here that the prototype probe suffers from internal reflections of the output window that produces an additional signal on the detectors (up to∼25 % of the over-all signal). Through adjustment of the optics this could be reduced to∼10 % of the overall signal. We overcome this problem by measuring the dark signal without a reflector and subtracting it from the signal during the measurements. How-ever, we find that there are signal variations, which influence the strength of the internal reflections, e.g. depending on the adjustment of the probe. This effect might lead to a deviation in the transmittance values for single measurements result-ing in a different quantification outcome. Consequently, there is still some uncertainty of the dark signal, and this matter will be addressed in an improved second-generation proto-type probe.
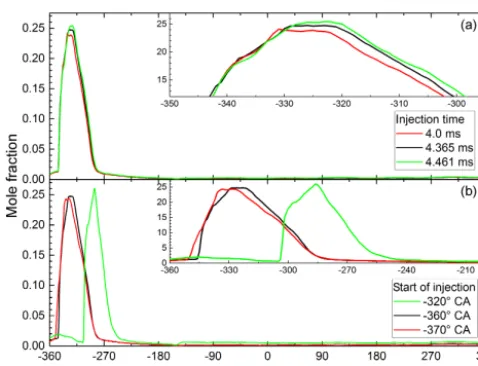
Figure 15.(a)Measurement results for different injection dura-tions.(b)Measurement results for different injection starting times. Here a 1◦crank angle at 1000 rpm≈0.17 ms.
to enable regular engine operation. The result is a different pressure curve as shown in the lower panel of Fig. 13, be-cause all four cylinders of the engine are now connected to each other. There are variations in pressure (∼3 %), but they are about 10 times smaller than in the validation measure-ments (∼30 %) and do not include a distinct drop. In con-clusion, we do not expect a significant temperature drop and thus no artificial effect on the result of the data analysis.
However, we find significantly stronger modulations on the raw signals of the detection channels (Fig. 14) than be-fore. These modulations likely result from engine vibrations and influences between all four cylinders now connected through the inlet manifold. Figure 14 shows the normalized signal of CO2+H2O and CH4channels for a measurement
with injection (upper panel) and without injection (back-ground, lower panel). Both detection channels suffer from the same harmonic variations having the same frequency but slightly different amplitudes. However, there is a phase shift between background and injection measurement indicated by the dashed blue lines. This shift is probably caused by the difference between motored and fired operation, supporting our hypothesis that the signal fluctuations result from en-gine vibrations. For the data analysis, we use the normalized CO2+H2O signal as mentioned earlier to correct the CH4
channel signal for these fluctuations. Here, we assume that during the short time of a single measurement the amount of CO2 and H2O in the ambient air is constant. Thus, we can
use this channel for signal correction.
After ensuring a good repeatability of the engine opera-tion through repetiopera-tion of measurements, we performed mea-surements with varying engine parameters. Instead of theλ -value, we show here the mole fraction, since otherwise ob-servations in regions with small amounts of CH4are hardly
visible. The upper panel of Fig. 15 shows the results for dif-ferent injection times. The injection starts at−360◦CA and a
cloud of CH4passes through the absorption path of the probe
soon afterwards (detection is located 5 cm downstream from injection). The differences between the injection times are rather small because they correspond to flammable mixtures (λ=0.96, 1.0 and 1.1) and a smooth engine operation. Still, the differences are clearly visible in the inset of Fig. 15.
Finally, we changed the start of injection as shown in the lower panel of Fig. 15 while operating the engine under sto-ichiometric conditions. The different injections naturally re-sult in different times the methane cloud passes the absorp-tion path. For the delay of the injecabsorp-tion start to−320◦ CA, which corresponds to the nominal opening of the inlet valve, a change in the shape of the cloud is also visible. This sug-gests some influence on the mixture formation in the inlet manifold, although the differences are rather small. This and the fact that a kind of methane cloud is visible in the measure-ments indicates that the mixture process in the inlet manifold in this particular example is comparatively weak.
4 Conclusion and outlook
We presented the development of an optical sensor system for time-resolved quantification of CH4densities in gas flows
based on non-dispersive IR absorption spectroscopy. The system defines a platform for mixture formation analysis in modern CNG-fuelled SI engines and serves as a diagnostic tool for development of combustion engines. The design of the optical set-up enables diagnostic measurements at the in-let manifold of a test station engine. Time-resolved broad-band transmittance measurements of CH4inside a flow
chan-nel, which serves as a model for an inlet manifold, showed that the time resolution is high enough to examine the be-haviour of a typical 7 ms injection. Simulations of expected broadband transmittance values using the HITRAN database show very good quantitative agreement with the experimen-tal data, with a maximum relative deviation of 1.1 %. Appli-cation of an empirical calibration further improves the agree-ment. The procedure allows for an accurate quantification of theλ-value during injection. It is important to note that the relation of detector signal and CH4 density depends on the
environmental conditions. This is in contrast to previous ap-plications in gasoline engines and makes CH4quantification
more challenging. Therefore, the knowledge of pressure and temperature is crucial in order to achieve the maximum mea-surement accuracy.
in-ternal reflections and vibrations. Some of them seem to de-pend on the engine operation conditions. Most fluctuations caused by engine vibrations can be corrected for using the signal from another detection channel as a reference. In en-gine applications, the constant temperature assumption is an-other source of error, especially if fast temperature changes caused by fast pressure changes or exhaust gases entering the inlet manifold occur. In summary, we have shown a function-ing prototype of an inlet manifold probe for mixture analy-sis in CNG engines, which is able to determine crank angle resolved fuel–air ratios with an accuracy of < 3 %. We note that despite only showing averaged results over several en-gine cycles, the system is capable of delivering diagnostic data on a single cycle basis. Future research will address the improvement of the prototype probe, the proper considera-tion of temperature effects in the data analysis as well as the detection and quantification of exhaust gases that might en-ter the inlet manifold from the combustion chamber or from external EGR.
We emphasize that the sensor system presented here is not limited to applications in automotive development. The basic concept is capable of measuring CH4densities in any flows
with high accuracy, precision and time resolution. More-over, a change in the bandpass filter enables the quantifi-cation of other IR-active molecular species like CO2, CO,
H2O, NH3 and NOx, especially if they are part of the
HI-TRAN database. Adjustment and validation of the quantifi-cation method would be required accordingly as well as char-acterization of spectral influences from optical components.
Data availability. The experiments and results shown in this pub-lication are strongly industry-related research. We explain our ex-perimental preparations and analysis steps in great detail in this work and are available for questions. Please understand that there-fore we do not publicly provide the underlying data and Matlab code used for analysis. Given individual requests by fellow researchers, we will of course consider making parts of the data available.
Competing interests. The authors declare that they have no con-flict of interest.
Acknowledgements. The authors would like to thank Volkswa-gen AG for their Volkswa-general support concerning the flow channel and the engine test station. The authors also gratefully acknowledge the support of the Federal Ministry of Education and Research (BMBF, Germany). Investigations were supported within the OMeGa-E (Optische Messung der Gemischbildung am Erdgasmotor) project, FKZ: 13N13035.
Edited by: J. Wöllenstein
Reviewed by: two anonymous referees
References
Bolshov, M. A., Kuritsyn, Y. A., and Romanovskii, Y. V.: Tunable diode laser spectroscopy as a technique for combustion diagnos-tics, Spectrochimica Acta Part B: Atomic Spectroscopy, 106, 45– 66, 2015.
Cheng, W. K., Galliot, F., and Collings, N.: On the Time Delay in Continuous In-Cylinder Sampling From IC Engines, in:SAE Technical Paper Series, SAE International, 1989.
Collings, N.: A New Technique for Measuring HC Concentration in Real Time, in a Running Engine, in: SAE Technical Paper Series, SAE International, 1988.
Deutsche-Energie-Agentur: Erdgas und Biomethan im künftigen Kraftstoffmix, 2011.
Dijk, M., Orsato, R. J., and Kemp, R.: The emergence of an electric mobility trajectory, Energy Policy, 52, 135–145, 2013.
Edwards, R., Larivé, J.-F., and Beziat, J.-C.: Well-to-Wheels Analysis of Future Automotive Fuels and Powertrains in the European Context, in: European Commission Joint Research Centre Scientific and Technical Reports, Eu-ropean Commission Joint Research Centre, available at: https://iet.jrc.ec.europa.eu/about-jec/sites/iet.jrc.ec.europa.eu. about-jec/files/documents/wtw3_wtw_report_eurformat.pdf (last access: 28 April 2017), 2011.
European-Parliament-and-Council: Regulation No 443/2009, setting emission performance standards for new passenger cars as part of the Community’s integrated approach to re-duce CO2 emissions from light-duty vehicles, available at: http://eur-lex.europa.eu/legal-content/EN/TXT/PDF/?uri= CELEX:02009R0443-20140408&from=EN (last access: 28 April 2017), 2009.
Faria, R., Moura, P., Delgado, J., and de Almeida, A. T.: A sus-tainability assessment of electric vehicles as a personal mobility system, Energy Conversion and Management, 61, 19–30, 2012. Galliot, F., Cheng, W. K., Cheng, C.-O., Sztenderowicz, M.,
Hey-wood, J. B., and Collings, N.: In-Cylinder Measurements of Residual Gas Concentration in a Spark Ignition Engine, in: SAE Technical Paper Series, SAE International, 1990.
Grosch, A., Beushausen, V., Thiele, O., and Grzeszik, R.: Crank An-gle Resolved Determination of Fuel Concentration and Air/Fuel Ratio in a SI-Internal Combustion Engine Using a Modified Op-tical Spark Plug, in: SAE Technical Paper Series, SAE Interna-tional, 2007.
Grosch, A., Beushausen, V., Wackerbarth, H., Thiele, O., and Berg, T.: Temperature- and pressure-dependent midinfrared absorption cross sections of gaseous hydrocarbons, Appl. Opt., 49, 196., 2010.
Grosch, A., Beushausen, V., Wackerbarth, H., Thiele O., Berg, T., and Grzeszik, R.: Calibration of mid-infrared transmission mea-surements for hydrocarbon detection and propane concentration measurements in harsh environments by using a fiber optical sen-sor, J. Quant. Spectrosc. Ra., 112, 994–1004, 2011.
Grosch, A., Wackerbarth, H., Thiele, O., Berg, T., and Beckmann, L.: Infrared spectroscopic concentration measurements of carbon dioxide and gaseous water in harsh environments with a fiber op-tical sensor by using the HITEMP database, J. Quant. Spectrosc. Ra., 133, 106–116, 2014.
by: Saad, M. and Harrington, J. A., SPIE-Intl Soc Optical Eng., doi:10.1117/12.372805, 1999.
Hall, M. J., Zuzek, P., and Anderson, R. W.: Fiber Optic Sensor for Crank Angle Resolved Measurements of Burned Gas Residual Fraction in the Cylinder of an SI Engine, in: SAE Technical Paper Series, SAE International, doi:10.4271/2001-01-1921, 2001. International-Energy-Agengy: Key World Energy Statistics, 2016. Klingbeil, A. E., Jeffries, J. B., and Hanson, R. K.:
Temperature-and pressure-dependent absorption cross sections of gaseous hy-drocarbons at 3.39 µm, Meas. Sci. Technol., 17, 1950–1957, 2006.
Koenig, M. and Hall, M. J.: Measurements of Local In-Cylinder Fuel Concentration Fluctuations in a Firing SI Engine, in: SAE Technical Paper Series, SAE International, doi:10.4271/971644, 1997.
Koenig, M. H. and Hall, M. J.: Cycle-Resolved Measurements of Pre-Combustion Fuel Concentration Near the Spark Plug in a Gasoline SI Engine, in: SAE Technical Paper Series, SAE In-ternational, doi:10.4271/981053, 1998.
Korakianitis, T., Namasivayam, A. M., and Crookes, R. J.: Natural-gas fueled spark-ignition (SI) and compression-ignition (CI) en-gine performance and emissions, Progress in Energy and Com-bustion Science, 37, 89–112, 2011.
Kramer, U., Ferrera, M., Künne, H., Castro Moreira, D., and Mag-nusson, I.: Natural Gas/Methane Fuels: European Automotive Fuel Quality and Standardization Requirements, in: 10. Tagung Gasfahrzeuge, available at: http://www.gason.eu/documents/get_ doc/90 (last access: 28 April 2017), 2015.
Luong, M., Zhang, R., Schulz, C., and Sick, V.: Toluene laser-induced fluorescence for in-cylinder temperature imaging in internal combustion engines, Appl. Phys. B, 91, 669–675, doi:10.1007/s00340-008-2995-5, 2008.
Ma, H., Balthasar, F., Tait, N., Riera-Palou, X., and Harrison, A.: A new comparison between the life cycle greenhouse gas emissions of battery electric vehicles and internal combustion vehicles, En-ergy Policy, 44, 160–173, 2012.
Rothman, L. S., Gordon, I. E., Babikov, Y., Barbe, A., Benner, D. C., Bernath, P. F., Birk, M., Bizzocchi, L., Boudon, V., Brown, L. R., Campargue, A., Chance, K., Cohen, E. A., Coudert, L. H., Devi, V. M., Drouin, B. J., Fayt, A., Flaud, J.-M., Gamache, R. R., Harrison, J. J., Hartmann, J.-M., Hill, C., Hodges, J. T., Jacque-mart, D., Jolly, A., Lamouroux, J., Le Roy, R. J., Li, G., Long, D. A., Lyulin, O. M., Mackie, C. J., Massie, S. T., Mikhailenko, S., Müller, H. S. P., Naumenko, O. V., Nikitin, A. V., Orphal, J., Perevalov, V., Perrin, A., Polovtseav, E. R., Richard, C., Smith, M. A. H., Starikova, E., Sung, K., Tashkun, S., Tennyson, J., Toon, G. C., Tyuterev, V. G., and Wagner, G.: The HITRAN2012 molecular spectroscopic database, J. Quant. Spectrosc. Ra., 130, 4–50, 2013.
Schulz, C. and Sick, V.: Tracer-LIF diagnostics: quantitative mea-surement of fuel concentration, temperature and fuel/air ratio in practical combustion systems, Progress in Energy and Combus-tion Science, 31, 75–121, doi:10.1016/j.pecs.2004.08.002, 2005. Tomita, E., Kawahara, N., Nishiyama, A., and Shigenaga, M.: In situ measurement of hydrocarbon fuel concentration near a spark plug in an engine cylinder using the 3.392 m infrared laser absorption method: application to an actual engine, Meas. Sci.Technol., 14, 1357–1363, doi:10.1088/0957-0233/14/8/322, 2003a.
Tomita, E., Kawahara, N., Shigenaga, M., Nishiyama, A., and Dib-ble, R. W.: In situ measurement of hydrocarbon fuel concentra-tion near a spark plug in an engine cylinder using the 3.392 m in-frared laser absorption method: discussion of applicability with a homogeneous methane–air mixture. Meas. Sci. Technol., 14, 1350–1356, doi:10.1088/0957-0233/14/8/321, 2003b.
Turrio-Baldassari, L., Battistelli, C., Conti, L., Crebelli, R., De Be-rardis, B., Iamiceli, A., Gambino, M., and Iannaccone, S.: Eval-uation of emission toxicity of urban bus engines: Compressed natural gas and comparison with liquid fuels, Sci. Total Environ., 355,64–77, 2006.