M E T H O D O L O G Y
Open Access
Analysis of breast milk fatty acid
composition using dried milk samples
Kristina Harris Jackson
1*, Jason Polreis
1, Laura Sanborn
1, David Chaima
2and William S. Harris
1,3Abstract
Background:The effect of breast milk fatty acid (FA) composition, particularly levels of docosahexaenoic acid (DHA), on infant health outcomes is unclear. Part of the reason for this is difficulties in collecting, storing and shipping milk samples to the laboratory. Here we report the validation of a dried milk spot (DMS) system to measure FA composition to help overcome these obstacles.
Milk FA were measured by gas chromatography and reported as percent of total FA; the FA of primary interest in this study were DHA and industrially producedtransFA (iTFA). Experiments were carried out using pooled milk samples from US (n= 5) and Malawian women (n= 50). Experiments compared liquid vs. DMS samples (n= 55), assessed stability of FA composition under different storage conditions (n= 5), and compared the results from two different labs using the same methods (n= 5).
Results:Both % DHA and % iTFA levels in liquid and DMS samples were strongly correlated (R2= 0.99 and 0.99, respectively,P< 0.0001). The % DHA in DMS samples was stable for up to four weeks at room temperature and up to three years at -80 °C; only slight deviations from the acceptable range of variability (±15 %) occurred in the 4 °C and -20 °C conditions for % DHA. The % iTFA was stable under all conditions. All % DHA and % iTFA were within 15 % of the referent when analyzed in two laboratories.
Conclusions:Valid FA composition values can be obtained from DMS samples using this robust collection and transport system which should facilitate studies of the role of milk FA composition in infant development.
Keywords:Breast milk, Docosahexaenoic acid, Assessment of nutritional status, Lactation, Infant and child nutrition, Maternal nutrition
Background
The effect of breast milk fatty acid (FA) composition on infant health outcomes is a promising area of research. Higher docosahexaenoic acid (DHA, C22:6n3) levels in milk have been linked to improved visual or neurological outcomes in term infants in several (but not all) studies [1, 2]. Milk DHA levels vary widely around the world [3] and are highly correlated to the mother’s intake of DHA-rich foods [4] or DHA/fish oil supplement use [5]. Similar to DHA, industrialtransFA levels (iTFA; C18:1t, C18:2n6t) in milk are highly related to the mother’s intake of foods containing trans fats, i.e. some processed foods and meats, because the body does not synthesize them [6]. Milk iTFAs were found to be inversely related to
long-chain polyunsaturated FA levels, including DHA, in a co-hort of German women [6]. iTFA has been shown to block the synthesis of DHA from its precursor, alpha-linolenic acid [7, 8]. Because DHA and iTFA levels in milk are largely diet-dependent (unlike most other milk FA), there is an opportunity for nutritional interventions to alter milk FA profile and determine the effects on infant outcomes. Research in this area, particularly in under-developed regions, has been hampered by difficulties in collecting, storing and shipping milk samples to the laboratory for analysis. Driedblood spots on antioxidant-treated filter paper have proven to greatly reduce logistical issues and subject burden during collection while pro-viding a reliable sample for FA analysis [9, 10]. Here we report on the validation of a driedmilk spot (DMS) sys-tem for determining milk FA composition that can help overcome some of these same obstacles.
* Correspondence:[email protected]
1OmegaQuant Analytics LLC, Sioux Falls, SD, USA
Full list of author information is available at the end of the article
Methods
Sources of milk samples used in validation experiments
Pooled samples of liquid milk from US lactating women (n= 5) with a relatively wide range of DHA levels (0.05 to 0.42 % DHA) that had been submitted for routine FA ana-lysis were de-identified and used for method development. After the initial analysis, samples were stored at -80 °C until stability and validity experiments were conducted.
A second set of samples was collected in Malawi, Africa (n= 50) as part of a randomized trial of a lipid-based nutritive supplement (which did not include DHA or iTFA) for pregnant women [11]. The trial was per-formed according to Good Clinical Practice guidelines and the ethical standards of the Helsinki Declaration. The protocol was approved by the College of Medicine Research and Ethics Committee, University of Malawi and the Ethics Committee of Pirkanmaa Hospital District, Finland. This trial was registered at clinicaltrials.gov with the identifier NCT01239693.
Breast milk samples from Malawi were collected at participants’ homes by following milk expression in-structions that were given by female sample and data collectors. The mothers expressed the milk into clean plastic cups, which was immediately mixed thoroughly with a clean plastic spoon. Ten milliliters of milk was collected from this mixture into a clean falcon tube (the rest was given back for the child) and placed on ice for at most one hour. This was then taken to a satellite laboratory and aliquoted into five, 2 ml cryovials. These were stored temporarily at the satellite laboratory at -20 °C for no more than 2 days after which they were taken to a central sample arch-ive laboratory and placed at -80 °C for long-term storage. The samples were shipped to the US on dry ice in accordance with International Air Transport Association sample shipment instructions.
Preparation of dried milk spots (DMS)
All DMS samples were prepared in the laboratory by placing two drops (≈50 uL) of thawed milk on absorb-ent paper (Ahlstrom 226, PerkinElmer, Greenville, SC) pretreated with OxyStop®, a proprietary antioxidant cocktail which delays oxidation of FA in dried whole blood [12].
Laboratory methods
A hole punch from the DMS card or 12.5 uL of thawed liquid milk were combined (1:40 parts) with the methy-lating mixture [boron trifluoride in methanol (14 %), toluene and methanol (35/30/35 v/v)], shaken and heated at 100 °C for 45 min. After cooling, 40 parts of both hexane and distilled water were added. After briefly vortexing the samples were spun to separate layers, and an aliquot of the hexane (upper) layer which contained
the FA methyl esters was taken for analysis by gas chro-matography (Shimadzu 2010; SP2560, 100-m column) as described previously [12]. Data are expressed as a per-cent of total identified FA; a total of 26 FA between C10:0 – C22:6n-3 were identified. With each batch of DMS samples analyzed, two controls (one high and one low in DHA) were run. A 3-point standard curve was run at the beginning of each batch from which DHA levels of the unknowns were determined. Pure standards had been used to confirm the identities of DHA and iTFA, and additional confirmation has been made using gas chromatography-mass spectroscopy in our method development. The CVs for DHA were 6.0 % and iTFA 3.8 %.
Validation of liquid vs. dried milk spot fatty acid profile
Fifty-five samples of milk from Malawian and US mothers were used to compare the FA composition of liquid vs. DMS. To make DMS samples, 1iquid milk samples were thawed and one drop of milk was placed on the collection cards. Then the DMS samples were stored at room temperature in the dark for one week before analysis (to simulate the approximate time from collection to analysis in the field). The liquid samples analyzed immediately after thawing.
Stability of fatty acid profile in dried milk spots: varying time and temperature
The five pooled milk samples from US mothers were spotted onto pretreated cards. Several DMS cards from each pool were stored in the dark in reclosable plastic bags under each of the following conditions: room temperature (23 °C), refrigeration (4 °C), standard freezer (-20 °C), and research freezer (-80 °C). At Days 4, 7, 14, 21, and 28, DMS from the first three storage tem-peratures were analyzed for FA composition; the Day 0 sample was analyzed immediately after spotting and served as a reference. Additionally, DMS stored at -20 °C and -80 °C were tested at months 3, 6, 9, and 12, and then every 6 months for up to 3 years.
Interlab validation
Pooled milk samples from five US mothers were placed on DMS cards and sent by express mail at ambient temperature to an affiliated lab in Seoul, South Korea (OmegaQuant Asia). Identical DMS samples were saved at OmegaQuant Analytics in Sioux Falls, SD. Sample analysis was coordinated to be done on the same day (about 1 week after shipping). Identical methods were used in both laboratories.
Statistical methods
GraphPad Prism 6 (GraphPad software, San Diego, CA, USA). The primary FA of interest were DHA (C22:6n-3) and iTFA (C18:1t plus C18:2t). If necessary, the FA were log-transformed to meet normality requirements. Spearman correlations, linear regression, and paired t-tests were used to compare the liquid and DMS sam-ples. Correlations between liquid and dry milk samples were calculated across the full range of DHA values, and for only those samples with DHA < 1.0 %. The latter is the range in which the vast majority of milk DHA levels lies worldwide [3]. For the stability and inter-lab validation studies, an acceptable range of 15 % of the FA baseline or reference value was determined, as per FDA guidelines [13]. If the FA value remained within the acceptable range over time and in different temperature conditions, it was con-sidered stable. In addition, the entire FA profile was assessed for validity and stability and presented in the Additional files.
Results
Validation of liquid vs. DMS FA profile
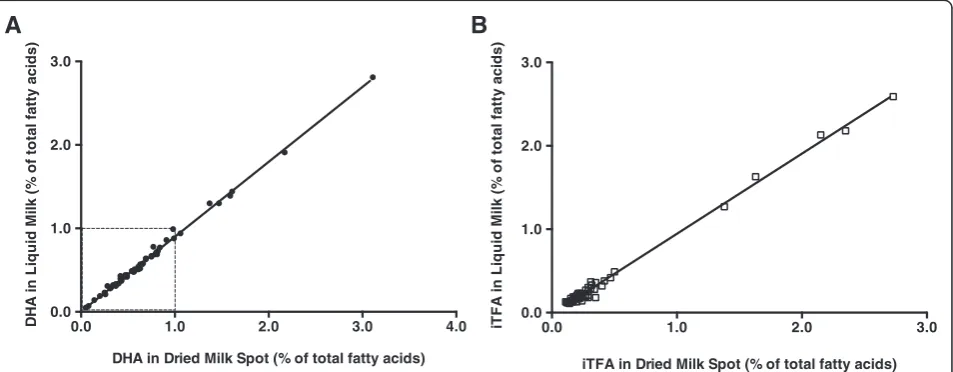
The % DHA of the liquid and DMS samples were highly correlated for both the whole set (R = 0.998, P< 0.0001, Fig. 1a) and a subgroup with less than 1 % DHA (R = 0.991, P< 0.0001, Fig. 1a). The mean % DHA value was signifi-cantly different between the liquid and DMS samples (0.62 ± 0.47 % vs. 0.69 ± 0.52 %, respectively, P< 0.0001). The linear regression equation to estimate the liquid milk % DHA using DMS data was: Liquid % DHA = 0.8974 (DMS % DHA) – 0.0015 (R2= 0.996, P< 0.0001). For the < 1 % DHA subset, the regression equation was:
Liquid % DHA = 0.9116 (DMS % DHA) – 0.0054
(R2= 0.981,P< 0.0001).
The % iTFA from the liquid and DMS samples were also highly correlated (R = 0.997, P< 0.0001, Fig. 1b). The mean % iTFA value was significantly different be-tween liquid and DMS samples (0.37 ± 0.53 % vs. 0.40 ± 0.55 %, respectively,P< 0.0001). The regression equation to estimate liquid % iTFA from DMS was: Liquid % iTFA = 0.9605 (DMS % iTFA) - 0.0146 (R2= 0.994, P< 0.0001). There was a greater than 15 % difference be-tween the liquid and DMS samples for six FA (C16:1n7t, C18:1 t, C20:0, C22:0, C24:0, C22:5 n-3; see Additional file 1); however, each of these FA had a mean relative abundance of < 2.5 % of total FA.
Stability of FA profile in DMS over time at four temperatures
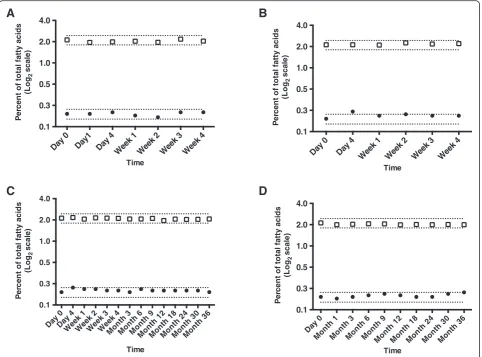
Compared to day 0, % DHA stayed within the acceptable range at all time points in the room temperature (23 °C) condition for up to 4 weeks or in the -80 °C freezer con-dition for up to 3 years (Fig. 2). The % DHA increased slightly over the acceptable range at 4 days in both the refrigeration (4 °C) and -20 °C freezer conditions but otherwise remained stable within the acceptable range for four weeks and three years, respectively. In all condi-tions at all time points % iTFA was stable. Data from all other FA are presented in Additional files 2, 3, 4 and 5.
Interlab comparison
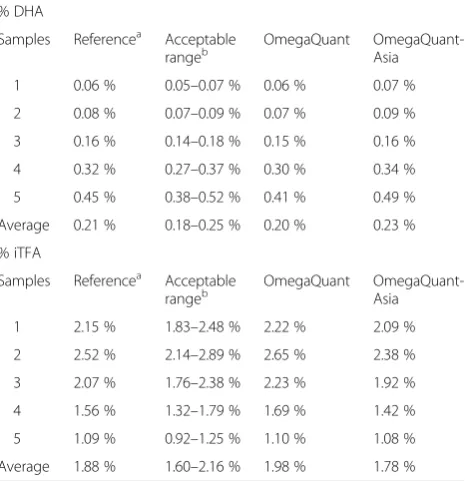
The % DHA and % iTFA values from five samples an-alyzed at both OmegaQuant and OmegaQuant–Asia were within 15 % of the referent (Table 1).
0.0 1.0 2.0 3.0 4.0
0.0 1.0 2.0 3.0
DHA in Dried Milk Spot (% of total fatty acids)
DHA i
n
L
iq
u
id
M
il
k
(
%
o
f t
o
ta
l f
a
tt
y
a
c
id
s
)
0.0 1.0 2.0 3.0
0.0 1.0 2.0 3.0
iTFA in Dried Milk Spot (% of total fatty acids)
iT
F
A
i
n
L
iq
u
id
Mi
lk
(%
o
f to
ta
l fa
tty
a
c
id
s
)
A
B
Fig. 1Comparison of liquid with dried milk spot for % DHA (a) and %iTFA (b;n= 55). Regression equations for the whole cohort: Liquid % DHA = 0.8974 (DMS % DHA)–0.0015 (R2= 0.996,
P< 0.0001) and Liquid % iTFA = 0.9605 (DMS % iTFA) - 0.0146 (R2= 0.994,
P< 0.0001). For the subset of samples less than 1 % DHA, the regression equation was: Liquid % DHA = 0.9116 (DMS % DHA)–0.0054 (R2= 0.981,
Discussion
This series of experiments demonstrate that DMS are a valid sample type to test breast milk FA composition, par-ticularly % DHA and % iTFA. The % DHA and % iTFA were highly correlated between the DMS and the liquid milk samples, the current standard for milk collection. Both % DHA and % iTFA were stable at room temperature and -80 °C for up to four weeks and three years, respectively. Fi-nally, affiliated labs using the same methods analyzed iden-tical DMS samples and achieved results within 15 % of the referent. A previous study found that milk FA composition could be measured using a DMS system, but no compari-sons with liquid milk or time/temperature stability data were reported [14]. These data suggest that under field re-search conditions, DMS can be collected, stored and shipped to a laboratory without loss of sample integrity.
Among the many bioactive components in milk [15], fats provide both a source of energy and indispensable building blocks in the form of essential FA, linoleic acid (n-6) and alpha-linolenic acid (n-3). Perhaps more importantly, it also
contains the long-chain metabolites arachidonic acid (n-6) and DHA (n-3), which are highly enriched in brain tissue. Likewise, there are unhealthful components that can be carried in milk that can come from diet, such as iTFA [6], or environmental contaminants such as persistent organic pollutants [16]. Unfortunately, DHA is particularly low in the milk of US mothers compared to many other countries (US average 0.20 % vs. worldwide average 0.32 %) [3, 17], and even in the relatively small comparison described here, the five US samples (which were intentionally pooled to span a“wide”range of DHA levels) had a mean DHA level of 0.20 % compared to the 0.74 % in the Malawian women. Similarly, iTFA levels were quite high in women from the US (1.98 %) compared with Malawi (0.24 %). Absent good quality dietary intake data in either cohort, one can only as-sume that DHA intakes are much higher and iTFA intakes lower in Malawi than in Sioux Falls, SD, US.
Higher DHA levels in milk (and/or corresponding mother and infant blood levels) have been found to be beneficial for neurodevelopment and vision in infants Day 0 Day1 Day 4Week 1 Week 2 Week 3 Week 4
0.1 0.3 0.5 1.0 2.0 4.0
Time
P
e
rc
e
n
t o
f to
ta
l fa
tty
a
c
id
s
(Log
2
scal
e)
Day 0Day 4Week 1Week 2Week 3Week 4
Month 3Month 6Month 9Month 12Month 18Month 24Month 30Month 36 0.1
0.3 0.5 1.0 2.0 4.0
Time
P
er
cen
t o
f t
o
tal
f
at
ty aci
d
s
(Log
2
scal
e)
Day 0 Day 4 Week 1 Week 2 Week 3 Week 4 0.1
0.3 0.5 1.0 2.0 4.0
Time
P
e
rc
e
n
t o
f to
ta
l fa
tty
a
c
id
s
(L
o
g2
scal
e)
Day 0
Month 1Month 3Month 6Month 9Month 12Month 18Month 24Month 30Month 36 0.1
0.3 0.5 1.0 2.0 4.0
Time
P
e
rc
e
n
t o
f to
ta
l fa
tty
a
c
id
s
(L
o
g2
scal
e)
A
B
C
D
Fig. 2% DHA and % iTFA from dried milk spots (n= 5) over time and in different storage conditions. Temperature Storagea, 23 °C [room temperature];
and young children in some studies, but the evidence is not conclusive [1, 2, 18]. Data from Tanzanian tribes with relatively stable lifetime fish intake have found that the mother avoids excessive depletion of her own DHA stores while breastfeeding if her erythrocyte DHA level is ~ 8 % of total FA, which corresponds to a milk DHA level of ~ 1 % [4]. There is not yet enough clinical evi-dence to recommend “optimal” DHA milk levels for healthy term infants. Premature infants, however, appear to benefit from milk with augmented DHA levels (either from DHA-enriched milk fortifier or mother’s DHA sup-plementation) because the infant misses out on signifi-cant DHA transfer during the third trimester, the period of greatest brain growth and placental DHA transport in pregnancy [19, 20]. Moreover, DHA may decrease the risk of (or help treat) common complications in premature infants, such as bronchopulmonary dysplasia, necrotizing enterocolitis and retinopathy of prematurity [20].
A limitation of this validation study was the use of DMS samples that had been frozen as liquid milk, thawed then spotted onto the filter paper rather than spotted fresh. Due to the timing of the initiation of our collaboration with the research team, it was not possible to do the analyses on fresh samples. However, FA in liquid milk samples stored at -80C are stable and simu-lating the DMS using thawed milk and storing for 1 week
at room temperature still demonstrates the value of DMS compared to traditional collection and storage methods.
Difficulties in collecting, storing and transporting milk samples, particularly in field research, have limited ad-vancements in this area. The method described here had the potential to overcome some of these challenges. One limitation of the DMS method is that (at present), the concentration of FA in milk (e.g., mg/mL) cannot be measured, only the percent composition. However, few researchers in this field would consider this a limitation since the vast majority of milk FA researchers have used the percent composition approach. Its appeal lies in the robustness of the analytical method, the long tradition of use, and the ability to compare results between studies. In addition, since milk percent FA composition is relatively stable during a feed and throughout the day [21, 22], samples may be collected anytime during the day which allows for flexibility in study design. These considerations aside, the primary reason for measuring milk FA concentrations is to determine the total daily FA intake of the infant, and the difficulties associated with this determination are not insignificant. Whereas measuring concentrations per se is not difficult, it is very challenging to measure the other variables needed to calculate the total milk FA intake per day. These include the marked within-day and within-mother variations in both milk volume [23] and milk fat content [24], plus the practical difficulties of precisely determining how much milk the baby actually consumed on a given day. Because of these challenges, it has long been the practice researchers to express milk DHA status as a percent ra-ther than a concentration, which is doable with DMS samples.
Conclusion
Logistic challenges in collection, storage and transport of samples have impeded studies where simply measur-ing milk FA composition is the goal. The ability to col-lect samples as DMS instead of liquid milk and to store and ship at ambient temperature provides a cost-effective, practical alternative without compromising the quality of the FA data. In a parallel setting, driedblood spot samples have been used for the determination of blood FA composition for many years [9, 10] and has facilitated FA research [25], particularly in studies of infants and children [26, 27] and in subjects in remote locations [12]. The ability to measure folate, retinol and markers of inborn errors of metabolism (e.g. phenylke-tonuria) in dried blood spots has revolutionized research and testing in infants [28]. The ability to utilize DMS to measure milk FA (and perhaps other analytes) should facilitate more research on the role of FA nutrition in human development.
Table 1Comparison of % DHA and % iTFA values from
identical samples analyzed affiliated labs, OmegaQuant Analytics (Sioux Falls, South Dakota, US) and OmegaQuant-Asia (Seoul, South Korea)
% DHA
Samples Referencea Acceptable
rangeb
OmegaQuant
OmegaQuant-Asia
1 0.06 % 0.05–0.07 % 0.06 % 0.07 %
2 0.08 % 0.07–0.09 % 0.07 % 0.09 %
3 0.16 % 0.14–0.18 % 0.15 % 0.16 %
4 0.32 % 0.27–0.37 % 0.30 % 0.34 %
5 0.45 % 0.38–0.52 % 0.41 % 0.49 %
Average 0.21 % 0.18–0.25 % 0.20 % 0.23 %
% iTFA
Samples Referencea Acceptable
rangeb OmegaQuant OmegaQuant-Asia
1 2.15 % 1.83–2.48 % 2.22 % 2.09 %
2 2.52 % 2.14–2.89 % 2.65 % 2.38 %
3 2.07 % 1.76–2.38 % 2.23 % 1.92 %
4 1.56 % 1.32–1.79 % 1.69 % 1.42 %
5 1.09 % 0.92–1.25 % 1.10 % 1.08 %
Average 1.88 % 1.60–2.16 % 1.98 % 1.78 %
a
The reference values for % DHA and % TFA are the average of the values from each lab
b
Availability of data and materials
The datasets supporting the conclusions of this article are included in the Additional file 6.
Additional files
Additional file 1:Comparison of fatty acid composition measured in liquid and dried milk spots.Blue bars, liquid milk means ± 15 %; red bars, dried milk spot FA means. (PDF 63 kb)
Additional file 2:Fatty acids (C10:0–C22:6n-3) from dried milk spots stored at room temperature (23C) for 4 weeks.Error bars represent ± 15 % from baseline values. Fatty acids that represent < 3 % of total fatty acids are in the left panel; all others are in the right panel. Fatty acids with values exceeding 15 % of baseline at any time point: C10:0, C12:0, C20:0, C18:3n-3, C22:0, C20:3n-6, C24:0, C20:5n-3, C24:1n9, C22:4n-6, C22:5n-6, C22:5n-3. (PDF 144 kb)
Additional file 3:Fatty acids (C10:0–C22:6n-3) from dried milk spots stored in a refrigerator (4C) for 4 weeks.Error bars represent ± 15 % from baseline values. Fatty acids that represent < 3 % of total fatty acids are in the left panel; all others are in the right panel. Fatty acids with values exceeding 15 % of baseline at any time point: C16:1n7t, C18:3n-6, C20:3n-6, C18:3n-3, C22:0, C20:4n-6, C24:0, C20:5n-3, C24:1n9, C22:4n-6, C22:5n-6, C22:5n-3, C22:6n-3. (PDF 128 kb)
Additional file 4:Fatty acids (C10:0–C22:6n-3) from dried milk spots stored in a standard freezer (-20C) for 3 years.Error bars represent ± 15 % from baseline values. Fatty acids that represent < 3 % of total fatty acids are in the left panel; all others are in the right panel. Fatty acids with values exceeding 15 % of baseline at any time point: C10:0, C16:1n7t, C20:1n9, C18:3n-3, C20:2n-6, C22:0, C20:3n-6, C20:4n-6, C24:0, C20:5n-3, C24:1n9, C22:4n-6, C22:5n-6, C22:5n-3, C22:6n-3. (PDF 256 kb)
Additional file 5:Fatty acids (C10:0–C22:6n-3) from dried milk spots stored in a research-grade freezer (-80C) for 3 years.Error bars represent ± 15 % from baseline values. Fatty acids that represent < 3 % of total fatty acids are in the left panel; all others are in the right panel. Fatty acids with values exceeding 15 % of baseline at any time point: C10:0, C16:1n7t, C18:3n-6, C20:1n-9, C18:3n-3, C22:0, C20:3n-6, C20:4n-6, C24:0, C20:5n-3, C24:1n-9, C22:4n-6, C22:5n-6, C22:5n-3. (PDF 255 kb)
Additional file 6:Datasets.(XLSX 261 kb)
Abbreviations
DHA:docosahexaenoic acid; DMS: dried milk spot; FA: fatty acids; iTFA: industrialtransfatty acids.
Competing interests
WSH is the President of OmegaQuant Analytics, LLC, a research and commercial laboratory that uses dried milk and blood spot technology to assess fatty acid status, and all authors except for DC are employees of OmegaQuant. DC declares no conflict of interest.
Authors’contributions
WSH and JP conceived and designed the study. LS analyzed the milk samples. DC processed, stored and shipped milk samples from the Malawi cohort. KHJ performed the statistical analyses. KHJ and WSH drafted the manuscript. All authors approved of the manuscript and data presented.
Funding
This publication is based on research funded in part by a grant to the University of California, Davis from the Bill & Melinda Gates Foundation, with additional funding from the Office of Health, Infectious Diseases, and Nutrition, Bureau for Global Health, U.S. Agency for International Development (USAID) under terms of Cooperative Agreement No. AID-OAA-A-12-00005, through the Food and Nutrition Technical Assistance III Project (FANTA), managed by FHI 360. All other costs associated with this study were funded internally by OmegaQuant.
Author details
1OmegaQuant Analytics LLC, Sioux Falls, SD, USA.2Department of
Microbiology, University of Malawi, College of Medicine, Blantyre, Malawi. 3
Sanford School of Medicine, University of South Dakota, Sioux Falls, SD, USA.
Received: 17 November 2015 Accepted: 18 January 2016
References
1. Campoy C, Escolano-Margarit MV, Anjos T, Szajewska H, Uauy R. Omega 3 fatty acids on child growth, visual acuity and neurodevelopment. Br J Nutr. 2012;107 Suppl 2:S85–106.
2. Innis SM. Impact of maternal diet on human milk composition and neurological development of infants. Am J Clin Nutr. 2014;99:734S–41. 3. Brenna JT, Varamini B, Jensen RG, Diersen-Schade DA, Boettcher JA,
Arterburn LM. Docosahexaenoic and arachidonic acid concentrations in human breast milk worldwide. Am J Clin Nutr. 2007;85:1457–64.
4. Luxwolda MF, Kuipers RS, Koops JH, Muller S, De Graaf D, Dijck-Brouwer DA, et al. Interrelationships between maternal DHA in erythrocytes, milk and adipose tissue. Is 1 wt% DHA the optimal human milk content? Data from four Tanzanian tribes differing in lifetime stable intakes of fish. Br J Nutr. 2014;111:854–66.
5. Makrides M, Neumann MA, Gibson RA. Effect of maternal docosahexaenoic acid (DHA) supplementation on breast milk composition. Eur J Clin Nutr. 1996;50:352–7.
6. Szabo E, Boehm G, Beermann C, Weyermann M, Brenner H, Rothenbacher D, et al. Trans Octadecenoic acid and trans octadecadienoic acid are inversely related to long-chain polyunsaturates in human milk: results of a large birth cohort study. Am J Clin Nutr. 2007;85:1320–6.
7. Rosenthal MD, Doloresco MA. The effects of trans fatty acids on fatty acyl delta 5 desaturation by human skin fibroblasts. Lipids. 1984;19:869–74. 8. Mahfouz MM, Smith TL, Kummerow FA. Effect of dietary fats on desaturase
activities and the biosynthesis of fatty acids in rat-liver microsomes. Lipids. 1984;19:214–22.
9. Marangoni F, Colombo C, Galli C. A method for the direct evaluation of the fatty acid status in a drop of blood from a fingertip in humans: applicability to nutritional and epidemiological studies. Anal Biochem. 2004;26:267–72. 10. Metherel AH, Hogg RC, Buzikievich LM, Stark KD. Butylated hydroxytoluene
can protect polyunsaturated fatty acids in dried blood spots from degradation for up to 8 weeks at room temperature. Lipids Health Dis. 2013;12:22.
11. Ashorn P, Alho L, Ashorn U, Cheung YB, Dewey KG, Harjunmaa U, et al. The impact of lipid-based nutrient supplement provision to pregnant women on newborn size in rural Malawi: a randomized controlled trial. Am J Clin Nutr. 2015;101:387–97.
12. Johnston DT, Deuster PA, Harris WS, Macrae H, Dretsch MN. Red blood cell omega-3 fatty acid levels and neurocognitive performance in deployed U.S. Servicemembers. Nutr Neurosci. 2013;6:30–8.
13. US Department of Health and Human Services, Food and Drug Administration, Center for Drug Evaluation and Research, Center for Veterinary Medicine.Guidance for Industry: Bioanalytical Method Validation. 2001. http://www.fda.gov/downloads/Drugs/Guidance/ucm070107.pdf Accessed October 2015.
14. Ichihara K, Waku K, Yamaguchi C, Saito K, Shibahara A, Miyatani S, et al. A convenient method for determination of the C20-22 PUFA composition of glycerolipids in blood and breast milk. Lipids. 2002;37:523–6.
15. Ballard O, Morrow AL. Human milk composition: nutrients and bioactive factors. Pediatr Clin North Am. 2013;60:49–74.
16. Nickerson K. Environmental contaminants in breast milk. J Midwifery Womens Health. 2006;51:26–34.
17. Yuhas R, Pramuk K, Lien EL. Human milk fatty acid composition from nine countries varies most in DHA. Lipids. 2006;41:851–8.
18. Jensen CL, Lapillonne A. Docosahexaenoic acid and lactation. Prostaglandins Leukot Essent Fatty Acids. 2009;81:175–8.
19. Baack ML, Norris AW, Yao J, Colaizy T. Long-chain polyunsaturated fatty acid levels in US donor human milk: meeting the needs of premature infants? J Perinatol. 2012;32:598–603.
22. Gibson RA, Kneebone GM. Effect of sampling on fatty acid composition of human colostrum. J Nutr. 1980;110:1671–5.
23. Daly SEJ, Di Rosso A, Owen RA, Hartmann PE. Degree of breast emptying explains changes in the fat content, but not fatty acid composition, of human milk. Exp Physiol. 1993;78:741–55.
24. Ruel MT, Dewey KG, Martinez C, Flores R, Brown KH. Validation of single daytime samples of human milk to estimate the 24-h concentration of lipids in urban Guatemalan mothers. Am J Clin Nutr. 1997;65:439–44. 25. Sarter B, Kelsey KS, Schwartz TA, Harris WS. Blood docosahexaenoic acid and
eicosapentaenoic acid in vegans: Associations with age and gender and effects of an algal-derived omega-3 fatty acid supplement. Clin Nutr. 2015;34:212–8.
26. Wolters M, Schlenz H, Foraita R, Galli C, Rise P, Moreno LA, et al. Reference values of whole-blood fatty acids by age and sex from European children aged 3-8 years. Int J Obes (Lond). 2014;38 Suppl 2:S86–98.
27. Nobili V, Alisi A, Della Corte C, Rise P, Galli C, Agostoni C, et al. Docosahexaenoic acid for the treatment of fatty liver: randomised controlled trial in children. Nutr Metab Cardiovasc Dis. 2013;23:1066–70. 28. McDade TW, Williams S, Snodgrass JJ. What a drop can do: Dried blood spots as a minimally invasive method for integrating biomarkers into population-based research. Demography. 2007;44:899–925.
• We accept pre-submission inquiries
• Our selector tool helps you to find the most relevant journal • We provide round the clock customer support
• Convenient online submission • Thorough peer review
• Inclusion in PubMed and all major indexing services • Maximum visibility for your research
Submit your manuscript at www.biomedcentral.com/submit