DOI 10.1007/s13174-010-0012-9
S P E C I A L I S S U E : M I D D L E WA R E
Sizing multi-tier systems with temporal dependence: benchmarks
and analytic models
Ningfang Mi·Giuliano Casale·Ludmila Cherkasova· Evgenia Smirni
Received: 7 March 2010 / Accepted: 8 August 2010 / Published online: 21 September 2010 © The Brazilian Computer Society 2010
Abstract Temporal dependence, as a synonym for bursti-ness, is often found in workloads (i.e., arrival flows and/or service times) in enterprise systems that use the multi-tier paradigm. Despite the fact that burstiness has deleterious effects on performance, existing modeling and benchmark-ing techniques do not provide an effective capacity plannbenchmark-ing for multi-tier systems with temporal dependence. In this paper, we first present strong evidence that existing mod-els cannot capture bursty conditions and accurately predict performance. Therefore, we propose a simple and effective sizing methodology to integrate workload burstiness into models and benchmarking tools used in system sizing. This modeling methodology is based on the index of dispersion which jointly captures variability and burstiness of the ser-vice processin a single number. We report experimentation on a real testbed that validates the accuracy of our model-ing technique by showmodel-ing that experimental and model pre-diction results are in excellent agreement under both bursty
This work was partially supported by NSF grants CNS-0720699 and CCF-0811417, a gift from HP Labs, and the Imperial College JRF fellowship.
N. Mi (
)Northeastern University, Boston, MA, USA e-mail:[email protected]
G. Casale
Imperial College London, London, UK e-mail:[email protected]
L. Cherkasova
HP Labs, Palo Alto, CA, USA e-mail:[email protected]
E. Smirni
College of William and Mary, Williamsburg, VA, USA e-mail:[email protected]
and non-bursty workloads. To further support the capacity planning process under burstiness, we propose an enhanced benchmarking technique that can emulate workload bursti-ness in systems. We find that most existing benchmarks, like the standard TPC-W benchmark, are designed to assess sys-tem performanceonlyunder non-bursty conditions. In this work, we rectify this deficiency by introducing a new mod-ule into existing benchmarks, which allows to inject bursti-ness into the arrival stream in a controllable and repro-ducible manner by using the index of dispersion as a single turnable knob. This approach enables a better understand-ing of system performance degradation due to burstiness and makes a strong case for the usefulness of the proposed benchmark enhancement for capacity planning of enterprise systems.
Keywords Enterprise system·Capacity planning· Temporal dependence·Burstiness·Performance benchmarking
1 Introduction
the best offer, but also in e-business sites as a result of spe-cial offers and marketing campaigns. Burstiness or tempo-ral surges in the incoming requests in an e-commerce server generally turns out to be catastrophic for performance, lead-ing to dramatic server overloadlead-ing, uncontrolled increase of response times and, in the worst case, service unavailabil-ity. Similarly, a footprint of burstiness in system workloads is the presence of short uneven peaks in utilization mea-surements, which indicate that the server periodically faces congestion. In multi-tier systems, congestion may arise by the superposition of several events including database locks, variability in service time of software operations, mem-ory contention, and scheduling characteristics. The above events interact in a complex way with the hardware and soft-ware systems involved and with the incoming requests, of-ten resulting in short congestion periods where the entire ar-chitecture is significantly slowed down. For example, even for multi-tier systems where the database server is highly-efficient, a locking condition on a database table may slow down the service of multiple requests that try to access the same data and make the database the bottleneck server for an extended period of time. During that period of time, the data-base performance dominates the performance of the overall system, while most of the time another resource, e.g., the ap-plication server, may be the primary cause of delays in the system. Thus, the performance of the multi-tier system can vary in time depending on which is the current bottleneck resource and can be significantly conditioned by dependen-ciesbetween servers. For effective capacity planning under bursty workload conditions, capturing this time-varying bot-tleneck switchin multi-tier systems and its performance im-plications becomes highly critical.
In this paper, we discuss techniques for effective capac-ity planning under bursty workload conditions that review and extend recent work in the area [13,30,31]. After illus-trating that existing models of multi-tier architectures can be unacceptably inaccurate if the processed workloads exhibit burstiness, we describe how to integrate workload burstiness in performance models and discuss a validation on an archi-tecture subject to TPC-W workloads with different bursti-ness profiles. The methodology is based on the index of dispersionmetric [19], which is a classic indicator for sum-marizing burstiness in a time series. Using the index of dis-persion together with other two parameters, i.e., mean and 95th percentile of service demands, we show that the accu-racy of the model prediction can be increased by up to 30% compared to standard queueing models parameterized only with mean service demands.
To further support the capacity planning process under burstiness, we propose a contribution in benchmarking tech-niques that can emulate the behavior of workload bursti-ness in systems. Benchmarking is a critical step for effective capacity planning and resource provisioning. An effective
benchmark should evaluate the system responsiveness un-der a wide range of client demands from low to high, but most existing benchmarks are designed to assess the system responsiveness under asteadyclient demand.
We propose to inject burstiness in systems using a sim-ple two-state Markov-modulated processes [34] to regulate the arrival rate of requests to the system. These processes are variations of the popular ON/OFF traffic models used in net-working and can be easily shaped to create correlated inter-arrival times. In particular, Markov-modulated processes capture very well the time-varying characteristics of a work-load and describe fluctuations at different timescales, e.g., both variability between different surges and fluctuations within the same traffic surge. Starting from this basic idea, we define a modified TPC-W benchmark where sequences of surges with different intensities and durations are cre-ated. Consistently with the model-based capacity planning methodology we discuss, the user can describe burstiness in experiment based on the index of dispersion that con-trols the degree of burstiness in the system. The existence of asingle parameter to tune burstiness greatly simplifies system benchmarking and allows for a flexible evaluation. We use the index of dispersion to modulate dynamically the think times of users between submission of consecutive re-quests. Since this approach is independent of the specific nature of the requests sent to the system and only changes their inter-arrival times, our approach can be easily general-ized to benchmarks other than TPC-W. In addition, the use of a single parameter for burstiness tuning makes it simple to implement and reproduce the same experiment on different systems, thus enabling the autonomic comparison of client– server performance across different architectures. Using a TPC-W testbed, we show experimentally that this method-ology enables to stress the architecture at different levels of performance degradation, thus making the point of being a useful tool for performance robustness assessment of real web systems. We have also released the modified TPC-W at http://www.cs.wm.edu/~esmirni/tpcw_codes/.
planning and resource provisioning is presented in Sect.5. Finally, Sect.6draws conclusions.
2 Burstiness impact and index of dispersion
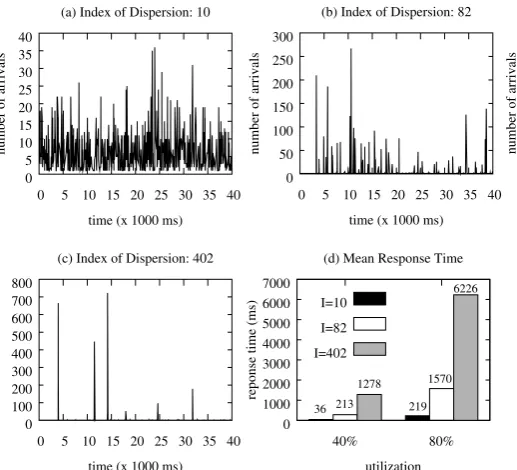
In this section, we consider some examples to illustrate the importance of burstiness in performance models and the impact of bursty processes on system performance. Here, we generate three workload traces such that inter-arrival times in each trace are generated from a 2-state Markov-Modulated Poison Process (MMPP(2)) with the same mean λ−1 = 10 ms and squared coefficient-of-variation SCV=10, but different burstiness profiles.
Figure1(a)–(c) presents the number of incoming arrivals during every 10 ms under these three workloads, respec-tively. Although three traces have the same variability, a burst of requests aggressively aggregates during a short pe-riod in Fig. 1(b)–(c), while no temporal surges exist in Fig.1(a) as requests come in random points of the trace. Par-ticularly, Fig.1(c) shows the strongest burstiness case with almost all incoming requests clustering within several short congestion periods. Therefore, we use the term “burstiness” to indicate traces that are not just “variable” as the sam-ple in Fig.1(a), but also aggregate in “bursty periods” as in Fig.1(b)–(c).
In order to disclose the performance impact of the bursti-ness, we run simulations of atrace/M/1 queue such that re-quest arrival times to the server are obtained from the three inter-arrival time traces in Fig.1 and request service times follow an exponential distribution with mean μ−1=4 ms and 8 ms. As a result, we evaluate the performance of this
trace/M/1 queue under two system loads, i.e., utilizations ρ=40% and ρ=80%, respectively. We also remark that workload burstiness rules out independence of service time samples, thus the classic Pollaczek–Khinchin formula for theG/M/1 does not apply and the performance isnotonly determined by mean and squared coefficient-of-variation.
Figure1(d) depicts the mean response times for the inter-arrival times traces with different burstiness profiles, i.e., I =10, 82, and 402, as shown in Fig. 1(a)–(c). Irrespec-tively of the identical service time distribution, burstiness in workload traces dramatically degrades the system per-formance and thus clearly has paramount importance for queueing prediction. For example, when the system is un-der median load (e.g., 40% utilization), the mean response time for the high variable but non-bursty trace in Fig.1(a) is not high, but as the dispersion of the burstiness increases, the mean response time becomes approximately 7 and 40 times higher for the traces in Fig.1(b) and (c), respectively. Fur-thermore, the performance degradation is monotonically in-creasing as the observed burstiness increases. Therefore, it is critically important to discriminate the behaviors in Fig.1(a)–(c) with a quantitative index. Overall, the results in Fig.1clearly give intuition that we really need burstiness in performance models.
Furthermore, the burstiness in workloads, such as the inter-arrival times in Fig.1, can be characterized by the in-dex of dispersionI [15,19]. This is a standard burstiness index used in networking [19], which we apply here to the characterization of workload burstiness in multi-tier applica-tions. To the best of our knowledge, the index of dispersion, while being successfully used in modeling of networking ap-plications, has not been previously applied to modeling of enterprise multi-tier applications.
Fig. 1 Three workload traces with MMPP(2) distribution (meanλ−1=10 ms,
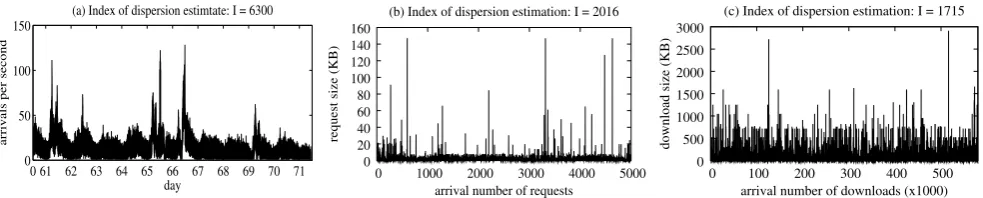
Fig. 2 Burstiness of (a) arrivals to server 0 in the 1998 FIFA World Cup trace over ten consecutive days, (b) Google HTTP request sizes logged by New York, NY IRCache server over two days, i.e.,
Janu-ary 9, 2007 and JanuJanu-ary 10, 2007, and (c) static object download sizes of the HTTP servers at Politecnico di Milano—DEI between Septem-ber 17, 2006 and SeptemSeptem-ber 24, 2006
The characterization of time series with burstiness re-quires techniques for the statical description of the order in which requests appear in a trace. This topic has been inves-tigated by several works in the literature, a survey of the most popular descriptors can be found in [22]. Here, we focus on the asymptotic index of dispersion I as a met-ric for characterizing burstiness. Consider a set of n jobs having inter-arrival timesX1, X2, . . . , Xn, and define:An= X1+X2+ · · · +Xnas the total duration of work imposed on the system by thenjobs. We can define the index of dis-persion as the asymptotic limit
I= lim
n→+∞In=n→+∞lim
E[(An−E[An])2] nE[Xn]2 ,
where the argument is the index of dispersion for intervalsIn [4]. Noting thatE[An] =nE[Xn], it is immediate to see that InE[Xn]is a relative squared deviation ofAnfrom expecta-tion, thusI may be seen as a quantifier of the magnitude in fluctuations in an asymptotically large time-series with unit mean.
Other definitions of the index of dispersion of an ar-rival process are useful for understanding the metric. Call SCV=Var(Xn)/E[Xn]2the squared coefficient of variation of the inter-arrival times and denote withρk the lag-k auto-correlations fork≥1; then the index of dispersion can be written as follows:
I=SCV
1+2
∞
k=1 ρk
. (1)
The joint presence ofSCV and autocorrelations inI is suf-ficient to distinguish between traces like those in Fig.1(a)– (c), as we have reported in the figure title. As the name sug-gests, the dispersion of the bursty periods increases as the values ofI grow because the sum of autocorrelation in (1) is maximal. But, when the correlations become statically neg-ligible, the index of dispersion only captures the character-ization of variability with no burstiness presented in work-loads. The value ofI thus approaches the one ofSCV, as shown in Fig.1(a).
We further give three examples of real world situations where burstiness exists and the index of dispersion well cap-tures the intensity of traffic surges. The first real workload is the 1998 FIFA World Cup website trace available at [5] over a period of ten days, presenting that dramatic traffic surges connected to sport events can reach values of I slightly larger than 6300,1 see Fig.2(a). We remark that although the 1998 FIFA World Cup trace is an old web workload, many characteristics including burstiness persist in recent years [46]. We also examined two recently collected web traces: one logged by the New York, NY IRCache server over two days in January, 2007, shows that the number of bytes written to the client byGoogleare not only variable but also bursty, resulting in the estimation ofI greater than 2000, see Fig.2(b); and the other was collected from Po-litecnico di Milano—DEI between September 17, 2006 and September 24, 2006, showing the large static objects (e.g., gif and jpg image files) aggregated in “bursty periods” with the estimated value ofI more than 1715, see Fig. 2(c). In summary, the index of dispersionI can be used as a mea-sure of burstiness in workloads and will be introduced for evaluating multi-tier architectures in Sect.3and enhancing benchmarking techniques in Sect.4.
3 Service process: one source of burstiness
In this section, we first study one source of burstiness— service process—in a multi-tier enterprise application. Then we illustrate that traditional models of multi-tier architec-tures can be unacceptably inaccurate if the processed loads exhibit burstiness. We describe how to integrate work-load burstiness in performance models by using the index of dispersion and discuss a validation of the proposed tech-nique in a testbed of a multi-tier e-commerce site that is built according to the TPC-W specifications.
1Our analysis has focused on the server with label “0” during the period
going from day 61 to day 71. The estimation of the index of dispersion
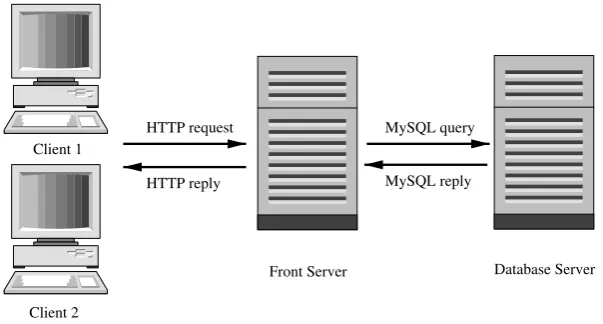
Fig. 3 E-commerce experimental environment
3.1 Burstiness in TPC-W
TPC-W is a widely used e-commerce benchmark that sim-ulates the operation of an online bookstore [18]. Typically, a multi-tier application uses a three-tier architecture para-digm, which consists of a web server, an application server, and a back-end database. A client communicates with this web service via a web interface, where the unit of activity at the client-side corresponds to a web page download. In a production environment, it is common that the web and the application servers reside on the same hardware, and shared resources are used by the application and web servers to gen-erate web pages. Thus, we opt to put both the web server and the application server on the same machine called the front server.2A high-level overview of the experimental setup is illustrated in Fig.3.
In general, a web page is composed by an HTML file and several embedded objects such as images. Since the HTTP protocol does not provide any means to delimit the begin-ning or the end of a web page, it is very difficult to ac-curately measure the aggregate resources consumed due to web page processing at the server side. Accurate CPU con-sumption estimates are required for building an effective ap-plication provisioning model but there is no practical way to effectively measure the service times forallpage objects. To address this problem, we define aclient transactionas a combination ofallprocessing activities that deliver an en-tire web page requested by a client, i.e., generate the main HTML file as well as retrieve embedded objects and per-form related database queries. Typically, a continuous pe-riod of time during which a client accesses a web service is referred to as aUser Sessionwhich consists of a sequence of consecutive individual transaction requests. Each client sends requests in the system with an average think time that represents the time between receiving a web page and the following page download request.
2We use terms “front server” and “application server” interchangeably
in this paper.
According to the TPC-W specification, the number of concurrent sessions (i.e., customers) or emulated browsers (EBs) is kept constant throughout the experiment. For each EB, the TPC-W benchmark statistically defines the user ses-sion length, the user think time, and the queries that are gen-erated by the session. In our experimental environment, two Pentium D machines are used to simulate the EBs. We also have one Pentium D machine serving as the front server, which is installed with Apache/Tomcat 5.5, and one Pen-tium D machine serving as the back-end database server, which is installed with MySQL 5.0. The database size is determined by the number of items and the number of cus-tomers. In our experiments, we use the default database set-ting, i.e., the one with 10,000 items and 1,440,000 customers in inventory.
There are 14 different transactions defined by TPC-W. In general, these transactions can be roughly classified of “Browsing” or “Ordering” type. Furthermore, TPC-W de-fines three standard transaction mixes based on the weight of each type in the particular transaction mix:
Transaction Transaction type
mix Browsing Ordering
Browsing mix 95% 5%
Shopping mix 80% 20%
Ordering mix 50% 50%
Fig. 4 The CPU utilization of the database server (dashed lines) and average queue length at the database server (solid lines) across time for (a) the browsing mix, (b) the shopping mix, and (c) the ordering
mix. In this figure, they-axis range of both performance metrics is the same because there are 100 EBs (clients) in the system. The monitoring window is 120 seconds
enables a tool to record processed transactions and their database calls over time as well as to measure their exe-cution time (both transactions and their database calls). We use the Diagnostics tool to measure the number of com-pleted requests nk in the kth period having a granularity of 5 seconds. We also use thesarcommand to obtain the utilizations of two servers across time with one second gran-ularity.
In TPC-W, for a typical request–reply transaction, the application server may issue multiple database calls while preparing the reply of a web page. This cascading effect of various tasks breaks down the overall transaction service time into several parts, including the transaction processing time at the application server as well as all related query processing times at the database server. Therefore, the ap-plication characteristics and the high variability in database server may cause burstiness in the overall transaction ser-vice times. To verify the above conjecture, we measure the queue length across time (see solid lines in Fig.4) and the CPU utilization across time (see dashed lines in Fig.4) at the database server under all three transaction mixes, where the transient queue length is recorded at each instance that the database request is issued by the application server and a prepared reply is returned back to the application server. Furthermore, in order to make the figure easy to read, we present the case with 100 EBs such that the queue length is within the range from 0 to 100 and thus they-axis range for both performance metrics (i.e., queue length and utiliza-tion) is the same. First, our conjecture is verified that for the browsing mix burstiness does exist in the queue length at the database server, where the queue holds less than 10 jobs for some periods, while sharply increases to as high as 90 jobs during other periods, see Fig. 4(a). More importantly, the burstiness in the database queue length exactly matches the burstiness in the CPU utilizations of the database server. Thus, at some periods almost all the transaction processing happens either at the application server (with the application server being a bottleneck) or at the database server (with the
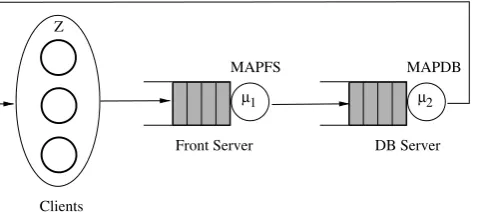
Fig. 5 A closed queueing network for modeling a multi-tier system
database server being a respective bottleneck). This leads to the alternated bottleneck between the application vs. the database servers. In contrast, for the shopping and the order-ing mixes, Figs.4(b) and (c) in the figure only show high variability in their utilizations but no burstiness in the queue length.
3.2 Limitation of traditional performance models
Traditionally, a multi-tier system can be modeled by a closed queueing network, e.g., composed of two queues and a delay center as shown in Fig.5, and can be solved with inexpen-sive algorithms, e.g., Mean Value Analysis (MVA) [38]; we refer to these models in the rest of the paper asMVA models. In the MVA model shown in Fig.5, the two queues are rep-resentative of the two servers in an enterprise system, i.e., the front server and the database server, respectively. The delay center is instead used to emulate the client activities, such that each server within the delay center models the user think time between receiving a web page and submitting a new page download request.3The two queues serve jobs ac-cording to a processor-sharing scheduling discipline.
3The main difference between a queue and a delay server is that the
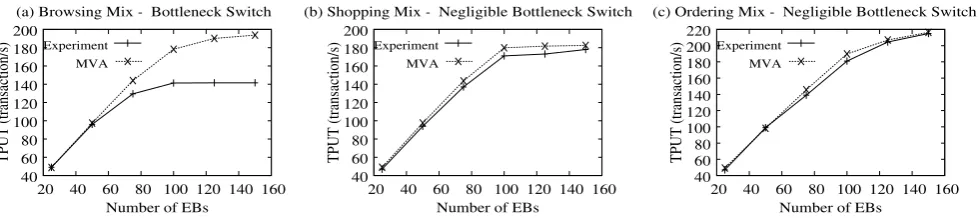
Fig. 6 MVA model predictions versus measured throughput
The proposed MVA model can be immediately parame-terized by (1) the mean service timeSFSandSDBof the front server and the database server, respectively, (2) the average user think timeZ, and (3) the number of emulated browsers (EBs). In TPC-W, a new session is generated inZ seconds (user think time) after completion of a previously-running user session: thus, the feedback-loop aspect of TPC-W is fully captured by the closed nature of the queueing network. The values of SFS andSDB can be determined with linear regression methods from the CPU utilization samples mea-sured across time at the two servers [48].
Figure6presents the results of the MVA model predic-tions versus the actual measured throughputs (TPUTs) of the system as a function of the number of EBs under the browsing, shopping, and ordering mixes. We observe that the MVA model prediction is quite accurate for the shop-ping and ordering mixes, see Fig.6(b) and (c). However, for the browsing mix, the MVA models obtain unacceptable in-accuracy with a large error up to 36% between the predicted and the measured throughputs, see Fig.6(a). This indicates that MVA models can deal very well with systemswithout burstiness (e.g., the ordering mix) and with systems where burstiness does not result in a bottleneck switch (e.g., the shopping mix). However, the fundamental and most chal-lenging case of burstiness reveals the limitation of the MVA modeling technique, see browsing mix in Fig.6(a). This is consistent with established theoretical results for MVA mod-els, which rule out the possibility of capturing the bottleneck switching phenomenon [8].
3.3 Performance models with burstiness
Although the mathematical definition of the index of disper-sionI in (1) is simple, this formulation is not practical for estimation because of the infinite summation involved and its sensitivity to noise. The estimation of the index of dis-persion is difficult due to well-known difficulty of estimating autocorrelations reliably [15]. Techniques for estimation of I based on sample measurements are proposed in [19]. Al-ternatively, one can use the following estimation algorithm, which requires data that is commonly available from system
performance measurement tools. LetNtbe the number of re-quests completed in a time window oft seconds, where the t seconds are countedignoringthe server’s idle time (that is, by conditioning on the period where the system is busy, Nt is a property of the service process which is independent of queueing or arrival characteristics). If we regardNt as a random variable, that is, if we perform several experiments by varying the time window placement in the trace and ob-tain different values ofNt, then the index of dispersionI is known to be equal also to the limit [15]:
I= lim
t→+∞It=t→+∞lim
Var(Nt) E[Nt]
, (2)
Markov process that jumps between two states and the ac-tive state determines the current rate of service. For example, one state may be associated with slow service times, while the other may represent fast service times, and the jumping frequencies between the two states can be chosen to repro-duce exactly the burstiness and the distribution of service or arrival times observed in a trace. Typically, given a set of trace moments and the index of dispersion valueI, it is straightforward to obtain values of the MAP(2)parameters that uniquely specify the Markov process. We point to (5) and (7) reported later in the paper for equations that related moments andI with MAP(2)parameters and thus can be used directly for MAP(2)fitting.
Input
T, the sampling resolution (e.g., 60 s) K, total number of samples, assumeK >100 Uk, utilization in thekth period, 1≤k≤K
nk, number of completed requests in thekth period, 1≤k≤K
tol, convergence tolerance (e.g., 0.20) Estimation of the index of dispersionI
1. get the busy time in thekth periodBk:=Uk·T, 1≤k≤K
2. initializet=T andY (0)=0 3. do
(a) for each Ak=(Bk, Bk+1, . . . , Bk+j), j
i=0Bk+i≈t,
(aa) computeNtk=ji=0nk+i
(b) if the set of valuesNtk has less than 100 elements, (bb) stop and collect new measures because the
trace is too short (c) Y (t )=Var(Nk
t)/E[Ntk] (d) increaset byT
until|1−(Y (t )/Y (t−T ))| ≤tol, i.e., the values ofY (t )converge
4. return the last computed value ofY (t )as estimate ofI Fig. 7 Estimation ofIfrom utilization samples and counts
We can use the closed-form formulas to define the MAP(2)as follows. After estimating the mean service time and the index of dispersionI of the trace, we also estimate the 95th percentile of the service times as we describe at the end of this subsection. Given the mean, the index of dispersion I, and the 95th percentile of service times, we generate a set of MAP(2)s that have±20% maximal error onI. Among this set of MAP(2)s, we choose the one with its 95th percentile closest to the trace. Overall, the com-putational cost of fitting the MAP(2)s is negligible both in time and space requirements. For instance, the fitting of the MAP(2)s has been performed in MATLAB in less than five minutes. For the experiments in this section, the 95th percentile is obtained from the 95th percentile of the mea-sured busy timesBk in Fig.7scaled by the median number of requests processed in the busy periods, see [30] for de-tails.
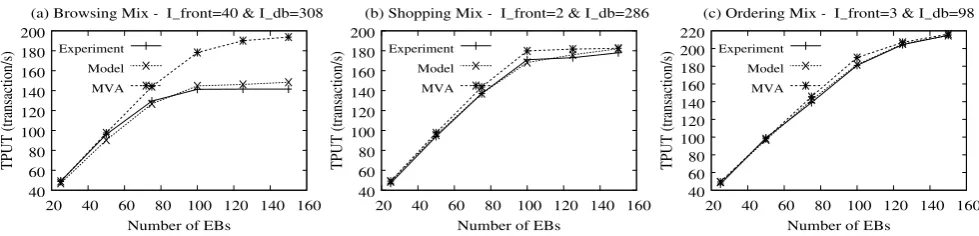
We illustrate the accuracy of MAP queueing networks as a capacity planning tool compared to the Mean Value Analy-sis (MVA) algorithm that is the standard in queueing analy-sis for IT sizing [22]. Figure8compares the analytical re-sults with the experimental measurements of the real system for the three transaction mixes. The values of the index of dispersion for the front and the database service processes are also shown in the figure. Figure8 gives evidence that the new analytic model based on the index of dispersion achieves gains in the prediction accuracy with respect to the MVA model onallworkload mixes, showing that it is reli-able also when the workloads are not bursty. In the brows-ing mix, the index of dispersion enables the queuebrows-ing model to effectively capturebothburstiness and bottleneck switch. The results of the proposed analytic model match closely the experimental results for the browsing mix, while remaining robust in all other cases. While in the shopping and the or-dering mixes, the feature of workload burstiness is almost negligible and thus MVA yields prediction errors up to 10%. Yet, as shown in Fig.8(b) and (c), our analytic model further improves MVA’s prediction accuracy. This happens because the index of dispersionI is able to capture detailed proper-ties of the service time process, which cannot be captured by the MVA model. Our experiments provide evidence that the
proposed methodology can work effectively on real-world applications. Indeed, further validation on real workloads is needed in order to further assess the general applicability of the technique.
4 Arrival process: another source of burstiness
Burstiness in arrival streams and/or service processes is of-ten found in client–server systems. Capturing burstiness ac-curately in performance models for capacity planning4 be-comes extremely important and challenging because this feature is responsible to significant degradation of perceived user performance and system capacity by creating request peak congestion periods in systems.
4.1 Different sources of burstiness
In order to gain intuition about the importance of burstiness in performance models, we use the closed queueing network shown in Fig.5to model a multi-tier architecture and then show how burstiness generates traffic surges and thus con-sistently affects the system performance.
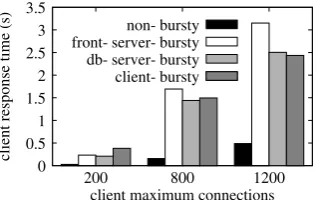
Figure9presents the simulation results of the end-to-end client response times, i.e., the summation of the response times at the front server and the back-end database, parame-terized according to the TPC-W model presented in Sect.3. In all simulations, we set the same mean service time (i.e., 5 microseconds) at the front server, as well as the same mean service time (i.e., 3 microseconds) at the database server. The mean user think time is also kept the same in all exper-iments, i.e., Z=7 seconds. The only difference is that we impose into the model different burstiness profiles: (1) there is no burstiness in neither the two servers, nor the client side, labelednon-bursty; (2) burstiness is present only in the front server’s service process, labeled front-server-bursty; (3) burstiness is present only in the service process at the
Fig. 9 Illustrating average end-to-end client response time as a func-tion of the number of maximum client connecfunc-tionsN
4In this paper, we focus on performance models for capacity planning
to represent the client–server systems in terms of their performance.
back-end database, labeleddb-server-bursty; and (4) bursti-ness is present only in the arrival process to the front server, labeledclient-bursty.
Figure9first shows the same results we have presented in Fig.1of Sect.2: when there is burstiness in workloads, the system performance becomes worse compared to the non-bursty case and this performance degradation is consistent over different system loads (i.e., the number of client con-nections). In addition, we find that burstiness in any system tier (i.e., the service processes at the front and the database servers) or client side (i.e., the arrival process) has a similar negative impact on overall system performance. This moti-vates us to consider the importance of burstiness in capacity planning no matter if it exists in the arrival process or the service process of one queue.
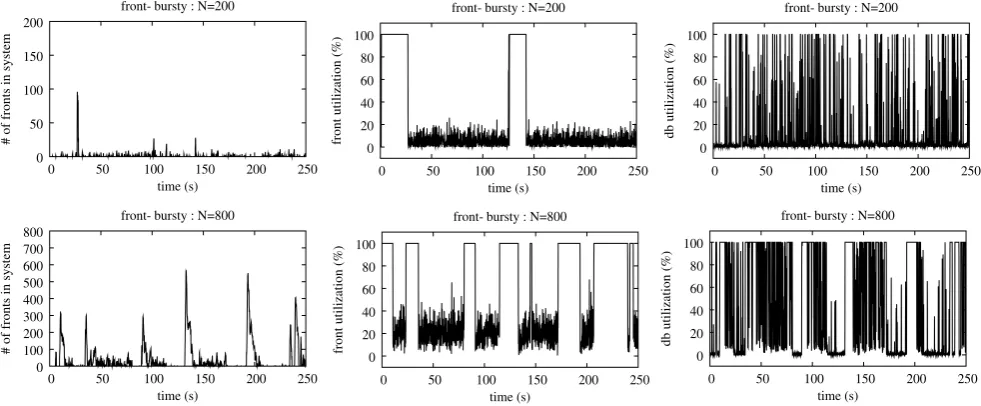
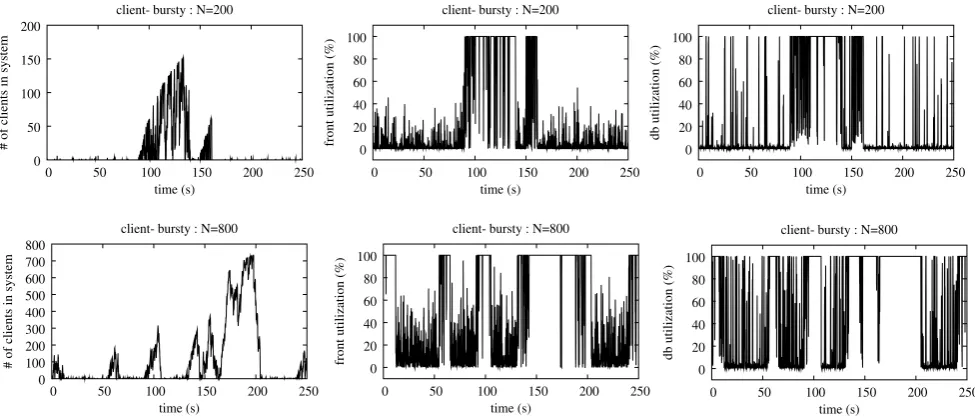
Observe also that while the maximum number of clients in this closed system is fixed, the number of clients receiving service from the system does fluctuate. Figures10–13show the number of clients receiving service (i.e., the first column in the figures) under four different workloads: (1) no bursti-ness in the system, see Fig.10, (2) when burstiness is present in the front server’s service process, see Fig.11, (3) when burstiness is present in the database server’s service process, see Fig.12, and (4) when burstiness is present in the arrival process to the front server, see Fig. 13. The transient uti-lization levels at the front and back-end database servers are also depicted in the figures, see the corresponding second and third columns. Observe that when there is no burstiness in the system, the number of clients is quite low and no traf-fic congestion exists in the system. As a result, the utiliza-tions at both the front and database servers are highly vari-able across time only and the best performance is obtained among all four workloads. In contrast, non-negligible bursti-ness is found under the other three workloads: when there is burstiness in the arrivals to the front server, we observe in-tensive traffic surges (i.e., bursts in the number of clients), as well as the corresponding burstiness in the front and data-base utilizations; and when there is burstiness in the front (resp. database) service times, we observe strong burstiness in the front (resp. database) utilizations but negligible bursti-ness in the database (resp. front) utilizations across times.
Fig. 10 Illustrating number of requests in the servers, transient utilizations at the front server, and transient utilizations at the back-end database, when there is no burstiness in systems
Fig. 11 Illustrating number of requests in the servers, transient utilizations at the front server, and transient utilizations at the back-end database, when burstiness is present in the front server’s service process
From the implementation point of view, if one wants to introduce a burstiness “knob” in the benchmark, it is much harder to introduce and control burstiness at the front or the database tiers of the system without significantly chang-ing the TPC-W implementation and possibly even appli-cation processing functionality. The most natural, simple, and controllable place of introducing burstiness is at the ar-rival process, i.e., at the client side. Therefore, in this sec-tion, we introduce a new module into TPC-W that injects burstiness into the arrival process in a controllable man-ner and thus enables detailed performance studies for eval-uating system performance degradation due to burstiness. Most importantly, burstiness in the arrivals to the
multi-tier system also capture the performance effect of traffic surges.
4.2 Limitations of standard TPC-W
Fig. 12 Illustrating number of requests in the servers, transient utilizations at the front server, and transient utilizations at the back-end database, when burstiness is present in the database server’s service process
Fig. 13 Illustrating number of requests in the servers, transient utilizations at the front server, and transient utilizations at the back-end database, when burstiness is present in the arrival process to the front server
Here, we propose to inject burstiness into the incoming traffic by modifying the way think times are generated in the client machines. Think times in the standard TPC-W bench-mark are drawn randomly from an exponential distribution that is identical for all clients [18]. Because of the memory-less property of the exponential distribution, this is equiva-lent to imposing that clients operate independently of their past actions. However, exponential think times are incom-patible with the notion of burstiness for several reasons: Temporal locality: intuitively, under conditions of
bursti-ness, arrivals from different customers cannot happen at
random instants of time, but they are instead condensed in short periods across time. Therefore, the probability of sending a request inside this period is much larger than out-side of it. This behavior is inconsistent with classic distri-butions considered in performance engineering of web ar-chitectures, such as Poisson, hyper-exponential, Zipf, and Pareto, which all miss the ability of describing temporal locality within a process.
in-tensity and duration, but also create fluctuations within a surge. This implies a hierarchy of variability levels that cannot be described by a simple exponential distribution and instead requires a more structured arrival process. Lack of aggregation: in the standard TPC-W, each thread
on the client machines uses a dedicated stream of random numbers, thus think times of different users are always in-dependent. This is representative of normal traffic, but fails in capturing the essential property of traffic surges: users act in an aggregated fashion which is mostly incompatible with independence assumptions.5As remarked in Sect.5, this is a common problem to many request generation tech-niques based on the user-equivalent approach [10].
In order to address all the above points, we propose to regulate the arrival rate of requests to the system using a class of Markov-modulated processes known as Markovian Arrival Processes (MAPs) [34], which have the ability of providing variability at different levels as well as tempo-ral locality effects. Recent work in [17] proposed two new metrics, i.e., marginal entropy and coefficient of variation, to capture temporal locality of web reference streams; how-ever, the coefficient of variation used as a metric in [17] is not sufficient to measure the correlation component of tem-poral locality. Thus, we use a MAP parameterized by the index of dispersion to create sequences of surges with dif-ferent intensities and durations in the following sections.
4.3 A turnable burstiness knob and its realistic values
A MAP can be seen as a simple mathematical model of a time series, such as a sequence of think times, for which we can accurately shape distribution and correlations be-tween successive values. Correlations among consecutive think times are instrumental to capture periods of the time series where think times are consecutively small and thus a surge occurs, as well as to determine the surge duration.
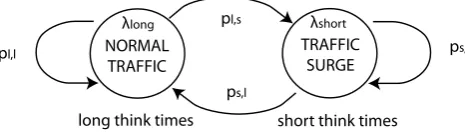
We use a class of MAPs with two states only, one respon-sible for the generation of “short” think times implying that users produce closely spaced arrivals, possibly resulting in surges, while the other is responsible for the generation of “long” think times associated with periods of normal traf-fic. In the “short” state, think times are generated with mean rate λshort, similarly they have mean rate λlong< λshort in the “long” state. We explain in Sect.4.4how to assign val-ues forλshortandλlong starting from standard TPC-W mea-surements. In order to create correlation between different events, after the generation of a new think time sample, our model has a probabilityps,sthat two consecutive think times
5As already observed in the introduction, we do not assume in any
point of this paper that users explicitly coordinate their submission of requests. Instead, we impose a loose synchronization which leaves large room for fluctuations within a traffic surge.
are short and a different probabilitypl,lof two consecutive think times being both long. The probabilityps,l=1−ps,s (resp., pl,s=1−pl,l) determines the frequency of jump from the short (resp., long) state to the long (resp., short) state. Thus, the values ofps,s,ps,l,pl,s andpl,l shape the correlations between consecutive think times and are instru-mental to determine the duration of the traffic surge; see the next subsection for further details. Henceforth, we focus only on the independent valuespl,s andps,l.
In order to gain intuition on the way this model works, we provide the following pseudo-code to generate a sample of nt think time values Z1, Z2, . . . , Zn, . . . , Znt from a MAP
parameterized by the tuple (λlong,λshort,pl,s,ps,l):
function:MAP_sample(λlong,λshort,pl,s,ps,l,nt)
/* initialization in normal traffic state */ active_state=“long”;
forn=1,2, . . . , nt
/* generate sample in current state */
Zn=sample from exponential distribution with rateλactive_state;
/* update MAP state */
r=random number in[0,1]; ifactive_state=“long”andr≤pl,s
active_state=“short”;
else ifactive_state=“short”andr≤ps,l
active_state=“long”; end
end
Figure14summarizes the traffic surge model described above. Note from the pseudo-code that the problem of vari-ability of different timescales is solved effectively in MAPs: if the MAP is in a statei, then samples are generated by an exponential distribution with rateλi associated with statei. This creates fluctuations within the traffic surge. It is also compatible with the observations in Sect.4.2against the ex-ponential think times because the probability of arrival in-side the traffic surge is larger than outin-side of it, due to the state change mechanism that alters the rate of arrival from λlongtoλshort.
We propose to use theindex of dispersionas a regulator of the intensity of traffic surges. The index of dispersionI has the fundamental property that it grows proportionally with
both variability and correlations, and thus can be immedi-ately used to identify burstiness in a trace. When there is no burstiness, the value ofI is equal to the squared coefficient-of-variation of the distribution, e.g., I =SCV=1 for the exponential distribution, while it grows to values of thou-sands on bursty processes. We point to the three real traces in Fig.2of Sect.2for a graphical outlook of how the val-ues ofI capture the intensity of burstiness in workloads. For example, 1998 FIFA World Cup website trace [5] presents dramatic traffic surges caused by particular important sport events, which results in the values ofI slightly larger than 6300, see Fig.2(a). Thus, a parameterization ofI spanning a range from single to multiple digits can give a good sense of scalability between workloads with “no burstiness” and workloads with “very high burstiness.”
4.4 Integrating burstiness in TPC-W
To avoid inter-machine communication and keep the modifi-cations to TPC-W simple, we propose to use asharedMAP process to draw think times for all users emulated on the same client machine.6 This solves immediately the prob-lem of independence between requests of different users and is a paradigm change, because we no longer model in the TPC-W benchmark the individual think times; instead, we shape directly the behavior of all clients.
The most complex aspect of this new approach is the parameterization of the MAP process: how should we define the arrival stream in order to stress effectively a system? The fundamental problem is how to determine a parameterization (λlong, λshort, pl,s, ps,l) that produces a sequence of surges in the incoming traffic that is always capable of stressing the system and highlighting scalability problems. Further, this parameterization must remain rep-resentative of a realistic (i.e., probabilistic, non-DDoS-like) scenario. Henceforth, we assume that the user gives to the modified TPC-W benchmark the desired values of the mean think time E[Z] and of the index of dispersion I which specifies the burstiness level. The benchmark automatically generates a parameterization (λlong,λshort,pl,s,ps,l) capa-ble of stressing the system. We also assume that the standard TPC-W benchmark has been previously run on the archi-tecture and that the mean service demand E[Di] of each serverihas been estimated from utilization measurements, e.g., using linear regression methods [49].
The mean think timeE[Z]can be parameterized as in the standard TPC-W benchmark asZ=7 seconds, while the in-dex of dispersionI is the additional parameter that can be used to tune the level of burstiness of the benchmark. Our approach to fully define the properties of MAP think times
6Often, TPC-W setup involves multiple client machines to generate
enough user requests to load the benchmarked system.
other than the meanE[Z]starts by the following parameter-ization equations:
λ−short1 = i
E[Di]
f, (3)
λ−long1 =fmax
N
i E[Di]
, E[Z]
. (4)
Here,f≥1 is a free parameter,N is the maximum number of client connections considered in the benchmarking exper-iment,iE[Di]is the minimum time taken by a request to complete at all servers, andN (iE[Di])provides an upper bound to the time required by the system to respond to all requests. Equation (3) states that, in order to create surges, the think times should be smaller than the time required by the system to respond to requests. Thus, assuming that all N clients are simultaneously waiting to submit a new re-quest, one may reasonably expect that after a few multiples ofλ−short1 all clients have submitted requests and the architec-ture has been yet unable to cope with the traffic surge. Con-versely, (4) defines think times that on average give to the system enough time to cope with any request, i.e., the nor-mal traffic regime. Note that the conditionλ−long1 ≥f E[Z] is imposed to ensure that the mean think time can beE[Z], which would not be possible if bothλ−short1 > λ−long1 > E[Z] sincef >1 and in MAPs the momentsE[Z], E[Z2], . . .are
E[Zk] =k!
pl,s
pl,s+ps,l
λ−shortk + ps,l pl,s+ps,l
λ−longk
. (5)
The above formula fork=1 implies thatE[Z]has a value in-between ofλ−short1 andλ−long1 , which is not compatible with λ−short1 ≥λ−long1 ≥f E[Z]. According to the last formula, the MAP parameterization can always impose the user-defined E[Z]if
pl,s=ps,l
λ−1
long−E[Z]
E[Z] −λ−short1
, (6)
and we use this condition in the modified TPC-W bench-mark to impose the mean think time.
Fig. 15 User think times for the shopping mix with (a) non-bursty (standard TPC-W), (b)I=400, and (c)I=4000
Fig. 16 Arriving clients to the system (front server) for the shopping mix with (a) non-bursty (standard TPC-W), (b)I=400, and (c)I=4000 in user think times, where the maximum number of client connections is set toN=1000
be obtained by a two-state MAP. The index of dispersion of the MAP can be evaluated at each iteration as7[11,34]
I=1+ 2ps,lpl,s(λshort−λlong) 2
(ps,l+pl,s)(λshortps,l+λlongpl,s)2
, (7)
while the lag-1 autocorrelation coefficient is computed as
ρ1=1
2(1−pl,s−ps,l)
1− E[Z] 2
E[Z2] −E[Z]2
, (8)
whereE[Z2]is obtained from (5) fork=2. We remark that if no MAP exists with at leastρ1≥0.4, then the benchmark should search for the MAP with largestρ1in order to facili-tate the formation of surges which persists over several units of time.
4.5 Experiments
In order to demonstrate our modified TPC-W benchmark, we conduct detailed experimentation in the TPC-W test-bed under three standard transaction mixes. For each trans-action mix, we run a set of experiments with different number of maximum client connections (fixed within each experiment) ranging from 200 to 1200. As a result, we evaluate the new methodology under various system loads with utilization levels at the front and the database servers
7Note that (7) slightly differs in the denominator from other
expres-sions ofI, such as those reported in [19], because here we consider a MAP that is a generalization of an MMPP process.
within the range of 12–98% and 6–74%, respectively. In all experiments, the average user think time is set to E[Z] =7 sec, which is the default value for the TPC-W benchmark. We use a two-state MAP to generate the user think times as described in the previous section. Our ex-periments are done with two different MAPs that result in index of dispersion equal toI=400 (mild burstiness) and I=4000 (severe burstiness).
For comparison, we also perform experiments with the standard configuration, i.e., think times are exponen-tially distributed with meanE[Z] =7 seconds and squared coefficient-of-variation SCV=1. All experiments are run for 3 hours each, where the first 5 minutes and the last 5 minutes are considered as warm-up and cool-down pe-riods and thus omitted in the measurements.
Figure15illustrates the user think times under the shop-ping mix, which are generated by the standard TPC-W and our extended TPC-W withI=400 andI=4000 in MAPs. Clearly, the user think times in the standard TPC-W bench-mark are exponentially distributed, see Fig. 15(a), while mild and strong burstiness is presented in user think times under the two MAPs. Consequently, the two MAPs (with I=400 andI=4000) for user think times inject the bursti-ness into the arrival process. Figure 16 demonstrates the arrival processes to the system under the shopping mix,8 where we depict the number of arriving clients to the sys-tem (i.e., the front server) in monitoring windows of 1
sec-8The results for the browsing and the ordering mixes are qualitatively
Fig. 17 Average latencies as a function of the number of maximum client connectionsNfor (a) browsing mix, (b) shopping mix, and (c) ordering mix with non-bursty and bursty ofI=4000 and 400 in the user think times
Fig. 18 CDFs of latencies for (a) browsing mix, (b) shopping mix, and (c) ordering mix with non-bursty and bursty ofI=4000 and 400 in user think times, whereN=1000 and the corresponding average latencies are also marked
ond. In the standard TPC-W experiment, there is no bursti-ness in the number of arriving clients, which remains sta-ble around 150, see Fig. 16(a). When we adopt two-state MAPs in think times, surges are generated in the arrivals as shown by periods of continuous peak arrival rates, see Fig.16(b) and (c). We stress that all three arrival processes have the same mean. As the index of dispersion increases from I =400 to I =4000, there are sharp surges in the number of active clients, consistently with our purpose to “create” bursty conditions.
Figure17presents theaverage latencyfor a client trans-action, which is the interval from the moment when the client sends an HTTP request to the moment when an entire HTTP web page (including embedded objects) is retrieved. We first direct the reader’s attention to the system perfor-mance under the standard TPC-W experiment (i.e., expo-nential think times, labeled non-bursty in Fig. 17, see all solid curves). As shown in Fig.17across all workloads, av-erage latencies increase as the maximum number of client connections increases. Especially for the browsing mix, the latency becomes two orders of magnitude larger whenN is increased from 200 to 1200. This is due to the presence of burstiness in the service times at the database server, which dramatically degrades the overall system performance. For the shopping and the ordering mixes, there is no burstiness in neither the front nor the database service processes, al-though these two workload mixes are highly variable.
Con-sequently, a large number of clients do not deteriorate their performance as severely as in the browsing mix.
When burstiness is injected into the arrival flows, the overall system performance becomes significantly worse for all three transaction mixes. For instance, for the shopping and the ordering mixes, when the index of dispersion in the two-state MAP for user think times is I =4000 and the maximum number of client connections is beyond 600, the average latency is increased by at least 13 times and 35 times, respectively, compared to the non-bursty case. As the index of dispersion decreases, e.g.,I=400, the degra-dation caused by burstiness on the overall system perfor-mance becomes weaker yet visible as latencies remain at least 6 times slower. For the browsing mix, the newly in-jected burstiness in arrivals further deteriorates average la-tencies. Yet, as the maximum number of client connections reaches 1200, the system performance underI=400 is sim-ilar to the non-bursty case. This happens because the system is already overloaded, regardless of burstiness.
highlights the pressing need to evaluate client–server sys-tems under bursty conditions.
5 Related work
Capacity planning of multi-tier systems is a critical part of the architecture design process and requires reliable quanti-tative methods, see [27] for an introduction. Queueing mod-els are popular for predicting system performance and an-swering what-if capacity planning questions [27,43–45]. Single-tier queueing models focus on capturing the perfor-mance of the most-congested resource only (i.e., bottleneck tier): [45] describes the application tier of an e-commerce system as anM/GI/1/PSqueue; [37] abstracts the appli-cation tier of anN-node cluster as a multi-serverG/G/N queue.
Mean Value Analysis (MVA) queueing models that cap-ture all the multi-tier architeccap-ture performance have been validated in [43,44] using synthetic workloads running on real systems. The parameterization of these MVA models requires only the mean service demand placed by requests at the different resources. In [40] the authors use multiple linear regression techniques for estimating from utilization measurements the mean service demands of applications in a single-threaded software server. In [26], Liu et al. cali-brate queueing model parameters using inference techniques based on end-to-end response time measurements. A traffic model for web traffic has been proposed in [25], which fits the real data using the mixture of distributions.
However, the observations in [29] show that autocorrela-tion in multi-tier systems flows, which is ignored by stan-dard capacity planning models, must be accounted for accu-rate performance evaluation. Indeed, [9] presents that bursti-ness in the World Wide Web and its related applications peaks the load of the web server beyond its capacity, which results in the significant degradation of the actual server performance. In this paper we have proposed for the first time robust solutions for capacity planning under workload burstiness. The class of MAP queueing networks considered in this paper that can capture the effects of burstiness has been first introduced in [12, 14] together with a bounding technique for approximate model solution. In [12,14] the authors provide the theoretical methods for capacity plan-ning under bursty workloads. But, a practical issue often encountered is that the model parameterization must be de-rived from limited coarse measurements. Thus, to address this issue, in this paper we have proposed a parameterization of MAP queueing networks using for the service process of each server its mean service time, the index of dispersion, and the 95th percentile of service times. The index of disper-sion has been frequently adopted in the networking literature for describing traffic burstiness [19,42]; in particular, it is
known that the performance of theG/M/1/FCFSqueue in heavy-traffic is completely determined by its mean service time and index of dispersion [42]. Further results concern-ing the characterization of index of dispersion in MAPs can be found in [3].
To analyze performance of systems, one needs a good un-derstanding of fundamental features and properties of web workloads. The workload of websites has been extensively studied and characterized in many research and industrial papers [1,6,7,10, 16]. A number of studies of different sites identified that Internet and web traffic is bursty across several timescales and showed the importance of multiscale analysis of web requests [2,16,23,28,35]. In [23,28], the authors consider the relationship between response time per-centiles and CPU utilization for a web-based shopping sys-tem. The authors noted that for bursty workloads it is im-portant to consider different timescales; they noted that the frequency of intervals with high or low utilization increased at a finer timescales, and this can impact SLA’s guarantees for a significant portion of requests.
Several studies have shown that the arrival of requests in a web-based system is self-similar [16,28]. Self-similar workloads exhibit significant request correlations or bursts over multiple timescales [2]. A system’s ability to handle such bursts is determined by its features and system re-sources such as the system capacity, scheduling disciplines, maximum allowable queue lengths, etc. If a system is not able to support bursts at some timescale, significant queue-ing delays may occur [36]. When choosqueue-ing an e-commerce site’s hardware and software configuration, one needs to ac-cess whether considered configurations could handle a de-sired load level while providing acceptable performance. Considerable effort has been focused on synthetic work-load generators for traditional web-based systems [10,21, 33]. SURGE [10] is a workload generator for testing web servers. The GEIST tool [21] attempts to match the aggre-gate workload characteristics and models attributes of the request arrival process at the system level. The Httperf [33] tool provides a flexible facility for generating various http workloads for measuring web server performance.
6 Conclusions
Today’s IT and Services departments are faced with the dif-ficult task of ensuring that enterprise business-critical ap-plications are always available and provide adequate per-formance. Predicting and controlling the issues surround-ing system performance is a difficult and overwhelmsurround-ing task for IT administrators. With complexity of enterprise systems increasing over time and customer requirements for QoS growing, effective models for quick and automatic evalua-tion of required system resources in producevalua-tion systems be-come a priority item on the service provider’s “wish list”.
In this work, we have presented a solution to the difficult problem of model parameterization by inferring essential process information from coarse measurements in real sys-tem. After giving quantitative examples of the importance of integrating burstiness in performance models pointing out its role relatively to the bottleneck switch phenomenon, we show that coarse measurements can still be used to para-meterize queueing models that effectively capture burstiness and variability of the true process. The parameterized queue-ing model can thus be used to closely predict performance in systems even in the very difficult case where there is per-sistent bottleneck switch among the various servers.
We have also developed a new methodology to explic-itly introduce burstiness in a client–server benchmark. We exemplify this methodology in the well established TPC-W benchmark. Our methodology injects burstiness into the ar-rival process of the server in a controllable way using the index of dispersion. This simple parameterization allows the user to introduce traffic surges of different intensity into the system, thus allowing for accurate benchmarking as well as evaluation of the system under various what-if scenar-ios. Looking to the future, we will investigate the robustness of our methodology and focus on early detection of traffic surges and on proactive solutions ranging from load balanc-ing to work sheddbalanc-ing.
References
1. Almeida V, Bestavros A, Crovella M, de Oliveira A (1996) Char-acterizing reference locality in the WWW. In: IEEE conference on parallel and distributed information systems, Dec 1996
2. Almeida V, Arlitt M, Rolia J (2002) Analyzing a web-based sys-tem’s performance measures at multiple timescales. ACM Perform Eval Rev 30(2):3–9
3. Andersen AT, Nielsen BF (1998) A Markovian approach for mod-eling packet traffic with long-range dependence. IEEE J Sel Areas Commun 16(5):719–732
4. Andersen AT, Nielsen BF (2002) On the use of second-order de-scriptors to predict queueing behavior of MAPs. Nav Res Logist 49(4):391–409
5. Arlitt M, Jin T (1999) Workload characterization of the 1998 World Cup website. Technical Report HPL-1999-35R1
6. Arlitt M, Williamson C (1996) Web server workload characteri-zation: the search for invariants. In: Proc of ACM SIGMETRICS, pp 126–137
7. Arlitt M, Friedrich R, Jin T (1999) Workload characterization of a web proxy in a cable environment. ACM Perform Eval Rev 27(2):25–36
8. Balbo G, Serazzi G (1996) Asymptotic analysis of multiclass closed queueing networks: common bottlenecks. Perform Eval 26(1):51–72
9. Banga G, Druschel P (1999) Measuring the capacity of a web server under realistic loads. WWW 2(1–2):69–83
10. Barford P, Crovella M (1998) Generating representative web workloads for network and server performance evaluation. ACM Perform Eval Rev 26(1):151–160
11. Casale G, Zhang E, Smirni E (2007) Characterization of moments and autocorrelation in MAPs. ACM Perform Eval Rev 35(1):27– 29. Special issue on MAMA workshop
12. Casale G, Mi N, Smirni E (2008) Bound analysis of closed queue-ing networks with workload burstiness. In: Proc of SIGMETRICS, pp 13–24
13. Casale G, Mi N, Cherkasova L, Smirni E (2010) Dealing with burstiness in multi-tier applications: new models and their para-meterization (under submission)
14. Casale G, Mi N, Smirni E (2010) Model-driven system capac-ity planning under workload burstiness. IEEE Trans Comput 59(1):66–80
15. Cox DR, Lewis PAW (1966) The statistical analysis of series of events. Methuen, London
16. Crovella M, Bestravos A (1996) Self-similarity in Word Wide Web traffic: evidence and possible causes. In: Proc of SIGMETRICS 17. Fonseca R, Almeida V, Crovella M, Abrahao B (2003) On the
in-trinsic locality properties of web reference streams. Proc IEEE IN-FOCOM
18. Garcia D, Garcia J (2003) TPC-W e-commerce benchmark evalu-ation. IEEE Comput 36:42–48
19. Gusella R (1991) Characterizing the variability of arrival processes with indexes of dispersion. IEEE J Sel Areas Commun 19(2):203–211
20. Jung J, Krishnamurthy B, Rabinovich M (2002) Flash crowds and denial of service attacks: characterization and implications for CDNs and websites. In: Proc of WWW, pp 293–304
21. Kant K, Tewary V, Iyer R (2001) An internet traffic generator for server architecture evaluation. In: Proc of workshop computer ar-chitecture evaluation using commercial workloads
22. Kobayashi H, Mark BL (2009) System modeling and analysis: foundations of system performance evaluation
23. Krishnamurthy D, Rolia J (1998) Predicting the QoS of an elec-tronic commerce server: those mean percentiles. ACM Sigmetrics Perform Eva Rev 26(3):16–22
24. Li H (2010) Realistic workload modeling and its performance im-pacts in large-scale eScience grids. IEEE Trans Parallel Distrib Syst 21(4):1045–9219
25. Liu Z, Niclausse N, Jalpa-Villanueva C (2001) Traffic model and performance evaluation of web servers. Perform Eval 46(2–3) 26. Liu Z, Wynter L, Xia CH, Zhang F (2006) Parameter inference of
queueing models for it systems using end-to-end measurements. Perform Eval 63(1):36–60
27. Menascé DA, Almeida VAF, Dowdy WL (1994) Capacity plan-ning and performance modeling: from mainframes to client–server systems
28. Menascé DA, Almeida VAF, Reidi R, Pelegrinelli. R. Fonesca F, Meira W Jr. (2000) In search of invariants in e-business workloads. In: Proc of ACM conf electronic commerce, pp 56–65
30. Mi N, Casale G, Cherkasova L, Smirni E (2008) Burstiness in multi-tier applications: symptoms, causes, and new models. In: Proc of Middleware
31. Mi N, Casale G, Cherkasova L, Smirni E (2009) Injecting realistic burstiness into a traditional client–server benchmark. In: Proc of ICAC
32. Minh TN, Wolters L (2009) Modeling job arrival process with long range dependence and burstiness characteristics. In: Proc of int’l symp on cluster computing and the grid, pp 324–330 33. Mosberger D, Jin T (1998) httperf: a tool for measuring web server
performance. In: Proc of workshop internet server performance 34. Neuts MF (1989) Structured stochastic matrices ofM/G/1 type
and their applications. Dekker, New York
35. Paxon V, Floyd S (1995) Wide area traffic: the failure of poisson modeling. IEEE/ACM Trans Netw 3(3):226–244
36. Ranjan S, Rolia J, Fu H, Knightly E (2002) QoS-driven server migration for internet data center. In: Proc of IWQoS, pp 3–12 37. Ranjan S, Rolia J, Fu H, Knightly F (2002) Qos-driven server
mi-gration for Internet data centers. In: Proc of IWQoS
38. Reiser M, Lavenberg S (1980) Mean-value analysis of closed mul-tichain queueing networks. J ACM 27(2):312–322
39. Riedi RH, Crouse MS, Ribeiro VJ, Baraniuk RG (1999) A mul-tifractal wavelet model with application to network traffic. IEEE Trans Inf Theory 45(4):992–1018
40. Rolia J, Vetland V (1998) Correlating resource demand informa-tion with arm data for applicainforma-tion services. In: Proc of WOSP, pp 219–230
41. Slashdot effect, Wikipedia, Oct 13, 2008. http://en.wikipedia. org/wiki/Slashdot_effect
42. Sriram K, Whitt W (1986) Characterizing superposition arrival processes in packet multiplexers for voice and data. IEEE J Sel Areas Commun 4(6):833–846
43. Urgaonkar B, Pacifici G, Shenoy P, Spreitzer M, Tantawi A (2005) An analytical model for multi-tier internet services and its appli-cations. In: Proc of ACM SIGMETRICS, pp 291–302
44. Urgaonkar B, Shenoy P, Chandra A, Goyal P (2005) Dynamic pro-visioning of multi-tier internet applications. In: Proc of ICAC 45. Villela D, Pradhan P, Rubenstein D (2002) Provisioning servers in
the application tier for e-commerce systems. ACM Trans Internet Technol 7(1):7
46. Williams A, Arlitt M, Williamson C, Barker K (2005) Web work-load characterization: ten years later. Springer, New York 47. www.mercury.com/us/products/diagnostics. HP (Mercury)
diag-nostics
48. Zhang Q, Cherkasova L, Mathews G, Greene W, Smirni E (2007) R-capriccio: a capacity planning and anomaly detection tool for enterprise services with live workloads. In: Proc of Middleware, pp 244–265