R E S E A R C H
Open Access
Text mining brain imaging reports
Beatrice Alex
1,2,3*, Claire Grover
1,3, Richard Tobin
1, Cathie Sudlow
4, Grant Mair
5and
William Whiteley
5FromUK Healthcare Text Analysis Conference (HealTAC 2018) Manchester, UK. 18–19 April 2018
Abstract
Background: With the improvements to text mining technology and the availability of large unstructured Electronic Healthcare Records (EHR) datasets, it is now possible to extract structured information from raw text contained within EHR at reasonably high accuracy. We describe a text mining system for classifying radiologists’ reports of CT and MRI brain scans, assigning labels indicating occurrence and type of stroke, as well as other observations. Our system, the Edinburgh Information Extraction for Radiology reports (EdIE-R) system, which we describe here, was developed and tested on a collection of radiology reports.
The work reported in this paper is based on 1168 radiology reports from the Edinburgh Stroke Study (ESS), a hospital-based register of stroke and transient ischaemic attack patients. We manually created annotations for this data in parallel with developing the rule-based EdIE-R system to identify phenotype information related to stroke in radiology reports. This process was iterative and domain expert feedback was considered at each iteration to adapt and tune the EdIE-R text mining system which identifies entities, negation and relations between entities in each report and determines report-level labels (phenotypes).
Results: The inter-annotator agreement (IAA) for all types of annotations is high at 96.96 for entities, 96.46 for negation, 95.84 for relations and 94.02 for labels. The equivalent system scores on the blind test set are equally high at 95.49 for entities, 94.41 for negation, 98.27 for relations and 96.39 for labels for the first annotator and 96.86, 96.01, 96.53 and 92.61, respectively for the second annotator.
Conclusion: Automated reading of such EHR data at such high levels of accuracies opens up avenues for population health monitoring and audit, and can provide a resource for epidemiological studies. We are in the process of validating EdIE-R in separate larger cohorts in NHS England and Scotland. The manually annotated ESS corpus will be available for research purposes on application.
Keywords: Text mining, Electronic healthcare records, Neuroimaging reports, Stroke classification
Background
The goal of the EdIE-R system [1] is to label each report with an indication of what the radiologist was able to observe in the scan image, for example, small vessel disease,ischaemic strokeetc. Like most other sys-tems for extracting information from electronic health-care records, we use text mining techniques to identify the
*Correspondence:[email protected]
1School of Informatics, University of Edinburgh, Informatics Forum, 10 Crichton Street, Edinburgh, UK
2Edinburgh Futures Institute, School of Literatures, Languages and Cultures, University of Edinburgh, 50 George Square, Edinburgh, UK
Full list of author information is available at the end of the article
relevant parts of the report which can then be used as a basis for predicting the document-level labels.
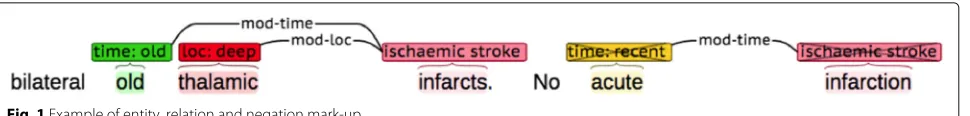
Fig. 1Example of entity, relation and negation mark-up
into two relations, one with a temporal modifier and one with a location modifier, while the second ischaemic strokeentity is in a relation with a temporal modifier. These latter two entities are marked as negative (crossed out) because they are in the scope of the negative wordNo. Annotations such as these are output by the text mining system and are then used as the basis for the assignment of labels to the reports.
In order to develop NER and RE components, decisions need to be made about which entities and which rela-tions the system should identify. These decisions are best made through dialogue between the domain experts, who know what information they would ideally like to access, and text mining experts, who can judge which pieces of information can be identified with sufficient accuracy. In addition, manually annotated subsets of the data are needed to train and develop the components as well as to evaluate their performance.
In building EdIE-R, we used the process of annotation as a means to focus the radiologist/text miner dialogue at the same time as developing the prototype system. We used an agile development methodology where iterations of system development were interleaved with annotation iterations. After initial scoping, automatic annotations from the system were presented to the domain experts for correction using the BRAT annotation tool [2]. The system and manual annotations were compared and dis-agreements were resolved either by adjusting the man-ual annotation or by improving the system. We iterated over the process a number of times with both system and manual annotation improving in each cycle. This method has several advantages. First, it allows both teams to work simultaneously, unlike methods where all the annotation is done in advance of system development. Second, discussion of the system and manual disagree-ments allows the text miners to come to a much clearer understanding of the meaning of the domain language and the domain specialists to understand the limitations of the technology. Through negotiation, several changes
to the annotation scheme were made during the iterative process. Third, doing annotation as correction tends to reduce insignificant differences between manual and sys-tem annotation.
Related work
Named entity recognition is a well-established task in NLP. The CoNLL shared-task evaluations [3] established benchmarks for NER evaluation and prompted research into supervised machine learning methods for NER, for example, the Stanford NER tagger [4]. Rule-based tech-niques are also still used for NER: see e.g. the ANNIE NER tagger which is part of GATE [5]. Relation extraction is often included as a subtask in text mining applications [6] with approaches to it ranging from rule-based through supervised to unsupervised machine learning.
Text mining technology for the biomedical domain has been a subject of research for two decades with several community initiatives to provide data and a forum for shared tasks, such as BioCreative [7] and BioNLP [8]. Both of these organised shared tasks in NE and RE: see [9, 10] for our contributions. More recently the shared task approach has been used for electronic health records (EHRs) by the LOUHI workshops, e.g. LOUHI’17 [11] or LOUHI’18 [12]. There are many individual studies apply-ing information extraction to EHRs, see [13] for a review of some of these. Negation detection has been recognised as an important step, particularly in medical text mining, with the NegEx algorithm [14] being frequently used.
Several researchers have applied NLP and text mining approaches to radiology reports. Pons et al. (2016) provide a useful systematic review of NLP in radiology [15]. They include 67 different studies which they group according to 5 distinct purposes, namely diagnostic surveillance, cohort building for epidemiological studies, query-based case retrieval, quality assessment of radiologic practice, and clinical support services. Conditions targeted by the systems are various and include appendicitis, pneumonia, renal cysts, pulmonary embolism, liver conditions and
general metastases, to name but a few. Across all these application areas the NLP systems surveyed tend to have the same broad structure where a flow diagram showing the individual components looks much like our diagram of the EdIE-R system shown in Fig.2below.
Two recent studies by Hassanpour and Langlotz (2016) and by Cornegruta et al. (2016) describe machine learning methods for entity recognition from radiol-ogy reports [16, 17]. Hassanpour and Langlotz [16] tested two existing feature-based machine learning clas-sifiers for this task. Their annotation scheme contains four broad types of named entities (Anatomy, Anatomy modifier, ObservationandObservation modifier) as well as strings expressing Uncertainty. They used NegEx to identify negation in the text as a feature feed-ing into their models. The machine learnfeed-ing classifier both result in an average F1-score of 85% for 10-fold cross-validation on a data set containing 150 manu-ally annotated radiology reports from three different institutions.
Cornegruta et al. [17] describe work on analysing a large corpus of historical chest X-ray reports. Their sys-tem described is interestingly similar to ours in the way the report text is annotated with named entity and nega-tion mark-up although the entity list (Body Locanega-tion, Descriptor, Clinical Finding, Medical Device) is both smaller and more complex in that disjoint entities are permitted. No relation extraction is performed but nega-tion mark-up is included. The NER method uses a bidi-rectional LSTM (BiLSTM) neural network architecture, which is contrasted with a baseline system which uses string matching look-up against RadLex [18] and Medical Subject Headings (MeSH) [19] concepts combined with parsing, plus NegEx for negation detection. The BiLSTM NER tagger significantly outperforms the baseline but it is worth noting that, in general, rule-based and machine learning approaches attain similar levels of per-formance on NER if the rule-based system uses more sophisticated techniques than string matching, as ours does.
There has also been some work on summarising radi-ology reports. Most recently, Zhang et al. [20] proposed a state-of-the-art neural network-based approach to sum-marisation of radiology impressions. An impression is the “Conclusion” section of a radiology report summarised by the radiologist after dictating or writing down their find-ings presented in the image. Automating this step is an extremely useful task that can save radiologists a lot of effort and time. Two different radiology reports describ-ing similar symptoms and conditions, however, are not guaranteed to result in the same summary text. The out-put of summarisation therefore does not lend itself well for large-scale data analysis in the same way as classifica-tion of symptoms and condiclassifica-tions does, for example, for
identifying patients with the same findings for epidemio-logical studies.
With a specific focus on stroke, Flynn et al. (2010) [21] developed a system for analysis of brain scan radiology reports from Tayside, Scotland, i.e. EHR reports which are very similar to the those in the ESS data set [22]. Their aim was to improve on the coding of the reports which were frequently given generic ‘stroke’ codes even when a more precise code could be determined by look-ing at the report. Their method used a keyword matchlook-ing step looking for affirmative or negative uses of key words from a stroke lexicon. They report results which were acceptably accurate in identifying ischaemic stroke (94.7% positive predictive value (precision)) on a dataset of 150 reports manually classified as ischaemic stroke. Their method performed less reliably in identifying intracere-bral haemorrhage (76.7% positive predictive value) on a dataset of 150 reports manually classified as intracere-bral haemorrhage. The paper does not report sensitivity (recall) scores as the data only contains positive examples of either type.
To the best of our knowledge, EdIE-R is the first sys-tem that performs named entity extraction, negated entity detection, relation extraction and document level labelling with the goal to classify radiology report with types of stroke, tumours and other information. The extracted entities (positive or negative) and relations are all used to do the final classification (labelling) step. The information captured in and about the reports include a compre-hensive set of entities and labels. We provide a detailed evaluation of EdIE-R for all the steps it is designed to perform using standard natural language processing eval-uation metrics, including precision, recall and F1-score. Compared to the previous study [21] we therefore test on an unseen test set of random radiology reports which contain positive and negative examples of the information EdIE-R is designed to extract and label.
Method
Annotation scheme
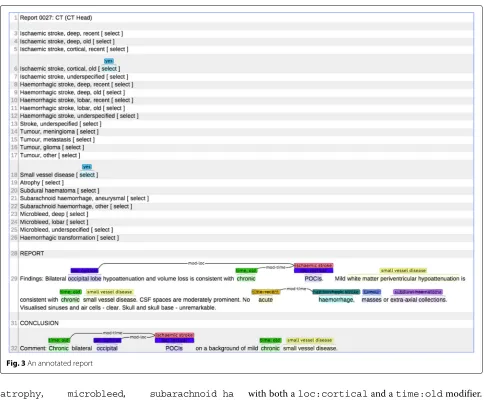
There are four aspects to the annotation of brain scan reports in our data: entities, relations, negation mark-up, and labels. These are all illustrated in Fig.3, a screen grab of an annotated report loaded into the BRAT tool. As shown, each report is preceded by a list of all possible labels but only those that have been marked as selected are labels for the report. Entities, relations and negation have been annotated within the textual body of the report.
Fig. 3An annotated report
atrophy, microbleed, subarachnoid ha emorrhageandhaemorrhagic transformation. The four modifier entities, which are used to identify loca-tion (deep vs. cortical/lobar) and recency (old vs. recent) of an observation, are loc:deep, loc:cortical, time:old,time:recent.
Relations link a subset of observation entities, namely stroke and microbleed entities, with modifier entities. Strokes may be associated with both a location and a time, while microbleeds are associated only with loca-tion. Some words or phrases, such as POCI (Posterior Circulation Infarct) in Fig.2, carry both observation and modifier meaning and in these cases nested entities are used. Here there is a mod-loc relation between the loc:cortical entity and the ischaemic stroke entity but we do not require this to be made explicit in the annotation since the nesting implies it.
There is a close relationship between the entity and relation names and the labels. For example, the labelIschaemic stroke, cortical, oldhas been chosen and this clearly relates to the two occur-rences of an ischaemic stroke entity in a relation
with both aloc:corticaland atime:oldmodifier. The annotators are instructed not to select labels unless there is explicit linguistic evidence to support the choice. Occasionally they will be able to infer labels from implicit information but they are asked not to annotate these cases as the aim is to model linguistically explicit information not human expertise.
should contribute to the labels assigned to the reports.
The EdIE-R system
EdIE-R is a rule-based text mining system which we devel-oped in tandem with manual data annotation in the form of correction of the system output. The presentation of the data in the BRAT tool, as illustrated in Fig.2, is the view that the annotators see, but this is a format that has been derived from the data structure which the system manipulates and outputs, which is an XML data structure. We have developed the system’s text analysis components using the LT-XML2 programs, which are the core of our XML rule-based text mining software [23]. Our most recent software release, the Edinburgh Geoparser [24], contains all of our general-purpose components, such as the tokeniser, NER tagger and chunker, which we have adapted to the brain scan report domain in EdIE-R.
As shown in Fig. 3, the EdIE-R system has a pipeline architecture. Scan reports are converted from their orig-inal format into an initial XML format and subsequent
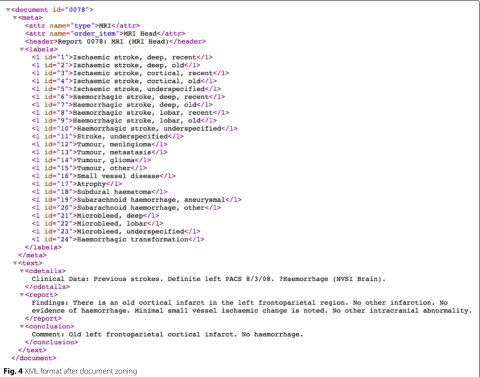
components incrementally add annotations to the XML structure, with each stage making computations over the annotations of previous stages. The document zoning step segments the reports into sections including clinical details, the report itself and the radiologist’s conclusion. It also adds metadata which includes all of the possi-ble labels that can be assigned; by the final stage of the pipeline an attribute on each label indicates whether that label has been selected. An example of a report in XML after document zoning is shown in Fig.4. We combine NER and label mark-up in this way so that manual anno-tation of all levels of analysis can be done at the same time.
Subsequent steps of the pipeline do linguistic process-ing. The tokeniser splits textual content into paragraphs, sentences and word tokens, with punctuation characters also treated as tokens. The C&C POS tagger [25] labels each word with its syntactic category. The default C&C model has been trained on modern U.S. newspaper text and although it performs well on most text types, it is not wholly suitable for the medical text in our reports. For this
Fig. 5Example lexical entries
reason, we also use a model trained on the Genia biomed-ical corpus [26]. After running the POS tagger with each of the models we apply a correction stage to moderate dis-agreements between them. After POS tagging, we apply the morpha lemmatiser [27] to analyse inflected nouns and verbs and compute their lemma (morphological stem). The output of POS tagging and lemmatization
is stored in attribute values on word token elements.
The fifth step in the pipeline is the NER component, which incorporates lexical lookup. From examples in the development set we manually curated two lexicons, one for observations (e.g. theatrophyentityinter-cerebral volume lossand theischaemic strokeentitylacunar
Table 1The annotated ESS data sets
Reports Of which CT Of which MRI Sentences Words
Development
dev1 18 18 0 158 1651
dev2 25 16 9 231 2671
dev3 80 78 2 888 6833
dev4 82 74 8 833 6935
dev5 82 69 13 965 8,061
dev6 77 67 10 762 6078
Total 364 322 42 3837 32,229
Test
test1 89 74 15 969 7,919
test2 92 82 10 996 8,226
test3 85 82 3 890 6697
Total 266 238 28 2855 22,842
event) and one for modifiers (e.g. the time:old enti-ties old, previous and established), e.g. see Fig. 5. The process of lexical lookup results in the addition of fur-ther attributes to the word tokens of matching words and phrases. The lexicons are applied one after the other, first the observations lexicon and then the modifiers, so that some words or phrases can be marked as both observa-tion and modifier to achieve the nested entity mark-up described above.
The next stage of processing performs a shallow syntac-tic analysis using our chunker [28] to segment sentences into phrases or word groups, i.e. syntactic structures headed by nouns (noun groups), verbs (verb groups) etc. The purpose of doing this is to create a useful data struc-ture for dealing with nested entities and coordinations of entities as well as to define the scope of negation mark-ers in terms of structure rather than just word sequences. At this stage complex negative noun groups such asNo acute haemorrhage, masses or extra-axial collectionshave an appropriate structure to allow information from the negative articleNoto be propagated through the group so that all three observation entities (haemorrhage,masses, extra-axial collections) are marked as negative.
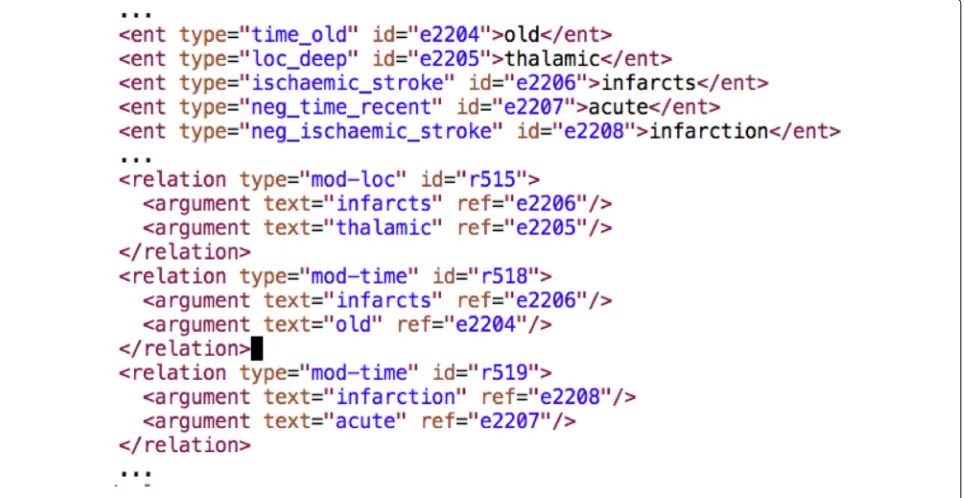
Relation Extraction is the final stage of the text min-ing part of the system. In this component some pairs of entities are linked in relations held as structures in standoff XML mark-up as illustrated in Fig. 6. There are two possible relations, location and time, which hold between stroke entities (ischaemic, haemorrhagic or unknown type) and modifiers. In addition, a microbleed entity can be in a relation with a location modifier.
Negation arising from the verb particlenot, for exam-ple inVery acute infarction may not be visible on CT, is handled as part of the relation extraction module because
Table 2Annotations in the data sets
Annotated by Positive entities
Negative entities
Relations Labels
dev1 Both: reconciled 197 85 68 46
dev2 Both: reconciled 242 116 85 62
dev3 Both: reconciled 670 324 230 192
dev4 Annotator 1 600 284 195 167
dev5 Annotator 2 708 302 212 174
dev6 Annotator 1 524 280 169 151
Total 2941 1391 959 792
test1 Annotator 1 605 291 203 159
test2 Annotator 1 786 337 278 192
test3 Annotator 1 572 333 206 167
Total 1963 961 687 518
test1 Annotator 2 614 304 220 160
test2 Annotator 2 792 361 281 199
test3 Annotator 2 574 355 200 176
Total 1980 1020 701 535
rules linkingnotwith the entities it scopes over are simi-lar to the other relation rules. The result, however, is not an explicit relation but an attribute on the negated entities (acuteandinfarction, in this case). This is the same format as for noun group negation detected during chunking.
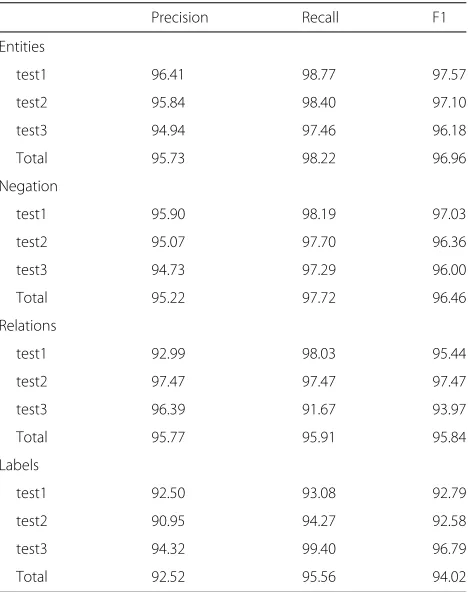
Table 3Inter-annotator agreement on the test data
Precision Recall F1
Entities
test1 96.41 98.77 97.57
test2 95.84 98.40 97.10
test3 94.94 97.46 96.18
Total 95.73 98.22 96.96
Negation
test1 95.90 98.19 97.03
test2 95.07 97.70 96.36
test3 94.73 97.29 96.00
Total 95.22 97.72 96.46
Relations
test1 92.99 98.03 95.44
test2 97.47 97.47 97.47
test3 96.39 91.67 93.97
Total 95.77 95.91 95.84
Labels
test1 92.50 93.08 92.79
test2 90.95 94.27 92.58
test3 94.32 99.40 96.79
Type TP FP FN Precision Recall F1
Entities
ischaemic stroke 453 9 2 98.05 99.56 98.80
haemorrhagic stroke 264 20 3 92.96 98.88 95.83
stroke (unknown type) 25 0 1 100.00 96.15 98.04
tumour:meningioma 8 0 0 100.00 100.00 100.00
tumour:metastasis 12 0 0 100.00 100.00 100.00
tumour 165 2 1 98.80 99.40 99.10
subdural haematoma 109 32 0 77.30 100.00 87.20
small vessel disease 269 15 7 94.72 97.46 96.07
atrophy 147 14 6 91.30 96.08 93.63
microhaemorrhage 10 0 0 100.00 100.00 100.00
subarachnoid haemorrhage 9 3 1 75.00 90.00 81.82
haemorrhagic transformation 2 2 0 50.00 100.00 66.67
time:old 314 9 7 97.21 97.82 97.52
time:recent 354 0 0 100.00 100.00 100.00
loc:cortical 410 5 2 98.80 99.51 99.15
loc:deep 321 17 22 94.97 93.59 94.27
TOTAL 2872 128 52 95.73 98.22 96.96
The final labelling step of the pipeline uses the infor-mation from the previous steps to compute which labels should be associated with a record. Because the mark-up coming from the text mining is very detailed, the label-ing rules can be fairly simple. For example, to choose theSmall vessel diseaselabel the rules need only to check that there is a non-negative small vessel disease entity in either the report or conclusions part of the report. To choose the label Ischaemic stroke, cortical, recent there needs to be a non-negative ischaemic stroke entity which is in a location relation (mod:loc) with a cortical loca-tion entity (loc:cortical) and in a time relation (mod:time) with a time:recent entity. There are a few added complexities to these rules, for exam-ple, a deep ischaemic stroke which is not in an explicit relationship with a time modifier is assumed to be old.
Table 5IAA precision, recall and F1 for relations including numbers of TPs, FPs and FNs
Type TP FP FN Precision Recall F1
Relations
mod-loc 235 17 25 93.25 90.38 91.80
mod-time 421 12 3 97.23 99.29 98.25
TOTAL 656 29 28 95.77 95.91 95.84
Labels
Ischaemic stroke, deep, recent
4 0 0 100 100 100
Ischaemic stroke, deep, old
81 4 4 95.29 95.29 95.29
Ischaemic stroke, cortical, recent
13 3 1 81.25 92.86 86.67
Ischaemic stroke, cortical, old
58 6 3 90.62 95.08 92.8
Ischaemic stroke, underspecified
6 6 6 50 50 50
Haemorrhagic stroke, deep, recent
2 1 0 66.67 100 80
Haemorrhagic stroke, deep, old
4 0 0 100 100 100
Haemorrhagic stroke, lobar, recent
4 0 0 100 100 100
Haemorrhagic stroke, lobar, old
3 0 0 100 100 100
Haemorrhagic stroke, underspecified
9 0 1 100 90 94.74
Stroke, underspecified
14 1 1 93.33 93.33 93.33
Tumour, meningioma
4 0 0 100 100 100
Tumour, metastasis 0 0 0 - -
-Tumour, glioma 0 0 0 - -
-Tumour, other 2 3 1 40 66.67 50
Small vessel disease 158 3 1 98.14 99.37 98.75
Atrophy 119 9 3 92.97 97.54 95.2
Subdural haematoma
6 0 0 100 100 100
Subarachnoid haemorrhage, aneurysmal
0 0 0 - -
-Subarachnoid haemorrhage, other
5 2 1 71.43 83.33 76.92
Microbleed, deep 1 1 0 50 100 66.67
Microbleed, lobar 1 0 0 100 100 100
Microbleed, underspecified
0 0 1 NaN 0 NaN
Haemorrhagic transformation
1 1 0 50 100 66.67
TOTAL 495 40 23 92.52 95.56 94.02
Evaluation
Table 7Evaluation of the system on the two annotators’ test sets. We reproduce IAA from Table3for comparison
Precision Recall F1 IAA F1
Entities
Annotator 1 test set 94.63 96.37 95.49 96.96
Annotator 2 test set 97.21 96.50 96.86
Negation
Annotator 1 test set 93.54 95.30 94.41 96.46
Annotator 2 test set 96.35 95.66 96.01
Relations
Annotator 1 test set 97.32 99.24 98.27 95.84
Annotator 2 test set 95.47 97.61 96.53
Labels
Annotator 1 test set 94.94 97.88 96.39 94.02
Annotator 2 test set 92.70 92.52 92.61
first 500 reports as the development set and the remain-der as the test set. ESS contains MRI, CT and Doppler Ultrasound reports but we used only the CT and MRI reports. We also discarded a few reports which contained non-brain results, e.g. combined brain and neck, chest, or abdomen scans. In total the annotated development set contains 322 CT and 42 MRI reports. We have annotated a random subset of the test set containing 238 CT and 28 MRI reports.
Manual annotation of the development data was accom-plished in six tranches, where annotation was correc-tion of the system output. The system was modified and improved between the tranches. Table 1provides infor-mation on the sizes of the data subsets. The first three tranches were doubly annotated by the radiology experts so that IAA could be monitored. For these three tranches only, disagreements between the annotators were recon-ciled to produce an agreed gold standard. The remaining development data was singly annotated. The test data was doubly annotated in three tranches but not reconciled. Table2provides details of the annotators and annotations in all the data sets.
Results
Following standard practice we measure both IAA and system performance using precision, recall and F1. Note that IAA represents an upper bound for system perfor-mance as an automatic method would not be expected to out-perform human capabilities. The overall results for IAA on the test data are shown in Table 3. Note that IAA measures for relations are only computed for those relations where the two annotators agree on both entities linked by the relation. Overall the IAA results are very high which indicates that the annotation task is well-defined.
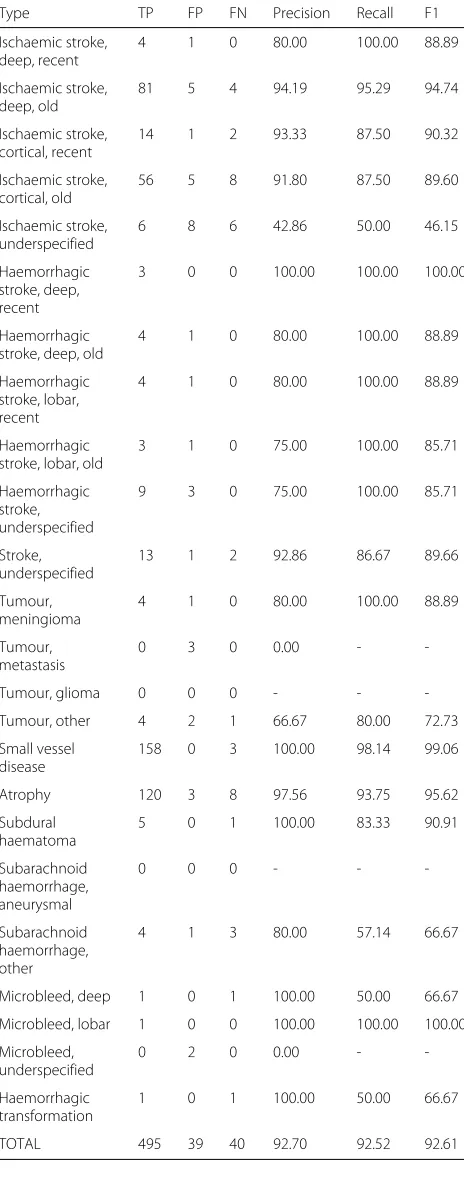
Table 8Detailed evaluation of system labelling compared to Annotator 2 showing numbers of true positives (TP), false positives (FP) and false negatives (FP), as well as precision, recall and F1
Type TP FP FN Precision Recall F1
Ischaemic stroke, deep, recent
4 1 0 80.00 100.00 88.89
Ischaemic stroke, deep, old
81 5 4 94.19 95.29 94.74
Ischaemic stroke, cortical, recent
14 1 2 93.33 87.50 90.32
Ischaemic stroke, cortical, old
56 5 8 91.80 87.50 89.60
Ischaemic stroke, underspecified
6 8 6 42.86 50.00 46.15
Haemorrhagic stroke, deep, recent
3 0 0 100.00 100.00 100.00
Haemorrhagic stroke, deep, old
4 1 0 80.00 100.00 88.89
Haemorrhagic stroke, lobar, recent
4 1 0 80.00 100.00 88.89
Haemorrhagic stroke, lobar, old
3 1 0 75.00 100.00 85.71
Haemorrhagic stroke, underspecified
9 3 0 75.00 100.00 85.71
Stroke, underspecified
13 1 2 92.86 86.67 89.66
Tumour, meningioma
4 1 0 80.00 100.00 88.89
Tumour, metastasis
0 3 0 0.00 -
-Tumour, glioma 0 0 0 - -
-Tumour, other 4 2 1 66.67 80.00 72.73
Small vessel disease
158 0 3 100.00 98.14 99.06
Atrophy 120 3 8 97.56 93.75 95.62
Subdural haematoma
5 0 1 100.00 83.33 90.91
Subarachnoid haemorrhage, aneurysmal
0 0 0 - -
-Subarachnoid haemorrhage, other
4 1 3 80.00 57.14 66.67
Microbleed, deep 1 0 1 100.00 50.00 66.67
Microbleed, lobar 1 0 0 100.00 100.00 100.00
Microbleed, underspecified
0 2 0 0.00 -
-Haemorrhagic transformation
1 0 1 100.00 50.00 66.67
IAA scores for entity types are for low frequency ones, for examplesubarachnoid haemorrhage. This pat-tern is mirrored in the IAA scores for labels, for example for Haemorrhagic transformation and Microbleed. However, since these types are very infre-quent their low IAA scores do not have a serious effect on the overall figures.
Table7shows evaluation results for the EdIE-R system on the two annotators’ versions of the test set. For labels and relations, the system agrees more with Annotator 1 than with Annotator 2, while the pattern is reversed for entities and negation. We would expect system scores to be lower than IAA (see final column), which is the case for entities and negation for Annotator 1, and for all but relations for Annotator 2. We speculate that these differ-ences indicate that Annotator 1 focused more on entity mark-up and spotted and corrected more system entity errors while Annotator 2 focused more on the labels and made more corrections there. To improve the accuracy of the evaluation we would ideally arbitrate the annotators’ disagreements and produce a consensus test set. Nev-ertheless, the overall evaluation results are reassuringly high, indicating that this method of labelling radiology reports is highly effective.
In Table8 we provide a breakdown of system perfor-mance for the labelling task as compared with Annotator 2. This shows the comparative frequency of the dif-ferent labels.Small vessel diseaseandAtrophy are the most frequent and the system performs well on both. The presence of these labels boosts the total precision, recall and F1 into the low 90s. With the exception of Ischaemic stroke, deep, old andHaemorrhagic stroke, deep, recent, per-formance is generally slightly lower for both Ischaemic and Haemorrhagic stroke labels than the total entity score. The comparative frequency of these labels (Ischaemic more frequent than Haemorrhagic) does not appear to make a difference in Table 8, but it may be that the number of Haemorrhagic stroke instances is too low for the sample to be representative. Similarly, other labels are so infrequent that their results may not be inter-pretable and it would be useful to acquire and annotate more data to improve the robustness of the evaluation results.
Conclusion
We have described the development and evaluation of the EdIE-R system on brain imaging radiology reports from the Edinburgh Stroke Study. The evaluation results are encouraging and the system is sufficiently accurate that we believe it can be used for its intended purpose of data
lected between 1994 and 2015. We are also in the process of evaluating whether the system can reliably identify cases of intracerebral haemorrhage in patients in Greater Manchester.
The evaluation of EdIE-R against these larger datasets will show how robust it is against new data. The disad-vantage of a rule-based system such as EdIE-R is that it takes time to write the rules. However, we found that with the help of the domain expert input we were able to get a first prototype running fairly quickly. For a small dataset such as ESS, we found this to work very well as we did not have any training data available at the start to test machine learning methods. Now that we have the annotated data ready we are evaluating machine learning approaches in parallel to investigate if we can obtain better results using them.
Acknowledgements
An initial version of this paper was presented at the Healthcare Text Analytics Conference 2018 (HealTAC) in Manchester in April 2018 [29].
About this supplement
This article has been published as part of the Journal of Biomedical Semantics Volume 10 Supplement 1, 2019: HealTAC-2018: Unlocking Evidence Contained in Healthcare Free-text. The full contents of the supplement are available online athttps://jbiomedsem.biomedcentral.com/articles/supplements/ volume-10-supplement-1.
Authors’ contributions
Alex and Grover wrote this article. Grover developed the text mining system and performed the evaluation experiments and Alex assisted in the annotation, evaluation and discussions of this project. Tobin wrote the XML processing tools used in the EdIE-R text mining pipeline. Whiteley and Mair did the manual data annotation, provided expert domain knowledge during system development and edited the article. Sudlow provided the dataset and offered domain expertise. All authors edited the paper and approved the final manuscript.
Funding
Alex and Grover are supported by Turing Fellowships from The Alan Turing Institute (EPSRC grant EP/N510129/1). Sudlow is Chief Scientist of UK Biobank and Director of Health Data Research UK Scotland. Mair is supported by a Stroke Association Edith Murphy Foundation Senior Clinical Lectureship (SA L-SMP 18\1000). Whiteley was supported by an MRC Clinician Scientist Award (G0902303) and is supported by a Scottish Senior Clinical Fellowship (CAF/17/01). Publication costs are funded by the RCUK Open Access Fund.
Availability of data and materials
The annotated ESS corpus that we have created as part of this project has much potential value as a resource for developing text mining algorithms. This data will be available on application to Prof. Cathie Sudlow (email:
Cathie.Sudlow AT ed.ac.uk) to bona fide researchers with a clear analysis plan, in line with the Wellcome Trust policy on data-sharing (https://wellcome.ac.uk/ what-we-do/topics/data-sharing). We are in the process of creating a release of EdIE-R free for research purposes (https://www.ltg.ed.ac.uk/software/edie-r). For more information contact Dr. Beatrice Alex (email: balex AT ed.ac.uk).
Ethics approval and consent to participate
dataset. We also received permission from the NHS Tayside Caldicott Guardian to use the anonymised brain imaging reports for this work.
Competing interests
The authors declare that they have no competing interests.
Author details
1School of Informatics, University of Edinburgh, Informatics Forum, 10 Crichton Street, Edinburgh, UK.2Edinburgh Futures Institute, School of Literatures, Languages and Cultures, University of Edinburgh, 50 George Square, Edinburgh, UK.3The Alan Turing Institute, The British Library, 96 Euston Road, London, UK.4Centre for Medical Informatics, University of Edinburgh, 9 Little France Road, Edinburgh, UK.5Centre for Clinical Brain Sciences, University of Edinburgh, Chancellor’s Building, 49 Little France Crescent, Edinburgh, UK.
Published: 12 November 2019
References
1. EdIE-R project page.https://www.ltg.ed.ac.uk/software/edie-r. Accessed 10 July 2019.
2. Stenetorp P, Pyysalo S, Topi´c G, Ohta T, Ananiadou S, Tsujii J. BRAT: A Web-based Tool for NLP-assisted Text Annotation. In: Proceedings of EACL 2012. Stroudsburg: Association for Computational Linguistics; 2012. p. 102–7.
3. Tjong Kim Sang EF, De Meulder F. Introduction to the CoNLL-2003 shared task: language-independent named entity recognition. In: Proceedings of CoNLL-2003; 2003. p. 142–7.https://doi.org/10.3115/1119176.1119195. 4. Finkel JR, Grenager T, Manning C. Incorporating non-local information into information extraction systems by Gibbs sampling. In: Proceedings of the 43rd Annual Meeting on Association for Computational Linguistics; 2005. p. 363–70.https://doi.org/10.3115/1219840.1219885.
5. Cunningham H, Maynard D, Bontcheva K, Tablan V. GATE: A framework and graphical development environment for robust NLP tools and applications. In: Proceedings of the 40th Annual Meeting of the Association for Computational Linguistics. Philadelphia: Association for Computational Linguistics; 2002. p. 168–75.
6. Hachey B, Grover C, Tobin R. Datasets for generic relation extraction. J Nat Lang Eng. 2011;18(1):21–59.
7. BioCreative.http://www.biocreative.org. Accessed 10 July 2019. 8. BioNLP.http://2016.bionlp-st.org. Accessed 10 July 2019. 9. Alex B, Haddow B, Grover C. Recognising nested named entities in
biomedical text. In: Proceedings of BioNLP 2007; 2007. p. 65–72.https:// doi.org/10.3115/1572392.1572404.
10. Grover C, Haddow B, Klein E, Matthews M, Nielsen LA, Tobin R, Wang X. Adapting a relation extraction pipeline for the BioCreative II task. In: Proceedings of BioCreative II Workshop 2007. Madrid: CNIO Centro Nacional de Investigaciones Oncologicas; 2007.
11. LOUHI’17.https://sites.google.com/site/louhi17/home. Accessed 10 July 2019.
12. LOUHI’18.https://louhi2018.fbk.eu. Accessed 10 July 2019. 13. Meystre SM, Savova GK, Kipper-Schuler KC, Hurdle JF. Extracting
information from textual documents in the electronic health record: a review of recent research. Yearb Med Inform. 2008;47(Suppl. 1):128–44. 14. Chapman WW, Bridewell W, Hanbury P, Cooper GF, Buchanan BG. A
simple algorithm for identifying negated findings and diseases in discharge summaries. J Biomed Inform. 2001;34(5):301–10.
15. Pons E, Braun LMM, Hunink MGM, Kors JA. Natural Language Processing in Radiology: A Systematic Review. Radiology. 2016;279(2):329–43. https://doi.org/10.1148/radiol.16142770.
16. Hassanpour S, Langlotz CP. Information extraction from
multi-institutional radiology reports. Artif Intell Med. 2016;66:29–39. 17. Cornegruta S, Bakewell R, Withey S, Montana G. Modelling radiological
language with bidirectional long short-term memory networks. In: Proceedings of the 7th International Workshop on Health Text Mining and Information Analysis; 2016. p. 17–27.https://doi.org/10.18653/v1/ w16-6103.
18. Langlotz CP. Radlex: a new method for indexing online educational materials. Radiographics. 2006;26(6):1595–7.
19. United States National Library of Medicine NLM. Medical Subject Headings 2016.https://www.nlm.nih.gov/mesh/meshhome.html. Accessed 10 July 2019.
20. Zhang Y, Ding DY, Qian T, Manning CD, Langlotz CP. Learning to summarize radiology findings. In: Proceedings of the Ninth International Workshop on Health Text Mining and Information Analysis. Brussels: Association for Computational Linguistics; 2018. p. 204–13.http:// aclweb.org/anthology/W18-5623.
21. Flynn R, Macdonald T, Schembri N, Murray G, Doney A. Automated data capture from free text radiology reports to enhance accuracy of hospital inpatient stroke codes. Pharmacoepidemiol Drug Saf. 2010;19(8):843–7. 22. Jackson C, Crossland L, Dennis M, Wardlaw J, Sudlow C. Assessing the impact of the requirement for explicit consent in a hospital-based stroke study. QJM Mon J Assoc Phys. 2008;101(4):281–9.
23. Grover C, Matthews M, Tobin R. Tools to address the interdependence between tokenisation and standoff annotation. In: Proceedings of NLPXML 2006; 2006. p. 19–26.https://doi.org/10.3115/1621034.1621038. 24. Alex B, Byrne K, Grover C, Tobin R. Adapting the Edinburgh Geoparser
for historical georeferencing. Int J Humanit Arts Comput. 2015;9(1):15–35. 25. Curran J, Clark S. Language independent NER using a maximum entropy
tagger. In: Proceedings of CoNLL 2003; 2003. p. 164–7.https://doi.org/10. 3115/1119176.1119200.
26. Kim J-D, Ohta T, Teteisi Y, Tsujii J. GENIA corpus - a semantically annotated corpus for bio-textmining. Bioinformatics. 2003;19(Suppl. 1): 180–2.
27. Minnen G, Carroll J, Pearce D. Robust, applied morphological generation. In: Proceedings of INLG 2000; 2000. p. 201–8.https://doi.org/10.3115/ 1118253.1118281.
28. Grover C, Tobin R. Rule-based chunking and reusability. In: Proceedings of the Fifth International Conference on Language Resources and Evaluation. Genoa: European Language Resources Association (ELRA); 2006. p. 873–8.http://www.lrec-conf.org/proceedings/lrec2006/pdf/457_pdf.pdf. 29. Grover C, Tobin R, Alex B, Sudlow C, Mair G, Whiteley W. Text Mining
Brain Imaging Reports. In: HealTAC-2018. Manchester; 2018.
Publisher’s Note