Published online October 30, 2014 (http://www.sciencepublishinggroup.com/j/ajep) doi: 10.11648/j.ajep.20140305.15
ISSN: 2328-5680 (Print); ISSN: 2328-5699 (Online)
Testing the degree of biostabilization in the refuse from
composting plants
Antonio Gallardo Izquierdo
1, Francisco José Colomer Mendoza
1, Eduard Cirstea
2,
Natalia Edo Alcón
1, Joan Esteban Altabella
11
Department of Mechanical Engineering and Construction, Universitat Jaume I, Ave. Vicent Sos Baynat s/n, 12071 Castellón, Spain 2
Facultatea De Ingineria Mediului si Biotehnologii, Universitatea “Valahia” Din Târgoviste.Str. N. T Radian, BI. T1 sc. A. et 1, ap 3, 130062. Dâmbovita, Romania
Email address:
[email protected] (A. G. Izquierdo), [email protected] (F. J. C. Mendoza), [email protected] (E. Cirstea), [email protected] (N. Edo Alcon), [email protected] (J. E. Altabella)
To cite this article:
Antonio Gallardo Izquierdo, Francisco José Colomer Mendoza, Eduard Cirstea, Natalia Edo Alcón, Joan Esteban Altabella. Testing the Degree of Biostabilization in the Refuse from Composting Plants. American Journal of Environmental Protection. Vol. 3, No. 5, 2014, pp. 238-243. doi: 10.11648/j.ajep.20140305.15
Abstract:
In composting plants, aerobic fermentation could not to be complete and therefore, the fate of unstabilyzed wastes from the compost refining, uses to be landfill. This fact provokes an extra biogas generation in landfills, which contributes to greenhouse effect. In this work, the refuse of compost refining process has been subjected to an anaerobic fermentation. For that, in order to analyze their biogas generation, three samples of different composting plants have been selected. In one of these plants, the amount of biogas generation has been considerable, which involves a not complete stabilization of biowaste in the composting process.Keywords:
Biomethanization, Biowaste, Compost, Refine, Refuse1. Introduction
European rules about solid waste establish a hierarchy in waste management, and encourage preventive actions. The rules thus force Member States of the European Union (EU) to prepare waste prevention programs. In line with the waste hierarchy and to reduce the emission of greenhouse gases caused by the disposal of waste in landfills, it is essential to facilitate the separate collection of waste and the proper treatment of biowaste. This helps, on the one hand, to manufacture compost that complies with European regulations and, on the other, to make use of other recyclable materials based on biowaste [1]. Landfills have been shown to be the worst option, and therefore the amount of biodegradable waste dumped in landfills must be progressively reduced. The challenge of the EU is to reduce the amount of biowaste in landfills to just 35% with respect to the year 1995 [2] or, at least, to avoid the dumping of non-stabilized waste in order to reduce the emission of landfill gases. Nowadays, Spain and other Member States are still a long way from meeting this challenge, since the most recent data made available indicate that only 18% of
biowaste was treated by aerobic or anaerobic processes, and 33% of waste was deposited in landfills (data for 2012) [3].
There are basically two methods for stabilizing biowaste: composting and biomethanation. Composting is an aerobic process that transforms biodegradable waste into “compost”, which can be used as an organic fertilizer. Yet, depending on the waste and the separation methods employed, the quality of the compost is sometimes too low to allow it to be used as a fertilizer, and the waste usually ends up in a landfill. In this case, the organic material should be completely stabilized to avoid the generation of biogas.
In this biological process CO2, steam and heat are released
considerable (75 - 85%) [7].
On the other hand, biomethanation is an anaerobic biological process that transforms the organic fraction into methane, carbon dioxide, water and sludge. Using this process, with optimal conditions in terms of temperature, pH, and water, the content of biodegradable material can be reduced by 45-60% [8, 9, 10].
In this work, the degree of stabilization of refuse after the composting process is tested. This can be carried out by analyzing the feasibility of biomethanizing the refuse of three composting plants. Thus, if the refuse was not completely stabilized, it would be stabilized by a second (anaerobic) fermentation. Therefore, the main purpose of reducing the volume of biodegradable waste in landfills and biogas emissions could be achieved. Moreover, the biogas thus generated could also be valorized.
2. Description of the Composting Plants
In order to perform the research, samples of refuse from three composting plants were selected. The three plants employ different composting methods and each of them receives different waste to be composted. To achieve the above-mentioned goal, statistically representative samples were collected from different provinces of Spain.
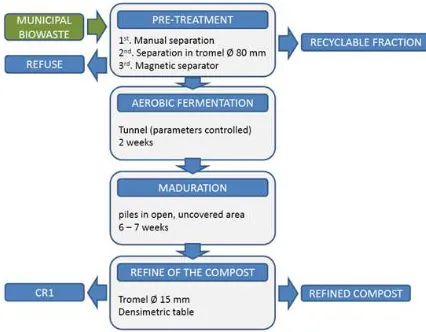
Figure 1. Composting process at the 1st plant
The 1st plant receives a mixture of MSW. In this plant, the waste from 350,000 inhabitants is treated. The scheme of the composting process is represented in Figure 1. The treatment process comprises four stages. In the first one, MSW is
separated into two parts: recyclable fraction and
biodegradable material. The recyclable fraction is separated manually, mechanically (80 cm trommel) and magnetically. The second stage consists in aerobic fermentation of the biodegradable material in a tunnel for two weeks. The third stage involves the maturation of the fermented material from the tunnel for 6-7 weeks. This results in gross stabilized organic material. Finally, the fourth stage consists in the process of refining the gross stabilized organic material by means of a trommel (1.5 cm sieve) and then by a densimetric table. The resulting materials are “biostabilized material” and
composting refuse (CR1). The CR1 was analyzed in the laboratory, and its composition is shown in Table 1.
Table 1. Characteristics of the CR1
Fraction % in refuse
Organic waste 80.54
Plastic 4.84
Inert 1.82
Textile 1.15
Metal 1.01
Glass 10.40
Hazardous waste 0.24
The 2nd plant receives 18,000 t/year of biowaste from the selective collection of MSW and waste from gardens in the cities (75/25%). The composting process is represented schematically in Figure 2. The treatment process includes four stages: In the 1st stage (2 weeks) both types of waste are deposited in piles in a covered shed without walls. The piles are turned over daily to rip open the plastic bags containing biowaste and mix it. In the 2nd stage the materials pass through a trommel with an 80 cm sieve and an electromagnet in order to remove plastic, glass and metals. In the 3rd stage material with a diameter of less than 80 cm is deposited in piles for 12 weeks to be matured. In the final stage, the biodegradable fraction (transformed into compost) is refined. It passes through two trommels (25 and 10 mm sieves) and a densimetric table. Thus, two products are obtained: cleaned compost and refuse (CR2).
Figure 2. Composting process at the 2nd plant
Table 2. Characteristics of the CR2 (2nd plant)
Fraction % in refuse
Organic waste 80.30
Plastic 6.90
Inert 0.58
Textile 3.24
Metal 0.33
Glass 8.65
Hazardous waste 0
in Table 2.
The 3rd plant receives 5,000 t/year of biowaste from the selective collection of MSW and waste from the gardens of the cities (75/25% approx.). The composting process is represented schematically in Figure 3. The treatment process includes four stages: In the 1st stage both types of waste are mixed and they pass through an 80 mm trommel sieve to open up the plastic bags and separate the biodegradable fraction from the others (plastic, brick or glass). In the 2nd stage the biodegradable fraction goes into the fermentation tunnels (2 weeks). In the 3rd stage the stabilized biowaste is deposited in piles for 6-8 weeks to be matured. Finally, in the 4th stage, the compost is refined. It passes through two trommels (7 mm sieve) and a densimetric table. Thus, two products are obtained: cleaned compost and refuse (CR3). The composting process is represented schematically in Figure 3.
Figure 3. Compostingprocessatthe3rdplant
The refuse from the compost refining (fine refuse) process (2nd refuse) was analyzed in the laboratory, and its composition is shown in Table 3.
Table 3. CharacteristicsoftheCR3(3rdplant)
Fraction % in refuse
Organic waste 95.12
Plastic 0.27
Inert 0.27
Textile n/d
Metal 0.01
Glass 4.33
Hazardous waste n/d
3. Experimental
In order to determine the degree of stabilization of refuse after the composting process, statistically representative samples were collected from the three composting refuses (CR1, CR2 and CR3).
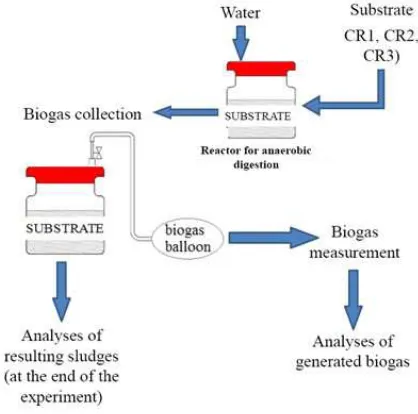
Samples were fermented anaerobically and the biogas generated in the process was analyzed. For the experiment, refuse resulting from the composting process (CR1, CR2 and CR3) was used as a substrate for fermentation. The different compositions have been shown in Tables 1, 2 and 3. This refuse is no longer used in any other recycling operation, and therefore it is usually deposited in landfills for degradation. The content of the reactors was: 1st reactor (CR1, 1st plant); 2nd reactor (CR2, 2nd plant), and 3rd reactor (CR3, 3rd plant). The project was carried out in three plastic reactors (one per plant), each of which had a capacity of 10 L. They were sealed and gas output was performed at the top of the reactor with a valve, where balloons were attached for biogas collection (Figure 4). Biogas emissions (% methane and % carbon dioxide) were measured by means of a Perkin Elmer® chromatograph. Chemical analyses were performed at the beginning of the experiment. Parameters analyzed were: percentage of C (%), N (%), S (%), and volatile solids (%), and pH. The analyses of the three refuses are shown in Table 4.
Figure 4. Schemeofbiogasgeneration,measurementandanalyses
Table 4. Chemicalanalysisofthesamples(d.w.)
Initial moisture (%) Volatile solids (%) Carbon (%) Nitrogen (%) C/N Sulfur (%)
CR1 45.3 73.61 51.29 2.06 24.90 0.26
CR2 23.4 78.97 52.56 1.79 29.36 0.48
CR3 19.1 73.63 51.40 2.35 21.87 0.30
Table 5. Physical-chemicalanalysisofsamplesbeforefermentation(d.w.)
Reactors Moisture (%) Sample Temperature(ºC) Agitation (times/day)
1st reactor 70 CR1 35 2
2nd reactor 70 CR2 35 2
The pH was adjusted to 7 in all reactors. Anaerobic microorganisms need a pH of around 7 in order to develop, although they tolerate a certain oscillation to either side of this value [11]. pH affects the enzymatic activity of the microorganisms. Some problems in the growth of the microorganisms could occur if the pH value went above 8.3 or below 6.2 [12]. The temperature of the climatic chamber was set to 37ºC to promote mesophilic digestion. The C/N index should be 15-30 to ensure good fermentation and biodegradability [13] (Table 4). A Climatic Test Chamber
DYCOMETAL Mod. cck-30/300 with an optional
temperature range (from -30°C to 150°C) and a humidity control point was used to maintain a constant temperature. The moisture of the substrate was 70% and, therefore, water was added in all the reactors.
Carbon and sulfur were analyzed using Leco SC-144 equipment. The method consists in direct simple combustion in an oven at 1350ºC with an excess of oxygen. The CO2 and
SO2 gas concentration is then detected in the infrared selective
cell. Nitrogen was analyzed using Leco FP-528 equipment, which employs a technique based on fast combustion with an excess of oxygen in an oven at 950ºC so that NOx molecules
are reduced to N2, which is detected by means of a thermal
conductivity cell. Volatile solids (VS) were determined by means of a muffle furnace (850ºC – 7 minutes), in accordance with Spanish regulation UNE-EN 15402:2011.
The volume of biogas generated was analyzed throughout the trial. The composition of the biogas (CO2 and CH4) was
analyzed in a Perkin Elmer Autosystem XL gas chromatograph with thermal conductivity detector (TCD) equipped with an Elite Plot Q column for the analysis of light hydrocarbons. On the 67th day, the 3rd reactor finished generating biogas, and this fact marked the end of the experiment.
4. Results and Discussion
Table 6. Results of the experiment
Reactor L biogas/kg d.w. % methane mL methane/kg d.w.
1st reactor 5.27 0.01 7.73
2nd reactor 8.62 26.17 1387.36
3rd reactor 149.65 64.71 74286.77
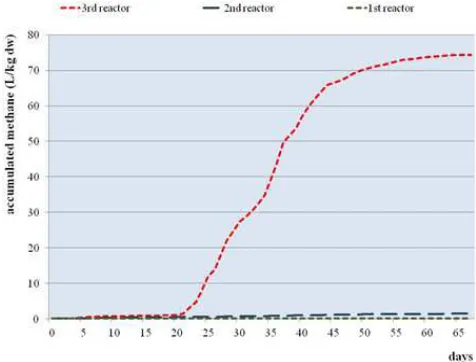
Data showing the results of the accumulated volume of biogas produced during anaerobic digestion are shown in Figure 5. The evolution of methane concentration in biogas is shown in Figure 6. After anaerobic digestion, in the 3rd reactor, the decrease in the percentage of volatile solids was 25.39%. In the 2nd reactor, after fermentation, the percentage of volatile solids decreased by only 8.63%. At the end of anaerobic digestion, the 1st reactor consumed the lowest percentage of volatile solids, 1.86%, producing just a small amount of biogas. In reactor 3, the volume of biogas accumulated over the 67 days of fermentation amounted to 149.65 liters. Methane volume was 115.23 L/kg d.w. The net heating value of methane is 37,200 kJ/m3, thus, a total
calorific value of 4,290 kJ/kg d.w. can be obtained from the experiment, which converted into energy is 1.19 kWh/kg d.w. Table 6 shows a summary of the average data.
The results obtained are unexpected, above all in the 3rd reactor, since the material should already be stabilized because it has been digested aerobically. In fact, the results obtained are larger than the volume of biogas released in landfills (60 m3/t d.w. [13] or 82.43 m3/t w.w. [14]) but lower than other types of anaerobic fermentation, such as poultry manure (460 m3/t [15]), pig slurry (390 m3/t [15]) or mixed sludge (325 m3/kg VS [16]), and similar to MSW (125-150 m3/t w.w. [17]). The methane concentration in the biogas in the 3rd reactor is also similar to other sorts of biogas generation, between 55-75% [13, 14, 16] (Figure 7). This therefore means that the composting process has not been complete in the substrate of the 3rd reactor. In fact, the percentage of volatile solids has decreased significantly (Table 7), above all in the 3rd reactor. Digestion in the composting plants in the substrates of the 2nd and the 1st reactors was better, especially in the 1st reactor, where biogas production was really low.
Figure 5. Accumulated methane in the three reactors
Figure 7. Comparison between the volumes of methane generated in the 3rd
reactor and other substrates
Furthermore, it is important to consider that the fermented substrate was the refuse from the compost refining process, i.e., the biowaste was digested aerobically and the resulting compost was then separated from the other unwanted material such as plastic, paper, cardboard, metal, glass, etc. This could be caused by the composting process lasting less time than recommended, or composting conditions that are not optimal, due to an increase in the amount of urban waste at certain times, which exceeds the capacity of the composting plant.
On the other hand, this refuse usually ends up on a landfill. So, if the refuse is not completely stabilized, it will be digested anaerobically and it will contribute to the generation of biogas, which can be an additional concern in landfills, and is in breach of the European Council Directive 1999/31 of 26 April 1999 on the landfill of waste.
Table 7. Physical-chemical analysis of sludge samples after fermentation (d.w.)
Samples Moisture (%) Total solids (%) Volatile solids (%) Decrease in volatile solids (%)
1st reactor 74.23 25.77 52.83 28.23
2nd reactor 71.05 28.95 65.54 17.00
3rd reactor 79.81 20.19 41.09 44.19
Thirdly, in the substrates of the 1st and 2nd reactors (CR1 and CR2) there were more improper materials than in the 3rd reactor and therefore more bulking material (plastic bags, paper, cardboard, etc.), which favors the aerobic process (Tables 1, 2 and 3). In the substrate of the 3rd reactor the bulking material seems to exert less influence. It is thought that the substrate of the 3rd reactor was almost certainly not completely fermented before the experiment started. Thus, under suitable conditions it can undergo a second fermentation.
As regards the composition of the three types of refuse, CR3 contains a bigger percentage of organic material (90% CR3; 80% CR1 and CR2). Nevertheless, the difference is not so big as to be the only cause of the generation of biogas.
5. Conclusions
In some composting plants, aerobic fermentation is not complete, which leads to the dumping of unstabilized waste (refuse) in landfills. This refuse could be fermented anaerobically prior to its being dumped, thereby generating useful biogas and reducing methane emissions in landfills.
Hence, in composting plants that only receive biowaste, a bulking material (e.g., gardening waste) should be added previously and, as a result, better aeration would improve the composting process.
References
[1] Directiva 2008/98/CE del Parlamento Europeo y del Consejo de 19 de noviembre de 2008 sobre los residuos y por la que se derogan determinadas Directivas. (DOUE L 312, de 22.11.2008).
[2] Directiva 1999/31/CE del Consejo, de 26 de abril de 1999, relativa al vertido de residuos (DOCE L 182, de 16.7.1999).
[3] Eurostat news release nº 33/2013: http://ec.europa.eu/eurostat Access 04/2014.
[4] A P. Economopoulos (2010) Technoeconomic aspects of alternative municipal solid wastes treatment methods, Waste Management , 30, pp. 707–715.
[5] J. Nithikul, O.P. Karthikeyan, C. Visvanathan (2011) Reject management from a Mechanical Biological Treatment plant in Bangkok, Thailand. Resources, Conservation and Recycling,
55, pp. 417–422.
[6] C. Montejo, P. Ramos, C. Costa, M.C. Márquez (2010) Analysis of the presence of improper materials in the composting process performed in ten MBT plants. Bioresource Technology, 101, pp. 8267–8272.
[7] D. Bernad-Beltrán (2013) Integración de la metodología de Análisis de Ciclo de Vida (ACV) y Sistemas de Información Geográfica (SIG) para la evaluación ambiental de sistemas de gestión de residuos. Doctoral Thesis. Universitat Jaume I. Spain. Spanish.
[8] JRC (2011). Supporting Environmentally Sound Decisions for Bio-Waste Management. –A practical guide to Life Cycle Thinking (LCT) and Life Cycle Assessment (LCA) in the context of bio-waste management. JRC Scientific and Technical Reports. European Union. Joint Research Centre (JRC). Institute for Environment and Sustainability (IES).
[9] C. Cavinato, D. Bolzonella, P. Pavan, F. Fatone, F. Cecchi (2013) Mesophilic and thermophilic anaerobic co-digestion of waste activated sludge and source sorted biowaste in pilot and full-scale reactors, Renewable Energy, 55, pp. 260-265.
[10] O. Buenrostro, S. Cram, G. Bernache, G. Bocco (2000) La digestión anaerobia como alternativa de tratamiento a los residuos sólidos orgánicos generados en los mercados municipales. Revista Internacional de Contaminación Ambiental, 16(1), pp. 19-26
[12] J.J. Lay, Y.Y. Li, T. Noike (1997) Influences of pH and moisture content on the methane production in high-solids sludge digestion, Water Research, 31(10), pp. 1518-1524
[13] Q. Aguilar-Virgen, S. Ojeda-Benítez, P. Taboada-González, M. Quintero-Núñez (2012) Estimación de las constantes k y L0 de
la tasa de generación de biogás en sitios de disposición final en Baja California, México. Revista Internacional de Contaminación Ambiental, 28, pp. 43-49.
[14] M. Zamorano, J. I. Pérez, I. Aguilar, A. Ramos (2007) Study of the energy potential of the biogas produced by an urban waste landfill in Southern Spain, Renewable and Sustainable Energy Reviews, 11, pp. 909–922
[15] [M. Krishania, V. Kumar, V. Kumar Vijay, A. Malik (2013) Analysis of different techniques used for improvement of biomethanation process: A review, Fuel, 106, pp. 1-9.
[16] L. Pastor, L. Ruiz, A. Pascual, B. Ruiz (2013) Co-digestion of used oils and urban landfill leachates with sewage sludge and the effect on the biogas production, Applied Energy, 107, pp. 438-445.