http://www.sciencepublishinggroup.com/j/ajtte doi: 10.11648/j.ajtte.20180303.11
ISSN: 2578-8582 (Print); ISSN: 2578-8604 (Online)
Performance Evaluation of Grade Separation Within the
Selected Major Intersection in Addis Ababa City
Sentayehu Leleisa
1, *, Emer Tucay Quezon
2, *, Teyba Wedajo
31
Highway Engineering Stream, Institute of Technology, Dire Dawa University, Dire Dawa, Ethiopia 2Department of Civil Engineering, Institute of Technology, Ambo University, Ambo, Ethiopia
3
Highway Engineering Stream, Jimma Institute of Technology, Jimma University, Jimma, Ethiopia
Email address:
*
Corresponding author
To cite this article:
Sentayehu Leleisa, Emer Tucay Quezon, Teyba Wedajo. Performance Evaluation of Grade Separation Within the Selected Major Intersection in Addis Ababa City. American Journal of Traffic and Transportation Engineering. Vol. 3, No. 3, 2018, pp. 41-49.
doi: 10.11648/j.ajtte.20180303.11
Received: July 4, 2018; Accepted: July 16, 2018; Published: August 15, 2018
Abstract:
Urban City Traffic Management introduced various remedies to decongest traffic and to reduce the severity of accidents, such as providing traffic signal controls at the intersecting roads at different levels, or grade separating the traffic movement towards different directions. One type of grade separation is Road Underpass or Flyover. The construction of Road Underpass or Flyover poses some doubts whether it is effective or ineffective on the point of views of the travelers or motorists. It is for this reason that this research sought to evaluate the performance and effectiveness of Road Underpass structure on traffic flow at the major intersection, specifically the Wellosefer intersection in Addis Ababa City. The primary data used the existing traffic volume recorded between 7:00 AM – 6:00 PM from Monday to Friday. While the secondary data obtained from the Consulting Office "before" the improvement of Wellosefer intersection, including the previous study, which served as the control analysis for the research. From these data, the analyses provided results on vehicle travel time and delay for a case "before" and "after" improvement of the intersection. SIDRA Software was used to analyze the traffic conditions of the intersection. Based on the findings of the study, a case "before" Improvement of Wellosefer Unsignalized T-Intersection indicated with an average delay of vehicles of about 535.7 seconds, and a travel time of vehicles of about 574.7 seconds. On the other hand, a case "after" Improvement of Wellosefer intersection, three alternatives considered; such as 1) Signalized T-Intersection, 2) Roundabout, and 3) Road Underpass with Roundabout at the upper level. The results of the first alternative showed the Signalized T-intersection indicated an average delay and travel time of 344.3 seconds and 365.0 seconds, respectively. It means, there could be a reduction of 15.4% in average delay if signalized intersection implemented. The second alternative, a case of Roundabout using the same traffic data at current condition, the results indicated the motorists and commuters would be experiencing an average delay of about 355.8 seconds and average travel time of 390.0 seconds. The third alternative considering Road Underpass with Roundabout at the upper level, the results revealed that there was a significant reduction in average delay of vehicles of about 42% from the Unsignalized T-Intersection. Comparing this result with the Signalized intersection using the same traffic data, it showed that there was a significant decrease in average delay. Therefore, the findings of the study, a combination of Road Underpass and Roundabout at the upper level as in the case of Wellosefer intersection performed well than the other traffic control design alternatives.Keywords:
“Before” and “After” Improvement, Flyover, Road Underpass, Traffic Control Design Alternatives, Travel Time & Delay, Traffic Volume, Traffic Conflict, Traffic Congestion1. Introduction
Travel time, a fundamental measure in transportation, is
travel because of traffic frictions and traffic control devices. Travel time and delay studies are used to evaluate traffic conditions such as the onset of congestion along major corridors, and the impacts of developments such as transportation infrastructure, commercial, residential and industrial projects [1].
In general, a capacity of the entire road network is dominated by capacity at intersections. Thus, there is a possibility to enhance the performance of the whole system in the urban area, if the capacity of a severe bottleneck of an intersection increased. Therefore, an implementation of a flyover or underpass for a crossing has been one of the most popular measures to alleviate traffic congestion. It must be emphasized when using flyover or road underpass, the weaving section of traffic flow at separation level can only be reduced by relocating the pedestrian and vehicle stop far away from the separation level being more effective by eliminating the weaving behavior before entering the flyover [2].
An exclusive flyover or road underpass proposed with significant construction cost and minimum environmental degradation would be impacted. This is to overcome some obstacles. Although the resource consumptions of this new facility are not as much of the ordinary traffic control alternatives, there is still a question on its effectiveness in improving congestion condition. This point of view should be evaluated in this study. Because most existing evaluation approaches to assess the capacity of an intersection seems inapplicable to the situation under oversaturated flow and a wide range of heavy vehicle mixing rate. Also, this research needs to develop a specific evaluation methodology for this particular facility. Eventually, it intends to investigate the feasibility to implement the exclusive flyover and road underpass for smaller vehicles as a countermeasure for alleviating traffic congestion at a saturated intersection [3-5].
This research focused exclusively on the reduction of traffic congestion. In some cases, an optimization towards traffic congestion reduction is likely to influence both safety and pollution-related challenges positively. Congestion can be measured in the average delay experienced per vehicle. To be able to measure the delay, single vehicle tracking is needed. Since the available data did not support this method, this research considered on maximizing the throughput at intersections. Assuming a demand more extensive than the supply, an increase of vehicle throughput at the junction causes a decrease in (local) congestion [6].
One type of grade separation is flyover or road underpass, of which this research study conducted to evaluate its effectiveness. The decision to opt for road underpass for particular intersection or with adjacent intersections is considered, based on the financial constraints. In Addis Ababa City, the effect of a road underpass or flyover on the traffic flow along the trunk roads did not often analyze in details before it was implemented. As a consequence, after the completion of the road underpass or flyover structure, congestion issue shifted to other locations or the treatment
would not have yielded the anticipated results.
In Addis Ababa city, nowadays congestion is increasing day today because of many cases likely rising in the number of a vehicle, less improvement of old roads and due to the types of vehicles which are contributing conflict along the road most of the time such as long and old vehicles. All major intersections in Addis Ababa were initially observed to pick one intersection, which represents the study area. Based on observation and data from Addis Ababa City Road Authority (AACRA) [7], Wellosefer was the most problematic intersection “before” improvement by road underpass with a roundabout at the upper level, due to high traffic volume of vehicles passing through it.
This research provided the analysis based on the data gathered from the field survey for traffic volume counting, including traffic data from AACRA. These data helped the researcher to know the effect of road underpass on the traffic flow by considering the case "before" and "after" the structure was constructed at Wellosefer intersection. This approach of the analysis would show how much travel time and delay will be reduced as a consequence of traffic congestion in the study area. During the field survey, road geometry, and traffic flow conditions like vehicle queues and travel patterns through the intersection were examined. These identified and noted whether it would interfere with upstream intersections by using SIDRA intersection software. Since there was no precise methodology during the design phases of any intersection, which usually guided by the geometry of the intersection, trial and error procedure usually adopted [8].
2. Stud Area and Research Methodology
2.1. Study Area
The study was conducted in Addis Ababa City, the Central City in Ethiopia. Its geographical coordinates are 90 0‘19.4436“ N latitude and 38°45'48.9996" E longitude with an estimated area of 527 Sq.km. The City is found in an area of average altitude of about 2,355m above sea level. The specific area of the study is Wellosefer intersection, which composed of road underpass and roundabout at the upper level. This major intersection was entirely controlled by traffic enforcers to manage the traffic movements for different streams. “Before” improvement of Wellosefer intersection, it was Unsignalized T-intersection and no underpass structure. The lane width of the through lane was 2.7 meters, while the turning lane (from the left and right movements) was 3.0 meters. The current geometric layout “after "improvement of the intersection, the total width of asphalt pavement has 40 meters, at 3.62 meters wide for each lane and two lanes per direction. Previous data showed that Wellosefer intersection was one of the most congested corridors in Addis Ababa City. The main corridors along this intersection are those roads from Bole International Airport, Meskel Square and Ethio- Chaina Street.
Figure 1. Road Corridor "before" Improvement (Source: [9]).
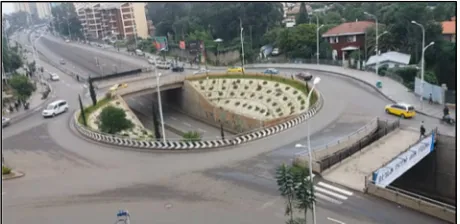
Figure 2. Road Corridor "after" Improvement. Source: Photo Taken August 8/2017.
2.2. Study Design
The research conducted using both descriptive and analytical methods. It was designed in the way that essential and exact information could be acquired to analyze travel time and delay of vehicles related to the different intersection design control alternatives.
2.3. Sampling Technique and Sampling Procedures
Based on the objective of the study, the researcher applied a purposive sampling method which is used in determining the sampled area on the study. Wellosefer intersection was selected, and it observed to be more challenging than other intersections as being perceived by the researcher based on previous traffic data. Also, the segment is a major road in the city where one can find different embassies.
2.4. Data Collection Method
The data collection involved different types of data which satisfied the requirements of the analysis using traffic parameters. These data collected through primary and secondary data which entailed Quantitative and Qualitative types of research methods.
2.4.1. Traffic Volume Count
Video recording was undertaken to gather Traffic Volume at Wellosefer intersection. This method was used to count and tabulate the number of vehicles, according to each type by viewing the video. The period of video recording started from Monday to Friday in August 7-11, 2017. It was a 5-day collection period, which started from 7:00 AM-7:00 PM. The traffic volume picked from a 15-minute time interval, classifying by cars & utilities, mini-buses and trucks.
2.4.2. Passenger Car Unit Analysis Before Improvement
Passenger Car Unit (PCU) analysis is necessary because it considers different characteristics of a car such as width, length, and the height that caused severe variations in the traffic stream. Due to different length, width and height, each vehicle type has different effects on the traffic flow. The PCU values are based on the headway method of analysis. In the study intersection, the vehicles were grouped as shown in Table 1.
Table 1. PCU Values per Vehicle Class, Grouped Per Location and Per Direction of Traffic Flow.
Location
Vehicle Type PCU factor Wellosefer Intersection
Straight/Through Movement Mini-bus 0.92
Heavy vehicle 1.11
Turning Movement Mini-bus 0.82
Heavy vehcile 0.94
2.5. Data Analysis
Wellosefer intersection were analyzed using SIDRA Software Version 5.1. In addition, a simple existing Road Audit was conducted to clarify the problem at-already completed Road Underpass structure in the study area.
3. Results and Discussion
3.1. Vehicles Contributory to Conflicting Traffic Flow
In this study, it observed that the flow of vehicles in dissipating queues classified into either non-following vehicles (i.e., Slow vehicles with a time headway of more than 4 seconds) and following vehicles (i.e., Vehicles with a time headway smaller than 4 seconds). The share of non-following vehicles appeared to have a significant influence on the flow rate. The other influences on the saturation flow are kept constant and equal to the average observed value. It is clear that a decrease of the share of non-following vehicles increase both the vehicle flow rate and the passenger flow rate. From this, a reduction to a share of 5% of non-following vehicles would increase the PCU flow rate.
Based on the results "before" the improvement, there were two main reasons caused non-following vehicles. These were low accelerating capacities of old vehicles, and slow responding driving time. Likewise, "after" the improvement, the site observation, including the data taken from the consultant company of the road project indicated that there were several causes of vehicle conflict, such as the narrow width of the entry and exit lanes, parking space and the presence of long vehicles plying the route.
Figure 3. The interference flow in PCU/HR versus share of non-following vehicles.
3.2. Travel Time and Delay Analyses for “Before” and “After” Improvement
3.2.1. Traffic Volume “Before” Improvement of Wellosefer Intersection
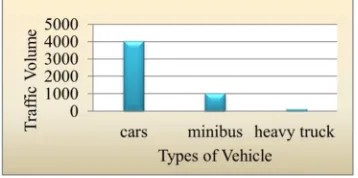
The highest recorded number of vehicles in the conflict group was 2,128 vehicles or 3,663 PCU.
Figure 4. Traffic Volume by Vehicle Type “before” Improvement (Unsignalized).
Table 2. Vehicle Composition, Grouped Per Direction of Traffic Flow.
Location
Number of cars (%) Number of mini busses (%) Number of Heavy vehicles (%) Wellosefer intersection
Straight/Through movements 2356 (71%) 916 (27%) 66 (2%)
Turning movements 1681 (91%) 114 (6%) 59 (3%)
3.2.2. Average Delay and Travel Time Analyses "before" improvement of Wellosefer Intersection
A two-hour traffic data was considered for the average delay and travel time analyses. Table 3 shows the results per approach legged of Wellosefer Intersection.
Table 3. Average Travel Time and Delay Analysis.
Wellosefer Intersection Approach legged Average delay (Second/veh) Average Travel time (Second)
Meskel Square 20.7 19.9
Bole 1014.8 365.6
Chaina Street 607.5 34.0
Intersection 535.7 574.7
From the output of the analysis, the average delay and the average travel time are 535.7 Seconds and 574.7 Seconds, respectively. These results indicated a relatively high delay and travel time incurred by the motorists, and the travelling public.
3.2.3. Current Traffic Volume at Wellosefer Intersection “After” Improvement
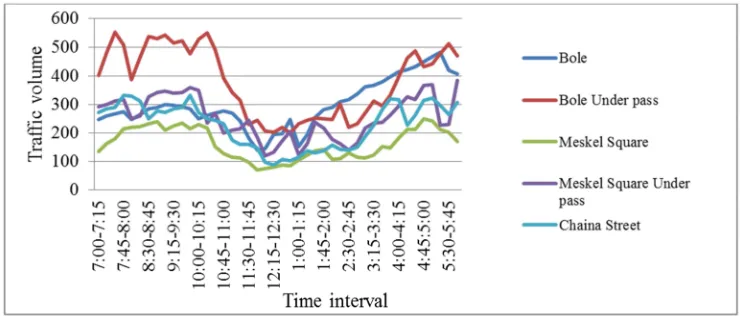
Figure 5. Traffic Volume Every 15minutes interval.
The results of the survey as plotted in Figure 6, from 7:30 AM -7:45 AM and 10:15 AM – 10:30 AM indicated the peak period, which showed the highest traffic volume for the 12-hour traffic volume counting represented by Bole underpass. It was the highest number of vehicles than the other approaches of Wellosefer intersection. It means the traffic
generated by this approach was due to its proximity area around the Bole International Airport that attracts motorists and commuters to use this intersection.
Monday had the highest traffic volume of the week with a peak period in the morning started at 9:00 AM-10:00 AM, and peak period in the afternoon from 5:00 PM-6:00 PM.
Figure 6. Traffic Volume by vehicle type "after." Improvement.
Figure 6 shows the different types of vehicles such as a car, 4-WD, and taxi. These vehicles shared a large number of vehicle's percentage using the intersection. Through follow-up field visits, it observed that the composition of a shared large number of vehicles in the study area due to the presence of various establishments such as embassies, shops, and residential houses that attracts the traffic movements. The same area whereby Bole International Airport is within a short distance. The field observations supported the findings that only a few large vehicles using this section of road as compared to passenger cars and mini-buses, but its effect to the traffic stream was very significant.
3.3. Travel time and Delay Analysis for Signalized T - Intersection "Without" Road Underpass & Roundabout
The current traffic volume of the road underpass and the
roundabout at the upper level were added to analyze the intersection as signalized T-intersection. The analyses were guided by the questions: What if the intersection improved by a traffic signal light instead of the underpass and roundabout? What will be the average delay and travel time at the intersection nowadays? The researchers assumed that the geometric layout of the Signalized T-intersection is similar to the Unsignalized intersection when the traffic light installed for the analysis. The additional parameters considered in the analysis of signalized intersection are phasing, signal timing, traffic volume and road geometry.
Table 4. Values for Maximum Green Duration.
Phase Facility Type Maximum Green Time (Sec)
Through
Major arterial (speed limit exceeds 40mph) 50 to 70
Major arterial (speed limit 40mph or less) 40 to 60
Minor arterial 30 to 50
Collector, local driveway 20 to 40
Left-Turn Any 15 to 30
(Source: Manual Uniform Traffic Control Design)
In the study area, the intersection identified as a major Arterial with an established speed limit exceeds 40mph. Therefore, from table 4, the maximum green time considered in the analysis with an average of 50 Seconds to 70 Seconds. On the other hand, the signal- fixed time, the practical cycle time 160 Seconds = sum of all green + yellow +
(all-red=2sec.)), while the Phase time was determined by the program as follows:
Sequence: Split Phasing Input Sequence: A, B, C Output Sequence: A, B, C, A
Figure 7. Diagram of signal phasing.
Figure 8. Diagram of Signal Phasing of Intersection.
Table 5. Phase Time Determined using SIDRA Program.
Phase A B C
Green time (Sec) 60 60 35
Yellow time (Sec) 3 3 3
All-red time (Sec) 2 2 2
Phase time (Sec) 65 65 40
Phase split 46% 46% 20%
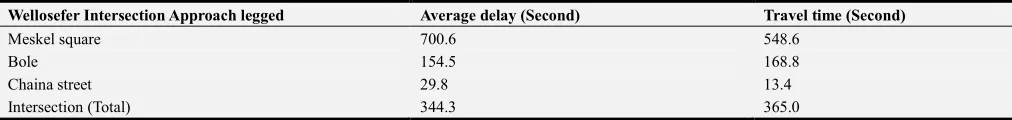
In table 6 below, the result indicated the average delay of 344.3
seconds that may be incurred by the motorists and commuters, with an equal travel time of 365.0 seconds. This average delay was lower than the computed value for Unsignalized intersection "before" the improvement of the intersection. Hence, this support the condition, once Wellosefer intersection provided with traffic signal control as improvement alternative, there was a significant reduction in delay at different traffic flow directions than the Unsignalized intersection.
Table 6. Output of the Analysis on Average Delay and Travel Time for Signalized intersection.
Wellosefer Intersection Approach legged Average delay (Second) Travel time (Second)
Meskel square 700.6 548.6
Bole 154.5 168.8
Chaina street 29.8 13.4
3.4. Travel Time and Delay Analysis for the Case of Roundabout only
Roundabout considered as an alternative improvement of the intersection in the analysis. Similarly, it was guided by the question: what will be the performance of the intersection considering the current traffic condition?
In this case, the traffic volume of the underpass and the
traffic volume of the upper level combined to use for the analysis of a roundabout. Based on the total traffic volume, it required additional lane for Meskel Square to Bole approach to accommodate the current traffic volume. In addition, the assumption in the analysis, all approach legged at the same level would be increased the number of lanes, including the road width widening.
Table 7. Input values for the analyses of average delay and travel time for the case of roundabout only.
Roundabout
Wellosefer Intersection Traffic Volume Heavy vehicle factor (%)
Approached legged No. of entry lane No. of exit lane Lane width (m) Medium width (m) TH LT RT TH LT RT
Meskel Square 4 4 3.62 1 2257 - 651 0.46 - 0.35
Bole 4 4 3.62 1 3202 1288 - 1.04 0.4
-Chaina 3 2 3.62 1 - 242 1320 - 0.6 0.93
Table 8. Additional Input Values.
Geometric Data
Circulating lane width (m) 4.81
Number of Circulating lane 4
Lane length (m) 317
Island diameter (m) 20
The above table 8 indicated values for the additional geometric parameters for the roundabout which are used in the Sidra Software [10].
From the above roundabout geometric layout, it indicated the island diameter, number of circulating lane, number of entry lane and number of exit lanes, which are also shown in table 8.
Table 9. Output for the Analysis of Average Delay and Travel Time for roundabout only.
Approach legged Average delay (Sec) Travel time (Sec)
Meskel square 453.5 368.8
Bole 8.0 44.5
Chaina street 1250.2 362.1
Intersection (Total) 355.8 394.0
Table 9 shows the average delay and travel time of motorists and commuters to be incurred of about 355.8 seconds and 394.0 seconds, respectively. From this result, improvement of the intersection with roundabout only as an alternative was not enough to reduce the average delay and the travel time, as it compared with the Signalized T-intersection. However, in case the roundabout only to be considered as an improvement, the lane width and the number of lanes had to be increased up to four lanes. It will help to decongest the intersection as well as to cater to the current traffic volume nowadays. But, if introducing additional lanes for the roundabout, the average delay and travel time are still higher than the intersection with traffic signal control. It means, considering a roundabout only as improvement alternative, the performance level of intersection is not stable.
3.5. Travel Time and Delay Analysis for Road Underpass With Roundabout "After" Improvement
As described in the analysis considering "after" improvement, travel time and average delay used as performance measures.
The analyses were made separately for the traffic volume of Roundabout at the upper level and the road underpass. The existing number of lanes for the underpass consist of 2- lanes in 1-direction, while the upper level (roundabout) consists of 2-lanes for all approach legged as shown in figure 9.
Figure 9. Intersection "after" Improvement (Source: Photo Taken August 8/2017).
The current traffic condition was evaluated in the case of road underpass with a roundabout at the upper level. It was done by comparing the results with Unsignalized, signalized, and roundabout only. The traffic flow at the road underpass was directed along Meskel Square - Bole, comprising two lanes in one direction with 3.62 meters lane width.
Table 10. Output of the Analysis of Average Delay and Travel Time “after” improvement.
Approach legged Average delay (Sec) Travel time (Sec)
Meskel square 8.9 6.9
Bole 9.2 18.0
Chaina street 7.2 12.9
Intersection (Total) 8.5 48.1
Based on the analysis of the current condition of the intersection, table 10 indicated the average delay and the travel time of 8.5 second and 48.1 seconds, respectively. The results showed that the motorists can incur almost negligible delay when crossing the intersection.
3.6. Comparison of Average Delay and Average Travel Time Based on the Different Alternatives
presented the discussions about the effectiveness of a road underpass on the traffic flow, differentiating the traffic control systems and the improvement alternatives at Wellosefer intersection. One of which was the provision of a traffic signal control at the intersection. Nowadays, in Addis Ababa City, traffic signal control installations at intersections are introduced at highly congested intersections by removing the existing
roundabouts. This research study provided an excellent indication to which improvement alternative would be then implemented by comparing the results using options of three different types of an intersection as a basis for evaluation.
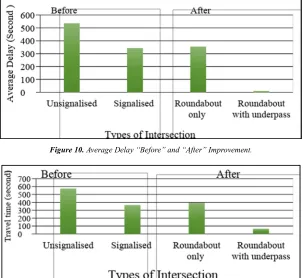
Figures 10 and 11 below show the results of the average delay and travel time for each alternative type of intersection.
Figure 10. Average Delay “Before” and “After” Improvement.
Figure 11. Travel Time “Before" and "After" Improvement of Wellosefer Intersection.
The results from figures 10 and 11 demonstrated cases on average delay and travel time of vehicles “before” and “after” the improvement alternatives of Wellosefer intersection.
The traffic condition "before" improvement considering Unsignalized T-intersection indicated the average delay of vehicles of about 535.7 Seconds, while the travel time of vehicles of about 574.7 Seconds. It means the motorist and commuters incurred long delays within the intersection.
On the other hand, the case "after" improvement considering the current traffic condition by analyzing a Signalized T-Intersection, the results indicated an average delay and travel time of 344.3 seconds and 365.0 seconds, respectively. It means that there was a reduction of 15.4% in average delay when a signalized intersection alternative would be implemented nowadays. Likewise, the case "after" improvement considering the same current traffic condition using the existing geometric layout of Road Underpass with Roundabout at the upper level, there was a considerable reduction in average delay of vehicles of about 42% from the Unsignalized T-Intersection.
From those foregoing results, it revealed that a combination of road underpass with a roundabout at the upper level was almost three times more effective than the other two
improvement alternatives due to significant reduction of average delay experienced by the motorists and commuters.
4. Conclusion
Based on the findings of this research, the following conclusions are drawn:
A Case “Before” Improvement of Wellosefer Unsignalized T-Intersection
It was found out that mostly affecting the traffic movements were old vehicles and slow driving vehicles, which turns into conflict with the other vehicles while maneuvering a left turn and right turn movements from Bole Road, Meskel Square and Chaina Street. Therefore, it considered this as one factor on the occurrence of delay of vehicles in the intersection, aside from high traffic volume.
A Case “After” Improvement of Wellosefer considering Signalized T-Intersection, Roundabout only, and Road Underpass with Roundabout at the upper level
traffic signal control at the intersection will improve the operational level due to the reduction of average delay.
In the case of Roundabout only as improvement alternative using the same current traffic data gathered in August 7-11, 2017 to check the performance of the intersection, the results indicated that the motorists and commuters could be experiencing an average delay of about 355.8 seconds and average travel time of 390.0 seconds. Hence, a roundabout only as an improvement alternative to the current set up is not advisable. It means the delay is not already within the tolerable limit at Wellosefer intersection.
Likewise, for the case "after" improvement considering the existing geometric layout of Road Underpass with Roundabout at the upper level. Based on the findings of this research, there was a significant reduction in average delay of vehicles of about 42% from Unsignalized T-Intersection when considered as the baseline results for evaluation. Therefore, comparing these results with the Signalized intersection using the same traffic data at current condition, it indicated that there was a significant reduction in average delay.
Therefore, in comparing the different results using different intersection design control alternatives, a combination of Road Underpass and Roundabout at the upper level has a great advantage as in the case of Wellosefer intersection. It is the most effective alternative for a particular problematic intersection. It is worth mentioning the intersection design and traffic controls, including construction of structure as an alternatives is enough to make better movements of the traffic flow.
Acknowledgements
The authors wish to express their profound gratitude to the Jimma Institute of Technology, Jimma University and Ethiopian Road Authority (ERA), without the financial support, this research work could not be completed.
References
[1] Macababbad, R. J, Regin, J. R (2011). A Study on Travel Time and Delay Survey and Traffic Data Analysis and Visualization Methodology; Proceedings of the Eastern Asia Society for Transportation Studies, Vol 8.
[2] Quezon, Emer T. (1994), Study on Effects of Flyover
Construction of Traffic Flow: The Case of Metro Manila, SERP-P, RP NCTS 1994-01; Pp. 520-526,
https://serpp.pids.gov.ph/publication_detail?id=1155.
[3] Amott, R, A. De Palama. (1991). Does Providing Information to Drivers Reduce Congestion, 309-318.
[4] Black, W. A. (2003). Transportation: a Geographical Analysis, New York: Guilford Press.
[5] Demrew W. (2009). Towards Sustainable Land Use of Urban and Peri‐Urban Areas. In Construction Ahead, Vol. 11. Addis Ababa.
[6] Department for Transport (2000b). A Measure of Road Traffic Congestion in England Research, 147-154.
[7] Addis Ababa City Roads Authority, (AACRA). Geometric Design Manual. 2004.
[8] Tarekegn K., E. T. Quezon, (2016); Effect Of Cycle Time And Signal Phase On Average Time Delay, Congestion And Level Of Service: A Case Study At Hager Astedader Signalized Intersection in Addis Ababa; IJSER, Vol 7, Issue 10, Pp524-530.
[9] J. W. Zwarteveen (2011). Urban Traffic Flow Modeling in Addis Ababa.
[10] Akcelik, R. (1991). Implementing roundabout and other Unsignalised intersection analysis method in SIDRA. Australia road research board working document WDTE91/002.
[11] HCM, Highway Capacity Manual 2000. 4th Edition.
[12] Crawford, J.,. (2011). A Michigan Toolbox for Mitigation, Traffic Congestion. Texas.
[13] Mohammad Abojaradeh (2013), Travel Time and Delay Study to Improve Public Transit System in Jordan. Journal of Environment and Earth Science, Vol. 3, No. 4. 2013.
[14] Final Report (2006). Transit Speed and Delay Studies, Florida Department of Transportation, Public Transit Office. Kittelson & Assoxiates, Inc.
[15] Yan xing, et. al (2016). Study of Vehicle Delay Based on the Vehicle Arriving Distribution at Entrance Lanes of Intersection. ScienceDirect, Procedia Engineering 137 (2016 ) 599–608.
![Figure 1. Road Corridor "before" Improvement (Source: [9]).](https://thumb-us.123doks.com/thumbv2/123dok_us/8570867.1716639/3.595.47.287.380.557/figure-road-corridor-improvement-source.webp)