Open Peer Review
Discuss this article
(0)
Comments SOFTWARE TOOL ARTICLE
CoverView: a sequence quality evaluation tool for next
generation sequencing data
[version 1; referees: 2 approved]
Márton Münz ,
Shazia Mahamdallie
, Shawn Yost
, Andrew Rimmer ,
Emma Poyastro-Pearson
, Ann Strydom
, Sheila Seal
, Elise Ruark
,
Nazneen Rahman
1-3
Division of Genetics & Epidemiology, The Institute of Cancer Research, London, SM2 5NG, UK TGLclinical, The Institute of Cancer Research, London, SM2 5NG, UK
Cancer Genetics Unit, Royal Marsden NHS Foundation Trust, London, SM2 5PT, UK
Abstract
Quality assurance and quality control are essential for robust next generation sequencing (NGS). Here we present CoverView, a fast, flexible, user-friendly quality evaluation tool for NGS data. CoverView processes mapped
sequencing reads and user-specified regions to report depth of coverage, base and mapping quality metrics with increasing levels of detail from a
chromosome-level summary to per-base profiles. CoverView can flag regions that do not fulfil user-specified quality requirements, allowing suboptimal data to be systematically and automatically presented for review. It also provides an interactive graphical user interface (GUI) that can be opened in a web browser and allows intuitive exploration of results.
We have integrated CoverView into our accredited clinical cancer
predisposition gene testing laboratory that uses the TruSight Cancer Panel (TSCP). CoverView has been invaluable for optimisation and quality control of our testing pipeline, providing transparent, consistent quality metric information and automatic flagging of regions that fall below quality thresholds. We demonstrate this utility with TSCP data from the Genome in a Bottle reference sample, which CoverView analysed in 13 seconds.
CoverView uses data routinely generated by NGS pipelines, reads standard input formats, and rapidly creates easy-to-parse output text (.txt) files that are customised by a simple configuration file. CoverView can therefore be easily integrated into any NGS pipeline. CoverView and detailed documentation for its use are freely available at
and
github.com/RahmanTeamDevelopment/CoverView/releases www.icr.ac.uk/CoverView
Keywords
NGS, Quality Sequencing Minimimum, QSM, quality assurance, quality control, depth of coverage, base quality, mapping quality, genetic testing
1
1,2
1,2
1
1,2
1,2
1,2
1,2
1-3
1
2
3
Referee Status:
Invited Referees
version 1
published 04 Apr 2018
1 2
report report
, The University of
Richard Bagnall
Sydney, Australia 1
, University of Pittsburgh, USA
Somak Roy 2
04 Apr 2018, :36 (
First published: 3
)
https://doi.org/10.12688/wellcomeopenres.14306.1
04 Apr 2018, :36 (
Latest published: 3
)
This article is included in the
Transforming Genetic
gateway.
Medicine Initiative (TGMI)
Nazneen Rahman ( )
Corresponding author: [email protected]
: Conceptualization, Software, Writing – Original Draft Preparation; : Conceptualization, Methodology,
Author roles: Münz M Mahamdallie S
Writing – Review & Editing; Yost S: Conceptualization, Methodology, Writing – Review & Editing; Rimmer A: Conceptualization, Software; : Methodology; : Supervision; : Methodology, Supervision; : Conceptualization, Validation;
Poyastro-Pearson E Strydom A Seal S Ruark E
: Conceptualization, Formal Analysis, Funding Acquisition, Supervision, Writing – Original Draft Preparation
Rahman N
No competing interests were disclosed.
Competing interests:
The work was supported by the Wellcome Trust [200990].
Grant information:
The funders had no role in study design, data collection and analysis, decision to publish, or preparation of the manuscript.
© 2018 Münz M . This is an open access article distributed under the terms of the , which
Copyright: et al Creative Commons Attribution Licence
permits unrestricted use, distribution, and reproduction in any medium, provided the original work is properly cited.
Münz M, Mahamdallie S, Yost S
How to cite this article: et al.CoverView: a sequence quality evaluation tool for next generation
Wellcome Open Research 2018, :36 ( )
sequencing data [version 1; referees: 2 approved] 3 https://doi.org/10.12688/wellcomeopenres.14306.1
04 Apr 2018, :36 ( )
Introduction
Next generation sequencing (NGS) has transformed genetic medicine by dramatically reducing the cost and time of genetic testing, which has led to a rapid global expansion in clinical genetic testing1. It is obviously crucial that these tests are
accurate, with low false positive and false negative error rates. Robust quality assurance and quality control are required to minimise these errors and thus ensure reliable test results2.
Three primary metrics are used to evaluate sequence quality in NGS data: depth of coverage (how many sequence reads are present at a given position), base quality (have the correct bases been called in sequence reads) and mapping quality (have the reads been mapped to the correct position in the genome)3.
False negative errors are often caused by insufficient depth of coverage4, and it is vital that regions with low coverage
are flagged and reviewed, not least because they may require additional interrogation5. Coverage evaluation is also useful for
comparing different NGS library generation strategies, to identify regions with suboptimal performance6,7 and for probe design
optimisation8.
Poor base and poor mapping quality can cause false negative and false positive errors. Systematic base calling errors often occur in regions with high or low GC content or in homopolymer stretches9, while mapping errors often occur in regions of high
homology (e.g. pseudogenes) that result in ambiguously mapped reads10. As a starting point for evaluating base and mapping
quality, base callers and read mappers provide Phred quality scores that quantify base and mapping quality. These scores give the probability that a particular base has been identified incorrectly (base quality score, BQ11) or a read has aligned to
the wrong genomic position (mapping quality score, MQ)12.
Several tools and packages for analysing depth of coverage, base and mapping quality exist, for example GATK DepthOf Coverage and DiagnoseTargets13, QualiMap14, FastQC15, samtools
depth16 and pysamstats17. These tools have different strengths,
weaknesses and trade-offs, particularly in relation to flexibility and usability. Most available tools were developed for the research environment rather than the medical setting and have not focused on the needs and requirements of genetic testing in patients.
Here we present CoverView, a quality evaluation tool for NGS data that was designed to be user-friendly, fast, flexible and easy to integrate into NGS analysis pipelines. CoverView was developed to provide the quality assurance and quality control information required by clinical NGS testing laboratories, though we believe it is equally useful for research use. We recently proposed the Quality Sequencing Minimum (QSM) to deliver comprehensive, consistent, transparent NGS quality assurance information about depth of coverage, base and mapping quality, and we use CoverView to evaluate fulfilment of a QSM in our laboratory8. We also use CoverView as the quality control tool
for all our research and clinical NGS analyses and it is integrated into our exome analysis tool, OpEx (Optimised Exome)18.
Methods
Implementation
CoverView is implemented as an easy-to-use tool that can process the read count, BQ and MQ of mapped sequencing reads. It reports a series of informative quality control (QC) metrics with increasing levels of detail from a chromosome-level summary to per-base profiles. It also flags regions that do not pass user-defined quality requirements. The tool is implemented in Python v.2.7.13 and Cython v.0.25.2, with its graphical user interface (GUI) developed in Flask v. 0.12.1, HTML5 v.5.1 and JQuery v.3.1.1.
CoverView requires a BAM file (containing the mapped reads) as its input with the corresponding .BAI file16. A BED file is
also required with each record in the BED file defining the user-specified genomic region of interest (e.g. an exon of a gene) for which depth of coverage and sequence quality metrics will be reported. The BAM file may optionally contain reads marked as duplicates as CoverView can generate metrics with duplicate reads either included or excluded.
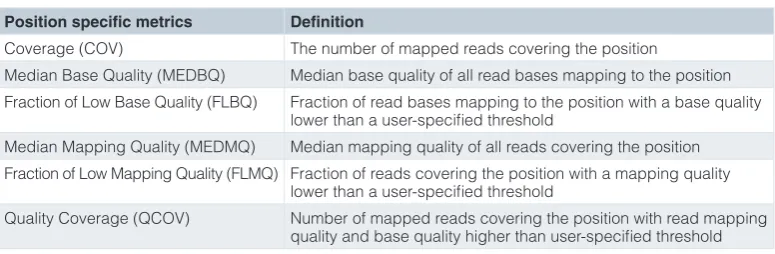
CoverView generates four output (.txt) files that provide dif-ferent information about the quality of the input BAM dataset (for CoverView input files see Data and software availability section)19. At the most detailed level, per-base profiles of
position specific metrics are reported for each region (Table 1). This base-level resolution is important because regions may only partially fail quality metrics, for example one part of an exon may have high quality depth of coverage whilst another part is poorly covered.
Table 1. Position specific metrics reported as per-base profiles in the specified genomic regions.
Position specific metrics Definition
Coverage (COV) The number of mapped reads covering the position
Median Base Quality (MEDBQ) Median base quality of all read bases mapping to the position Fraction of Low Base Quality (FLBQ) Fraction of read bases mapping to the position with a base quality
lower than a user-specified threshold
Median Mapping Quality (MEDMQ) Median mapping quality of all reads covering the position Fraction of Low Mapping Quality (FLMQ) Fraction of reads covering the position with a mapping quality
lower than a user-specified threshold
The coverage profile (COV) provides information on how the depth of coverage changes across the region, whilst the FLBQ and FLMQ metrics describe the fraction of coverage of low base or mapping quality scores at each position, respectively (Table 1). This is important because at positions with high FLBQ or FLMQ values it may not be possible to call variants with confidence even if the COV threshold is met. In addition, mapping and base quality scores are summarised by their median in the per-base MEDBQ and MEDMQ profiles. Finally, the QCOV profile integrates coverage, base and mapping quality information for each base by counting the number of covering reads that satisfy the user-defined quality requirements.
As systematic base calling errors can be strand-specific20,
QC metrics for forward and reverse reads separately can be of interest. CoverView can, optionally, output the described profiles calculated for forward (+) and reverse (-) reads only, facilitating detection of strand-specific biases in coverage or base and mapping quality.
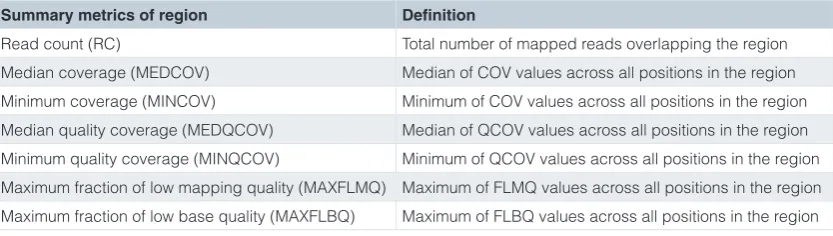
Summary statistics derived from the per-base profiles are reported for each user-specified region to describe the overall quality of the region (Table 2)19. MEDCOV and MEDQCOV
summa-rise the coverage profiles by their median across positions and MINCOV and MINQCOV provide information about the least covered position. Finally, the MAXFLMQ and MAXFBLQ metrics describe the lowest sequence quality positions in the region. CoverView can also output region-level metrics calculated for forward and reverse reads separately.
Users can define the minimal requirements to ‘pass’ the quality test and if this is not met the region of interest is ‘flagged’. Defin-ing these minimum requirements for depth of coverage, base and mapping quality are the basis of the QSM that is described in detail in the accompanying paper8. In CoverView a
mini-mum or maximini-mum value can be specified for any of the metrics in Table 2. For example, users may set a lower threshold to MINCOV and an upper threshold to MAXFLBQ: i.e. a region will be tagged with “FLAG” if coverage is below the defined value or FLBQ exceeds the maximum value at any position within the region, otherwise the region will be tagged as “PASS”. A separate
column in the output file indicates the pass/flag status of each region.
For correct variant annotation, interpretation and follow-up it is essential to know which gene transcripts a flagged region overlap with. A simple script (ensembl_db) is included for creating a transcript database using any Ensembl release. In a separate output file, CoverView optionally reports the transcript coordinates (CSN coordinates21) of all genomic intervals that are
covered by less than 15 high quality reads (QCOV<15), which are referred to as “poor quality intervals”19. Users may wish to
review positive or negative calls within such regions, to ensure confidence in the calls.
CoverView also provides a chromosome-level summary19. This
is important because the input BAM file may contain unmapped reads or reads that are mapped outside the targeted regions. In order to quantify the fraction of sequencing data that are not useful for variant calling within regions in the BED file, Cover-View creates a chromosome-level summary that reports the total read counts (RC) and the read counts of on-target (RCIN) and off-target regions (RCOUT) for each chromosome. In addition, the outputted table includes the mapped, unmapped and total read counts calculated for the whole genome.
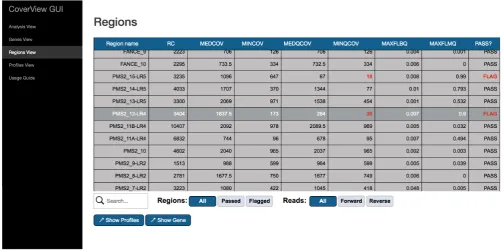
Finally, CoverView provides a GUI with multiple views (‘Anal-ysis View’, ‘Genes View’, ‘Regions View’, ‘Profiles View’), that allow users to intuitively explore the results. The Analysis View shows metadata of the analysis such as the names of input files and key configuration options. The Genes View offers a clickable bar plot displaying per-chromosome read counts (both on-target and off-target) and a filterable table providing infor-mation on the number of flagged regions for each gene on the selected chromosome (Figure 1). The Regions View displays a scrollable, searchable and filterable table of region-specific metrics values (Table 2) with flagged regions and the metric(s) underlying the flag highlighted (Figure 2). The Profiles View provides an interactive table and graph of per-base quality profiles for a selected region aligned with the corresponding reference genome sequence. Users can change the metrics displayed, zoom in, or navigate along the sequence with
Table 2. Summary metrics for the specified genomic regions.
Summary metrics of region Definition
Figure 1. CoverView GUI Genes View for TSCP analysis in GIAB sample. CoverView GUI screenshot of the Genes View for TruSight Cancer Panel (TSCP) data generated for the Genome in a Bottle (GIAB) sample shows a bar plot of per-chromosome read counts and the list of flagged regions. Nine regions in eight genes were flagged for falling below MINQCOV ≥50 in the GIAB sample.
quality minimum thresholds overlaid as dashed horizontal lines (Figure 3, Figure 4). The GUI is a Flask application that runs in the web browser on port 5000.
Operation
CoverView can be installed by running a simple Bash script. Installation requires Python v.2.7.9 or later (Python2 series), GCC v.4.2.1, GNU make v.3.81 and virtualenv v.15.1.022.
Note that Python v.2.7.9 and later include pip by default. Additional dependencies (e.g. the Python module pysam23) are
automatically downloaded and set up in an isolated Python virtual environment by the installation script.
Once installed, the tool can be customised with a simple INI configuration file and run from Linux/Unix command line (see Documentation for details). CoverView can be easily integrated into NGS analysis pipelines, as shown for the OpEx (Optimised Exome)18 pipeline. The CoverView documentation is hosted
on GitHub Pages at https://rahmanteamdevelopment.github.io/ CoverView/
CoverView v.1.4.3 documentation is also included in
Supplementary File 1.
Use case
We use the TruSight Cancer Panel (TSCP) for testing cancer predisposition genes in both research and clinical settings24–26.
Here we generated TSCP data on the National Institute of Standards and Technology (NIST) Reference Material (RM) 8398, for which there are experimentally validated genotyped sites provided by the NIST-led Genome in a Bottle (GIAB) Consortium27. We mapped paired-end Illumina sequencing
reads to the human reference genome (GRCh37) using Stampy v.1.0.2028 with BWA v.0.7.5a29 for pre-mapping. Duplicate reads
were marked with Picard v.1.9030. The resulting BAM file was
analysed with CoverView v.1.4.3 with a BED file specifying the TSCP targeted regions. Duplicate reads were included in the analysis. In this use case we set the minimal requirement for a region to ‘PASS’ as MINQCOV ≥50: i.e. all base positions in a targeted region were required to be covered by at least 50 reads of good quality (MQ ≥ 20 and BQ ≥10). The CoverView analysis was completed in 13 seconds (for CoverView Output files see Data and software availability section)19.
Nine of the 1471 targeted regions, affecting eight genes, were flagged as not fulfilling the MINQCOV ≥50 requirement (Figure 1)19. Here we focus on PMS2 exon 12 as an example of
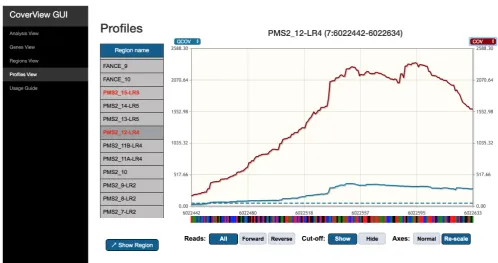
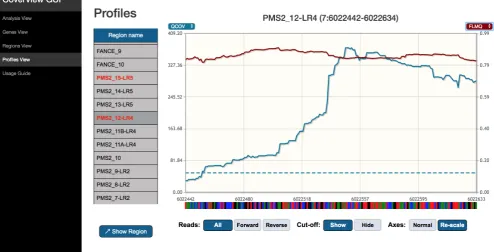
Figure 4. CoverView GUI Profiles View showing PMS2 exon 12 QCOV and FLMQ data in GIAB sample. CoverView GUI screenshot of Profiles View for PMS2 exon 12 data in the GIAB sample showing the quality coverage QCOV (blue), fraction of read bases with low mapping quality FMLQ (red) and the minimum QCOV threshold as dashed horizontal lines, across the region. This shows that the majority of reads mapping to this region have low mapping quality.
how the CoverView GUI can help to investigate the underlying reasons of poor quality.
The Regions View provides region-level metrics values for PMS2 exon 12 (Figure 2). The table shows that 3404 reads were mapped to this region. Although the least covered base has 173 reads (MINCOV=173), one part of the region was covered with only 30 reads of good quality (MINQCOV=30). The MINQCOV col-umn is therefore highlighted in red, indicating that its value is below the pre-set quality requirement. The table also suggests that the large difference between MINCOV and MINQCOV is due to poor mapping quality because the fraction of low mapping quality reads in the region is very high (MAXFLMQ=0.9; at a given position 90% of reads did not fulfill MQ ≥ 20). This is further supported by the Profiles View which shows the COV and QCOV metrics together (Figure 3). These two depth of coverage profiles along the entire exon are substantially different, and the FLMQ profile shows that the mapping quality is consist-ently poor (FLMQ>0.8) along the whole exon (Figure 4). This explains the striking difference between the COV and QCOV profiles since low quality reads are not counted as part of quality depth of coverage. PMS2 has a nearby pseudogene with strong homology to exons 9, 11–15 that causes ambiguous mapping and it is not possible to robustly analyse exon 12 by TSCP data alone8. However, the CoverView outputs show that every
base in 1462/1471 (99%) TSCP regions in the GIAB sample pass the MINQCOV ≥50 quality threshold19.
Conclusion
Next generation sequencing data are error-prone, subject to random errors affecting individual samples and systematic errors, due to sequence contexts and biases of sequencing platforms, affecting many samples. Stringent, comprehen-sive quality management is therefore essential when using NGS for clinical applications. CoverView is a freely avail-able NGS quality evaluation tool that provides quality metrics at the highest possible resolution by outputting per-base profiles, together with informative summary metrics that highlight which areas require further review. The CoverView outputs can be integrated into NGS pipelines so that regions that pass user- defined thresholds can automatically proceed and regions flagged as falling below user-defined thresholds can be further evaluated. The CoverView GUI provides a simple, visual interface with which to explore CoverView outputs and to investigate flagged regions.
We developed CoverView to be easy to install and use and we believe it can be quickly integrated into any NGS pipelines. CoverView is now the quality evaluation tool we use for all our clinical and research NGS analyses.
Data and software availability
Data are available under the terms of the Creative Commons Zero “No rights reserved” data waiver (CC0 1.0 Public domain dedication).
CoverView is available at: github.com/RahmanTeamDevelopment/ CoverView/releases and www.icr.ac.uk/CoverView
CoverView documentation is available at: https:// rahmanteamdevelopment.github.io/CoverView/
Latest source code: https://github.com/RahmanTeamDevelopment/ CoverView
Archived source code as at time of publication: http://doi. org/10.5281/zenodo.120610031
Software license: MIT
Supplementary material
Supplementary File 1. CoverView v.1.4.3 documentation.
Click here to access the data.
Competing interests
No competing interests were disclosed.
Grant information
The work was supported by the Wellcome Trust [200990].
The funders had no role in study design, data collection and analysis, decision to publish, or preparation of the manuscript.
Acknowledgements
We acknowledge support from the NIHR RM/ICR Specialist Biomedical Research Centre for Cancer. This work was undertaken as part of the Transforming Genetic Medicine Initiative (www.thetgmi.org).
References
1. Goodwin S, McPherson JD, McCombie WR: Coming of age: ten years of next-generation sequencing technologies. Nat Rev Genet. 2016; 17(6): 333–51. PubMed Abstract | Publisher Full Text
2. Endrullat C, Glökler J, Franke P, et al.: Standardization and quality management in next-generation sequencing. Appl Transl Genom. 2016; 10: 2–9.
PubMed Abstract | Publisher Full Text | Free Full Text
3. Gargis AS, Kalman L, Berry MW, et al.: Assuring the quality of next-generation sequencing in clinical laboratory practice. Nat Biotechnol. 2012; 30(11): 1033–6.
PubMed Abstract | Publisher Full Text | Free Full Text
4. Huang XF, Wu J, Lv JN, et al.: Identification of false-negative mutations missed by next-generation sequencing in retinitis pigmentosa patients: a complementary approach to clinical genetic diagnostic testing. Genet Med. 2015; 17(4): 307–11.
PubMed Abstract | Publisher Full Text
5. Thomas M, Sukhai MA, Zhang T, et al.: Integration of Technical, Bioinformatic, and Variant Assessment Approaches in the Validation of a Targeted Next-Generation Sequencing Panel for Myeloid Malignancies. Arch Pathol Lab Med. 2017; 141(6): 759–775.
PubMed Abstract | Publisher Full Text
6. Garcia-Garcia G, Baux D, Faugère V, et al.: Assessment of the latest NGS enrichment capture methods in clinical context. Sci Rep. 2016; 6: 20948. PubMed Abstract | Publisher Full Text | Free Full Text
7. Yan B, Hu Y, Ng C, et al.: Coverage analysis in a targeted amplicon-based next-generation sequencing panel for myeloid neoplasms. J Clin Pathol. 2016; 69(9): 801–4.
PubMed Abstract | Publisher Full Text
8. Mahamdallie S, et al.: The Quality Sequencing Minimum (QSM): providing comprehensive, consistent, transparent NGS data quality assurance. Wellcome Open Research.
Publisher Full Text
9. Ross MG, Russ C, Costello M, et al.: Characterizing and measuring bias in sequence data. Genome Biol. 2013; 14(5): R51.
PubMed Abstract | Publisher Full Text | Free Full Text
10. Mandelker D, Schmidt RJ, Ankala A, et al.: Navigating highly homologous genes in a molecular diagnostic setting: a resource for clinical next-generation sequencing. Genet Med. 2016; 18(12): 1282–1289.
PubMed Abstract | Publisher Full Text
11. Ewing B, Green P: Base-calling of automated sequencer traces using phred. II.
Error probabilities. Genome Res. 1998; 8(3): 186–94. PubMed Abstract | Publisher Full Text
12. Li H, Ruan J, Durbin R: Mapping short DNA sequencing reads and calling variants using mapping quality scores. Genome Res. 2008; 18(11): 1851–8. PubMed Abstract | Publisher Full Text | Free Full Text
13. McKenna A, Hanna M, Banks E, et al.: The Genome Analysis Toolkit: a MapReduce framework for analyzing next-generation DNA sequencing data.
Genome Res. 2010; 20(9): 1297–303.
PubMed Abstract | Publisher Full Text | Free Full Text
14. Okonechnikov K, Conesa A, Garcia-Alcalde F: Qualimap 2: advanced multi-sample quality control for high-throughput sequencing data. Bioinformatics. 2016; 32(2): 292–4.
PubMed Abstract | Publisher Full Text | Free Full Text
15. Andrews S: FastQC: a quality control tool for high throughput sequence data. 2010.
Reference Source
16. Li H, Handsaker B, Wysoker A, et al.: The Sequence Alignment/Map format and SAMtools. Bioinformatics. 2009; 25(16): 2078–9.
PubMed Abstract | Publisher Full Text | Free Full Text
17. Miles A: pysamstats: a fast Python and command-line utility for extracting simple statistics against genome positions based on sequence alignments from a SAM or BAM file. 2013.
Reference Source
18. Ruark E, Münz M, Clarke M, et al.: OpEx - a validated, automated pipeline optimised for clinical exome sequence analysis. Sci Rep. 2016; 6: 31029. PubMed Abstract | Publisher Full Text | Free Full Text
19. Rahman N: CoverView (Supporting material). 2018. Publisher Full Text
20. Quail MA, Smith M, Coupland P, et al.: A tale of three next generation sequencing platforms: comparison of Ion Torrent, Pacific Biosciences and Illumina MiSeq sequencers. BMC Genomics. 2012; 13: 341.
PubMed Abstract | Publisher Full Text | Free Full Text
21. Munz M, Ruark E, Renwick A, et al.: CSN and CAVA: variant annotation tools for rapid, robust next-generation sequencing analysis in the clinical setting.
Genome Med. 2015; 7(1): 76.
PubMed Abstract | Publisher Full Text | Free Full Text 22. virtualenv: Virtual Python Environment builder.
23. Heger A: pysam: htslib interface for python. Reference Source
24. Illumina: TruSight Cancer: targeting genes previously linked to a predisposition towards cancer.
Reference Source
25. Fowler A, Mahamdallie S, Ruark E, et al.: Accurate clinical detection of exon copy number variants in a targeted NGS panel using DECoN. Wellcome Open Res. 2016; 1: 20.
PubMed Abstract | Publisher Full Text | Free Full Text
26. George A, Riddell D, Seal S, et al.: Implementing rapid, robust, cost-effective, patient-centred, routine genetic testing in ovarian cancer patients. Sci Rep. 2016; 6: 29506.
PubMed Abstract | Publisher Full Text | Free Full Text
27. Zook JM, Catoe D, McDaniel J, et al.: Extensive sequencing of seven human
genomes to characterize benchmark reference materials. Sci Data. 2016; 3: 160025.
PubMed Abstract | Publisher Full Text | Free Full Text
28. Lunter G, Goodson M: Stampy: a statistical algorithm for sensitive and fast mapping of Illumina sequence reads. Genome Res. 2011; 21(6): 936–9. PubMed Abstract | Publisher Full Text | Free Full Text
29. Li H, Durbin R: Fast and accurate short read alignment with Burrows-Wheeler transform. Bioinformatics. 2009; 25(14): 1754–60.
PubMed Abstract | Publisher Full Text | Free Full Text 30. Picard.
Reference Source
31. Münz M, Rimmer A: RahmanTeamDevelopment/CoverView: v1.4.3 (Version v1.4.3). Zenodo. 2018.
1.
2.
3.
4.
Open Peer Review
Current Referee Status:
Version 1
22 May 2018 Referee Report
https://doi.org/10.21956/wellcomeopenres.15567.r32998
Somak Roy
Department of Pathology, Division of Molecular & Genomic Pathology, University of Pittsburgh,
Pittsburgh, PA, USA
The authors have described their software solution, CoverView, to analytically and visually profile Next
Generation Sequencing (NGS) data for use in a clinical environment. Specifically, the manuscript
describes quality control parameters derived from sequencing depth, base quality, and mapping quality
score.
The described software solution appears to have great utility as a pluggable tool in the clinical workflow of
QC review of NGS data. The graphical user interface (GUI) appears to be intuitive and user friendly for
use by laboratory personnel who may not have experience with command line and other programming
tools. This tool can potentially be a useful resource for validation of NGS assays where understanding the
coverage and sequencing quality profile across sequenced region is important.
I summarize my comments below that should help further improve the content of the manuscript.
The authors have described sequencing depth, base quality, and mapping quality scores as the
primary measurements for CoverView. However, the drafted manuscript reads such that these
three parameters are the only indices to be evaluated for quality. Since there are additional
parameters from sequenced reads that reflect quality of NGS data , the authors should list these
under discussion section of the manuscript for the readers to have a holistic view of NGS QC.
Scalability: the manuscript demonstrates the application performance (computational time, visual
rendering, and user interaction) based on using data from targeted panel. Parsing and analyzing
data from BAM files can be computationally expensive, especially as the sequenced region
increases (targeted panels with several hundred genes, exomes, etc). The authors reference to
integrating CoverView in their clinical exome sequencing pipeline (OpEx). May I request the
authors to provide benchmark for computational time, visual rendering, and user interaction
comparing OpEx and TSCP to demonstrate the scalability of the software solution. It will be
interesting to know how the rendered user interface adapts to large array of data points while
preserving user experience.
Input BAM file and multiple aligners: Can the authors discuss their experience with regards to the
input BAM file when generated by multiple sequence alignment algorithms? In the use case, the
authors describe using Stampy and BWA. I am assuming that each of the BAM files were
separately analyzed by CoverView. Did the authors face any challenges when using BAM files
from different alignment algorithms?
Quality Sequencing Minimum (QSM): The authors reference QSM as being used with CoverView
4. Quality Sequencing Minimum (QSM): The authors reference QSM as being used with CoverView
in their laboratory. It will be helpful if some description of QSM is included in the manuscript.
References
1. Roy S, Coldren C, Karunamurthy A, Kip NS, Klee EW, Lincoln SE, Leon A, Pullambhatla M,
Temple-Smolkin RL, Voelkerding KV, Wang C, Carter AB: Standards and Guidelines for Validating
Next-Generation Sequencing Bioinformatics Pipelines: A Joint Recommendation of the Association for
Molecular Pathology and the College of American Pathologists.
J Mol Diagn
. 2018;
20
(1): 4-27
PubMed
|
Abstract Publisher Full Text
Is the rationale for developing the new software tool clearly explained?
Yes
Is the description of the software tool technically sound?
Yes
Are sufficient details of the code, methods and analysis (if applicable) provided to allow
replication of the software development and its use by others?
Yes
Is sufficient information provided to allow interpretation of the expected output datasets and
any results generated using the tool?
Yes
Are the conclusions about the tool and its performance adequately supported by the findings
presented in the article?
Yes
No competing interests were disclosed.
Competing Interests:
Referee Expertise:
Molecular diagnostics, cancer genomics, bioinformatics, clinical informatics.
I have read this submission. I believe that I have an appropriate level of expertise to confirm that
it is of an acceptable scientific standard.
20 April 2018 Referee Report