Investigation on Mg and Sc Doped Ceria
for Intermediate Temperature Solid Oxide Fuel Cell
1
P.Ravi Chandran,
2T.V.Arjunan,
3G.Gokila Krishnan and
4Santhi Tirumalaisamy
1Department of Mechanical Engineering, Karpagam Polytechnic College, Coimbatore, Tamilnadu
2Department of Mechanical Engineering, Coimbatore Institute of Engineering and Technology, Coimbatore, Tamilnadu 3
Department of Mechanical Engineering, Sri Eshwar College of Engineering, Coimbatore, Tamilnadu
4Department of Chemistry, Karpagam University, Coimbatore, Tamilnadu
Abstract-- Nanocrystalline form of pure ceria (CeO2) and metal
(Mg and Sc) doped ceria was obtained by co-precipitation technique. The metal loading was maintained at 10 mol % for both Mg and Sc dopants. The synthesized nanocrystalline form of powders was then subjected to different characterization techniques such as powder X-ray diffraction (XRD) for phase and structural identification. The composition and morphology was investigated using scanning electron microscopic analysis and energy dispersive X-ray spectrometry (EDS). The ionic conductivity due to the dopant effect was investigated using impedence spectroscopic analysis in the frequency range 50 Hz to 5 MHz. The impedance analysis reveals that the sample Ce0.9Mg0.1O2 was found to have higher ionic conductivity
compared to Ce0.9Sc0.1O2 in the temperature range of 400–600°C.
Nyquist plot shows the major contributions were due to the grain boundary resistance contributions which accounts for the higher ionic conductivity in case of the dopants. These dopant effect on the ceria was discussed in detail.
Index Term-- Co-Precipitation method; Doped ceria; X-ray Diffraction; Scanning Electron Microscopy; Energy-dispersive X-ray spectrometry; Impedance analysis. PACS code: 66.30.D
1. INTRODUCTION
Solid oxide fuel cell (SOFC) mainly focuses on yttria-stabilized zirconia (YSZ) ceramics due to rapid oxygen ion diffusion in nature even at higher temperature ranges of about 900oC. These ZrO2 based electrolyte requires high
operating temperatures of 900–1000◦C in order to maintain high oxygen ionic conductivity [1-3].
In order to reduce the operating temperature and to increase their conductivity at lower temperature range (600– 800◦C) compared with YSZ, some novel oxygen-ion conductors including CeO2-, Bi2O3- and LaGaO3-based oxides
have been extensively investigated [4-7]. Intensive researches were being carried out to reduce the operating temperature there by reducing the cost of material and cell fabrication by reducing the operating temperature of SOFC to 400-600°C.
Pure CeO2 has low thermal resistance and low textural stability, which is not high enough to meet the requirements of high temperature applications [9]. Hence pure ceria is generally not preferred.
Ceria (CeO2) doped with rare earth metals as
electrolyte materials showed higher ionic conductivity at relatively lower temperatures (≤800oC) to that of Yttria
to the increase in the surface area. The grain growth can be controlled and their conductivity can be increased relatively by doping the ceria with different metal ions and their structural stability can also be increased. [10].
There were reports on the metal dopants and rare earth dopant on the host lattice of ceria, in which ceria site is replaced with a wide range of rare-earth ion dopants (e.g.Y3+, La3+, Gd3+, Sm3+ and Yb3+) by which the ionic conductivity can be increased [11-16].
In the present work, pure CeO2, 10 mol% of Mg
doped ceria and 10 mol% of Sc doped ceria have been synthesized by precipitation method. A simple co-precipitation technique is employed in the present case due to their cost effective in the resultant product formation and uniform particle size distribution of the synthesized samples [17]. The conductivity of the nanocrystalline form of ceria is increased due to the increase in surface to volume ratio at nano regime [18-20]. The Ac impedance technique is a powerful tool to analyze the electrical properties of ceramic ionic conductors [21]. Reports have been published on the ionic conductivity of Mg doped Ceria [19] and Sc doped Zirconia [20]. So far, there are no report on the ionic conductivity of ceria doped with 10 mol % Mg and Sc. Hence, in the present study Ion dynamic analysis of 10 mol% Sc doped Ceria has been reported and compared with10 mol% Mg doped Ceria.
2. EXPERIMENTAL
2.1. Synthesis of nanocrystalline form of pure, Mg and Sc doped ceria
A co-precipitation method was used to prepare pure Ceria, Magnesium doped Ceria and Scandium doped Ceria. Required quantities of Cerium nitrate hexahydrate (Ce(NO3)3·6H2O) (99.99%,Himedia), Magnesium nitrate
hexahydrate (Mg(NO3)3·6H2O) (99%,Himedia) and Scandium
nitrate hexahydrate (Sc(NO3)3·6H2O) (99%,Himedia) were
used as starting materials. All the chemicals were of analytical grade and were used as purchased.
For pure ceria, Ce(NO3)3·6H2O was dissolved in 80%
until pH10, the mixed solution being stirred continuously until the reaction is completed in about 12 hours after which the precipitates were centrifuges and washed with water and ethanol multiple times. The synthesized powders were then dried and calcinated at 800oC for about 24 hours in air atmosphere to obtain nanocrystalline form of pure and doped ceria. These nanocrystaylline form of powders were then subjected to different characterization techniques to test its phase identification. The powders were then ground and was then cold pressed isostatically under 4000 kg/cm2 to form pellets with 0.1 cm thickness and 1.0 cm diameter which was further sintered in air at 1500°C for 2 hours. These pure and 10 % Mg and 10 % Sc doped ceria pellets were then used for electrical measurements.
2.2. Characterization techniques
The phase analysis of the pure, Mg and Sc doped ceria compositions of sintered samples were identified by X-ray diffraction (XRD) analysis by using Philips X-X-ray diffractometer PW 1830. The crystalline sizes of the powders were estimated by the line broadening analysis, using the reflection planes. The morphology and composition of the nanocrystalline for of the samples were subjected to Scanning electron microscopy (SEM) and Energy-dispersive X-ray spectrometry (EDS) using a JSM-6335F, JEOL microscope. The electrical properties of the samples were investigated by
ac impedance spectroscopy in the temperature range of 400-700°C and at the frequencies from 50Hz to 5MHz using an impedance analyzer HIOKI 3532.
3. RESULTS AND DISCUSSIONS 3.1. Powder XRD analysis
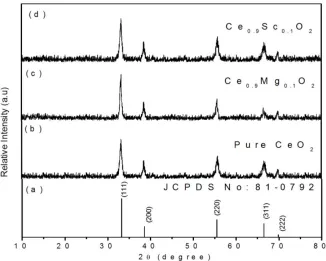
The crystallinity and phase analysis of the prepared nanocrystalline pure, Mg and Sc doped ceria samples were examined by powder XRD analysis. Powder XRD patterns of pure CeO2, Ce0.9Mg0.1O2 (10MDC) and Ce0.9Sc0.1O2 (10SDC)
are shown in Fig.1. The XRD pattern is in accordance with the data in the JCPDS card no.81-0792 of a cubic phase CeO2.
The particle size (D) is estimated using the Debye Scherrer’s formula:
D = 0.94λ / β2θ cos θ
where λ is the wavelength of the X-ray and β2θ is the full
width at half maximum of the corresponding peak of the XRD pattern. The average crystallite size of pure Ceria is about 17 nm and that of Ce0.9Sc0.1O2 and Ce0.9Mg0.1O2 was found to be
23 nm and 25 nm respectively. It is clear evident from the XRD pattern that only the peaks corresponds to the ceria alone and that the absence of any other secondary phases of the dopants do not reflect in the spectrum. Hence these single phase ceria, Mg and Sc doped ceria was used for further characterization techniques to test its electrical properties.
Table I
Unit cell parameters and particle size of pure and doped ceria
Pure Ceria (CeO2) Ce0.9Sc0.1O2(10SDC) Ce0.9Mg0.1O2 (10MDC)
Unit Cell parameters (Cubic A)
5.412 5.510 5.585
Particle size (nm) 17 23 25
From the XRD pattern, we could observe that the lattice parameter of the pure ceria was found to be 5.412 A and that the Sc doped ceria was found to be 5.510 A and that of Mg doped was around 5.585 A. This could well reflect in the peak shift of the XRD pattern. As the ionic radii of Ce4+ (0.967 Ao) is slightly lower than that of Mg and Sc, this causes a thermal expansion which in turn increases the lattice volume [22]. 3.2. SEM and EDS analyses
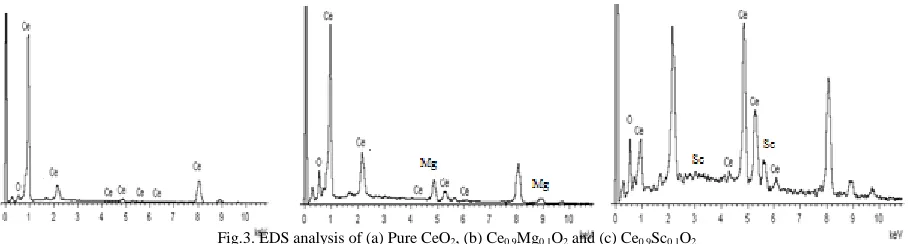
The surface morphology and chemical composition of pure CeO2, Ce0.9Mg0.1O2 and Ce0.9Sc0.1O2 which were
observed and analyzed by SEM and EDS are shown in Fig.2 and Fig.3. SEM micrographs clearly show the obtained powders is of nanosize particles with a uniform size distribution. From the observation, it can be seen; the surface morphology of pure CeO2 is nearly spherical in
shape and is dispersed well.
Fig. 2. SEM micrographs of (a) Pure CeO2, (b) Ce0.9Mg0.1O2 and (c) Ce0.9Sc0.1O2.
The substitution of Mg and Sc in ceria resulted in reduced particle size. These reduced particle size greatly influences the conductivity nature due to the reduced hopping distance of the ionic motion. Further, the reduction of particle
size with Mg and Sc doping resulted in decrease of grain boundary resistance which is discussed in impedance analysis. EDS analysis shows the presence of Mg and Sc elements in the doped ceria samples.
Fig.3. EDS analysis of (a) Pure CeO2, (b) Ce0.9Mg0.1O2 and (c) Ce0.9Sc0.1O2.
3.3. Impedance analysis
A.C. impedance analysis is an important technique to investigate the electrical properties of solid electrolytes. The
materials, the separate contributions of the bulk crystal lattice (grain interior) and grain boundaries.
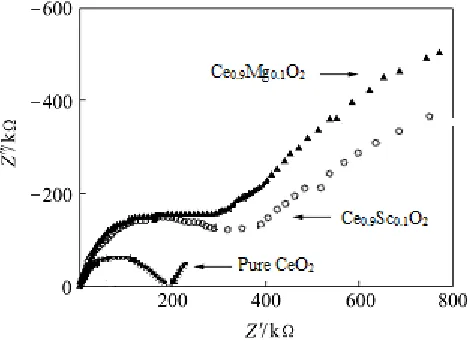
The real (z’) and imaginary components (z”) of the impedance (z) were determined by measuring the amplitude and phase angle (θ) of the current. By plotting -Z” versus Z’, one obtains Nyquist plot, where each arc in the plot represents a distinct process whose time constant is sufficiently separated from the others over the range of measurement frequencies. The left most x-intercept of the arc is the resistance of the sample, from which conductivity values can be determined. The typical plots obtained for Pure CeO2, Ce0.9Mg0.1O2 and
Ce0.9Sc0.1O2 measured at a temperature of 500oC are shown in
Fig. 4. Impedance spectroscopy measurements enable one to determine the bulk (b) and grain boundary (gb) conductivities. The samples show semicircular arcs in the plot between real and imaginary impedance. The first arc at higher frequency (left) is attributed to the contribution from grain interior and the second one (right) to the grain boundary. The impedances were found out from the individual semicircles and the grain interior and the total conductivity (grain interior
and grain boundary) were evaluated.
Fig. 4. Impedance spectra in Nyquist- plots for all the samples at 500°C
The impedance data shows depressed semicircles, due to the bulk and grain boundary effects. The circular fitting of the complex impedance plot has been done by using the programme EQ developed by Boukamp which yields the value of ‘n’ used to find the depression angle from the formula (1-n) (π/2). The associated capacitance value for the semicircles has been calculated using the formula ωRC = 1. The capacitance value is found to be in the order of pF, and therefore they have been attributed to a conduction process through the bulk and the grain boundary of the material.
The electrical conductivity () of the prepared sample pellets were determined from the usual Arrhenius expression:
T = o exp [− E/kT].
where, o is the pre-exponential factor, E is the apparent
activation energy for conduction, k is the Boltzmann constant and T is the absolute temperature. The respective values of the conductivities of pure CeO2, Ce0.9Mg0.1O2 and Ce0.9Sc0.1O2
samples at 500ºC are given in
Table II. The total electrical conductivity is calculated as a sum of bulk and grain boundary conductivities.
Table II
Electrical conductivity () of pure ceria and doped ceria samples at 500 ºC
Composition
[S/cm]
Ea [eV]
Bulk
Grain boundary
Bulk
Grain boundary
CeO
26.92×10
-51.21×10
-60.90
1.01
Ce
0.9Mg
0.1O
26.23×10
-35.24×10
-30.86
0.97
Ce
0.9Sc
0.1O
25.71×10
-34.32×10
-30.89
1.00
Fig.5. Arrhenius plots of the total electrical conductivity of samples at 500oC. Fig.5 shows Arrhenius plots of the total electrical
conductivity, T, of samples sintered at 500 ◦C. The above equation gives a straight line between lnσ and T, the slope of which is [-Ea/K]. A typical plot between logarithmic conductivity and temperature of Pure CeO2, Ce0.9Mg0.1O2 and
Ce0.9Sc0.1O2 are shown in the figure. The conductivities from
the grain interior and the grain boundaries were calculated based on the impedances measured. For pure ceria, the total electrical conductivity is lower than that of sample Ce0.9Mg0.1O2 by near one order of magnitude. The higher total
electrical conductivity of sample Ce0.9Mg0.1O2 compared to
pure ceria and Ce0.9Sc0.1O2 is probably due to smaller particle
size of Ce0.9Mg0.1O2 sample. The smaller grain size reduces
the hopping distance of ionic motion and thereby has a great influence on conductivity properties. The reduced particle size of Mg or Sc doped ceria resulted in decrease of bulk and grain boundary resistance resulting in higher ionic conductivity compared to pure ceria. The bulk resistance of Mg doped ceria has been found to be low compared to the Sc doped ceria. The bulk resistance values of the samples indicate the higher ionic conductivity for the sample Ce0.9Mg0.1O2 compared to
Ce0.9Sc0.1O2.
4. CONCLUSION
Pure Ceria, 10 mol% Mg doped Ceria (Ce0.9Mg0.1O2)
and 10 mol% Sc doped Ceria (Ce0.9Sc0.1O2) had been prepared
by co-precipitation method. Single phase cubic natured ceria was obtained for both pure and doped ceria. Particle size calculation from the XRD pattern reveals that the synthesized powders were of nanocrystalline in nature and that for pure it was around 17nm and for Sc and Mg doped ceria it was found to be 23 and 25 nm respectively. SEM micrograph of the pure and doped ceria confirms the nanoscrystalline nature and that the synthesized powders possess uniformly distributed spherical powders. EDS analysis confirms the presence of Mg and Sc elements in the doped ceria samples. The impedance analysis reveals that the samples Ce Mg O and Ce Sc O
Ce0.9Sc0.1O2 in the temperature range of 400–600°C. The ionic
conductivity of pure CeO2 improved significantly with the
addition of Mg or Sc in the ratio 9:1 in the intermediate temperatures (400–600°C). Dopants are used to decrease the activation energy and consequently to improve the ionic conductivity.
REFERENCES
[1] Minh NQ, Takahashi T (1995) ‘Science and technology of ceramic fuel cells’. Elsevier, Amsterdam.
[2] Janina Molenda ‘High-temperature solid-oxide fuel cells New trends in materials research’ Materials Science-Poland, Vol. 24, No. 1, 2006
[3] Mridula Biswas, Prasant Kumar Ojha, E. Moses Jayasingh and C. Durga Prasad ‘Synthesis of Nanocrystalline Yttria Stabilized Zirconia for SOFC’ Nanomater. nanotechnol., Vol.1(2) (2011) 55-58.
[4] Jennifer L.M. Rupp , Ludwig J. Gauckler ‘Microstructures and electrical conductivity of nanocrystalline ceria-based thin films’ Solid State Ionics (2006)
[5] F. Krok, I. Abrahams, W.Wrobel, A. Kozanecka-Szmigiel, J. R. Dygas ‘Oxide-ion conductors for fuel cells’ Materials Science-Poland, Vol. 24, No. 1, 2006
[6] Tatsumi Ishihara,Junichi Tabuchi, Shinji Ishikawa, Jingwang Yan, Makiko Enoki, Hiroshige Matsumoto ‘Recent progress in LaGaO3 based solid electrolyte for intermediate temperature SOFCs’ Solid State Ionics, Volume 177, Issues 19–25, 15 October 2006, Pages 1949–1953
[7] Weimin Guoa, Jiang Liua, Chao Jina ‘Anode-supported LaGaO3-based electrolyte SOFCs with Y2O3-doped Bi2O3 and La-doped CeO2 buffer layers’ Journal of Alloys and Compounds, Volume 504, Issue 2, 20 August 2010, Pages L21–L24.
[8] Sossina M. Haile ‘Fuel cell materials and components’ Acta Materialia 51 (2003) 5981–6000
[9] Aniruddha Panda ‘ Preparation and Characterization of Mesoporous CeO2-ZrO2 Nanopowders using Dodecylamine and sodium Dodecyl sulfate as Surfactant’ Dissertation Submitted for the degree of Master of Science in Chemistry, National Institute of Technology, Rourkela
[12] Zhang Hong, Wang Jian , Wang Shen-cun, LI Zhi-cheng ‘Conductivity of cerium oxides doped by trivalent cations’Trans.Nonferrous Met.Soc.China 17(2007) 565-569 [13] Fei Ye Toshiyuki Mori, Ding Rong Ou, Motoi Takahashi, Jin Zou,
and John Drennan ‘Ionic Conductivities and Microstructures of Ytterbium-Doped Ceria’ Journal of The Electrochemical Society, 154 (2) B180-B185 (2007)
[14] Mamoune EL Himri, Abdelouahad EL Himri, Pedro Nunez ‘Synthesis and impedance analysis of gadolinium-doped cerium electrolyte’ J. Mater. Environ.Sci.3 (4) (2012) 726-731.
[15] Mingfei Liu, Dong Ding, Yaohui Bai, Ting He, and Meilin Liu ‘An Efficient SOFC Based on Samaria-Doped Ceria (SDC) Electrolyte’ Journal of The Electrochemical Society, 159 (6) B661-B665 (2012) B661
[16] E.C.C. Souza, H.F. Brito, E.N.S. Muccillo ‘Optical and electrical characterization of samaria-doped ceria’ Journal of Alloys and Compounds 491 (2010) 460–464.
[17] M.J. Godinho , R.F. Gonçalves , L.P. S Santos , J.A. Varela , E. Longo , E.R. Leite ‘Room temperature co-precipitation of nanocrystalline CeO2 and Ce0.8Gd0.2O1.9−δ powder’ Materials Letters 61 (2007) 1904–1907
[18] Toshiyuki Mori, John Drennan ‘Influence of microstructure on oxide ionic conductivity in doped CeO2 electrolytes’ Journal of Electroceramics, December 2006, Volume 17, Issue 2-4, pp 749-757
[19] Soofin Cheng, Feng-Yun Wang ‘Solid electrolyte based on magnesia-doped ceria’ US 20060127726 A1, Dec 14, 2004 [20] G.C.C. Costa, R. Muccillo ‘Synthesis of scandia-stabilized
zirconia nanoparticles by the polyacrylamide technique’ Solid State Ionics 179 (2008) 1219–1222
[21] J. ROSS Macdonald ‘Impedance Spectroscopy’ Annals of Biomedical Engineering, Vol. 20, pp. 289-305, 1992