Lincoln
University
Digital
Thesis
Copyright
Statement
The
digital
copy
of
this
thesis
is
protected
by
the
Copyright
Act
1994
(New
Zealand).
This
thesis
may
be
consulted
by
you,
provided
you
comply
with
the
provisions
of
the
Act
and
the
following
conditions
of
use:
you
will
use
the
copy
only
for
the
purposes
of
research
or
private
study
you
will
recognise
the
author's
right
to
be
identified
as
the
author
of
the
thesis
and
due
acknowledgement
will
be
made
to
the
author
where
appropriate
you
will
obtain
the
author's
permission
before
publishing
any
material
from
the
Determinants of Foreign-Owned Banks’ Efficiency in New Zealand:
A Stochastic Frontier Approach
A thesis
submitted in partial fulfilment
of the requirements for the Degree of
Doctor of Philosophy in Finance
at
Lincoln University
by
Ying Fang Lu
Lincoln University
ii
Abstract of a thesis submitted in partial fulfilment of the
requirements for the Degree of Doctor of Philosophy in Finance
Abstract
Determinants of Foreign-Owned Banks Efficiency in New Zealand:
A Stochastic Frontier Approach
by
Ying Fang Lu
The banking sector in New Zealand is characterised by the dominance of foreign-owned banks, and in particular from Australia. The objective of this study is to examine the efficiency performance of foreign-owned banks relative to domestically owned banks, with major focus on the determinants on the differences of foreign banks’ efficiency. The parametric stochastic frontier approach (SFA) is employed to extend the existing bank efficiency studies that used the non-parametric approach--Data Envelopment Analysis (DEA). Ten major banks which have continuously operated over the period 2002 to 2011 were selected and both industry- and bank-specific characteristics are tested using quarterly data for 40 quarters with the consideration of macroeconomic conditions. The one-step SFA approach of model is used in order to obtain the cost and profit efficiency scores and the inefficiency effects simultaneously to avoid any bias on the results.
The empirical results suggest that the presence of foreign banks in New Zealand has contributed to the efficiency of New Zealand banking system as a whole. The results also support the limited global advantage hypothesis (Berger, DeYoung, Genay, & Udell, 2000) that foreign banks from specific nations (Australia in this study) have operated efficiently due to having less liabilities of foreignness in the host nation. Other distinguishing determinants factors on the differences in cost and profit efficiency between foreign and domestic banks are bank size, the level of equity, asset quality, as well as the market concentration and interest rate and inflation environment in New Zealand.
iii
Acknowledgements
Writing a PhD thesis in my 40s while working full time throughout majority of the time was both a challenge and an achievement. With no doubt, there are a number of people who have played an important part in helping me to complete the thesis journey.
First and foremost I wish to express my heartfelt gratitude to Professor Christopher Gan for his unwavering support, constructive criticism, patience and encouragement. Similarly, I gratefully acknowledge the continued support of my associate supervisor Dr. Baiding Hu and in particular for his guidance and advice on methodology.
I also give special thanks to Dr. David Tripe at Massey University for sharing his original data materials and I have also greatly benefited from the discussions with and suggestions from him.
Thanks are also due to the experienced and encouraging team from the Library Learning and Teaching at Lincoln University for their advice and assistance at various stages of my thesis research. I am also grateful to receive the assistance of the industrious and charming Jane Clark in editing the full thesis.
Outside the university a special word of thanks to my former manager Martin Leonard at ASB Bank. His support motivated me to complete the journey even after I resigned from the bank.
I am blessed with my family in China and I wish to express my love and gratitude to my mother and late father for instilling in me the value of tertiary education. Thanks also go to my friends and the team from my own business for their encouragement and unfailing support.
Finally I acknowledge the unconditional love and support from my family in New Zealand-Mr. David Brown and my son Yixuan Zhang who is already in University following his own dream. Without their support my dream would not have been realised.
vii
List of Tables
Table 2.1: Registered Banks: 2002-2011 ... 23
Table 4.1 Sample Banks: 2002-2011 ... 84
Table 4.2 Data Descriptive of Bank-level Variables ... 87
Table 4.3 Description of Variables ... 90
Table 4.4 Variables in Inefficiency Equations by Bank Groups and Models ... 96
Table 5.1 Descriptive Statistics of Industry-and Bank-specific Variables... 101
Table 5.2 Descriptive Statistics of Macroeconomic Variables (2002-2011) ... 102
Table 5.3 Operating Efficiency Ratios ... 106
Table 5.4: Mean CE, APE by Groups and Models ... 108
Table 5.5 Mean CE by Banks, Groups and models ... 112
Table 5.6 Mean APE by Banks, Groups and Models ... 115
Table 5.7 Quarterly Mean CE in Model (2): Major Banks (2002-2011) ... 120
Table 5.8 Quarterly Mean APE in Model (2): Major Banks (2002-2011) ... 123
Table 6.1 Coefficients of Industry-specific Variables in Inefficiency Equations ... 127
Table 6.2 Coefficients of Bank-specific Variables in Inefficiency Equations ... 135
viii
List of Figures
Figure 2.1 Registered Banks: Total Profit before Tax (2002-2011) ... 27
Figure 2.2 Registered Banks: Total Assets (2002-2011) ... 29
Figure 2.3 Registered Banks: Impaired Assets ratios (2002-2011) ... 30
Figure 2.4 Registered Banks: Total Interest-bearing Liabilities (2002-2011) ... 31
Figure 2.5 Registered Banks: Tier 1 Capital Ratios (2002-2011) ... 33
Figure 5.1 Comparison of Mean CE by Bank Groups in Model (2) (2002-2011) ... 110
Figure 5.2 Trends of Mean APE by Bank Groups (2002-2011) ... 111
Figure 5.3 Evolution of CE by Groups in Model (2) (2002-2011) ... 117
Figure 5.4 Comparison of APE by Groups in Model (2) (2002-2011) ... 122
Figure 6.1 Total Assets: Full sample Banks (quarterly 2002-2011) ... 136
Figure 6.2 Equity Ratios: Full Sample Banks (Quarterly 2002-2011) ... 139
Figure 6.3 Impaired Assets Ratios: Full Sample Banks (Quarterly 2002-2011) ... 141
Figure 6.4 GDP Growth (quarterly year to year): Q1:2002-Q4:2011 ... 143
Figure 6.5: 90-days Bank Bill Rates (Quarterly 2002-2011) ... 145
Figure 6.6: Inflation Rates: Quarterly 2002-2011 ... 146
Figure 6.7: New Zealand Dollars Exchange Rates-TWI (Index: 1979=100) ... 148
ix
ABBREVIATIONS
ASB ASB Bank Limited
ANZ Australian and New Zealand Banking Group
ANZ NZ ANZ Banking Group (New Zealand) Limited
ANZN ANZ National Bank Limited
APRA Australian Prudential Regulation Authority
APE Alternative profit efficiency
ASEAN Association of Southeast Asian Nations
BC Battese and Collie
BNZ Bank of New Zealand
CBA Commonwealth Bank of Australia
CEE Central and East European
CER Closer Economic Relations
CE Cost efficiency
CPI Consumer Price Index
DEA Data Envelopment Analysis
DFA Distribution Free Approach
EU European Union
FDH Free Disposable Hull analysis
FDI Foreign direct investment
FIPS Financial Institutions Performance Surveys
GDP Gross Domestic Product
GFC Global finance crisis
HSBC Hong Kong and Shanghai Banking Corporation Limited
RBA Reserve Bank of Australia
LLR Log Likelihood Function
LR Likelihood ratios
MLE Maximum likelihood estimates
MNB Multinational Bank
x
NAB National Australia Bank
NPI Negative profit indicator
NPL Non-performing Loan
OCR Official Cash Rate
OECD Organisation for Economic Co-operation and Development
OLS Ordinary Least Squares
PE Profit efficiency
PTA Policy Targets Agreements
INF Inflation rate
IFRS International Financial Reporting Standards
IMF International Monetary Fund
SD Standard Deviation
SFA Stochastic Frontier Approach (Analysis)
SCF Stochastic Cost Function
TFA Thick Frontier Approach
TC Total Cost
TSB TSB Bank Limited
TWI The Trade-Weighted Index
TTMRA Trans-Tasman Mutual Recognition Agreement
US United States
UK United Kingdom
WESTPAC Westpac Banking Corporation
2 efficient and sound New Zealand banking system has benefited from the strong presence of foreign-owned banks.
Greater banks’ efficiency can promote financial system soundness and economic growth, while an inefficient banking system can cause financial instability. Thus, the demand for bank efficiency analysis in any nation is primarily due to a desire for better policy decisions to enhance financial system stability and economic growth opportunities, which in turn helps to improve banks’ managerial performance. In the New Zealand context, foreign-owned banks have dominated the nation’s banking system for more than a decade (Reserve Bank of New Zealand, 2004a), and the evaluation of foreign-owned banks efficiency is therefore of particular interest to both policy makers and academics.
New Zealand was regarded as the most regulated country in the world prior to 1984. Competition between the banks was severely constrained by barriers to entry to limit foreign ownership (Walsh, 1988). Since 1984, the wave of reforms in financial markets, such as the removal of restriction on interest rates and lending criteria, and, in particular, the removal of the prudential restrictions on foreign ownership of financial institutions, has essentially opened the door to foreign banks’ new entrants (Grimes, 1998). Foreign banks tend to be attracted to countries with higher per capital income, low taxes, and a stable and efficient financial market, and invest in a country with less regulatory restrictions (Claessens et al., 2001), New Zealand has exhibited such characteristics since the deregulation in 1984.
The historically closer Trans-Tasman integration between New Zealand and Australia in regulation and supervision of economic and financial markets, has allowed more Australian banks to establish their physical presence in the New Zealand financial market compared with other nations. Claessens and Van Horen (2014) explains that bilateral factors such as distance, trade linkage and institutional similarity between home and host countries can significantly contribute to the development of an integrated market. An increased integration of the financial market is supposed to bring price convergence and improvement in banks’ cost efficiency via increased competition in the local market (Andrieş & Căpraru, 2012).
4 factors and foreign banks’ efficiency levels are often debatable in the literature. The choice of efficiency measurement methods is also contestable among the various studies.
Foreign bank efficiency studies in developed countries have their origins in the US market. Early studies in the early-mid 1990s using the US data DeYoung and Nolle (1996); Mahajan, Rangan, and Zardkoohi (1996); Chang, Hasan, and Hunter (1998); Peek, Rosengren, and Kasirye (1999) found that foreign banks entering the well-developed US financial market generally had difficulties competing in the dominantly domestically-owned banking market in the US. Similarly, a study by Berger et al. (2000) of France, Germany, Spain, the UK, and the US during the 1990s, found, on average, domestic banks have higher efficiency than foreign banks in those countries. Recent studies in Australia (Sathye, 2001; Sturm & Williams, 2008, 2009, 2010) also support the US findings, despite its banking system being dominated by the big four domestic banks5 which have acted as
barriers to foreign banks’ new entrants (Sturm & Williams, 2004).The common feature of the banking system in these developed countries is the dominant position of domestically-owned banks.
In contrast, studies in developing countries suggest that foreign banks are more efficient than domestic banks. Berger et al. (2000) and Isik and Hassan (2002), Havrylchyk (2006) suggest that foreign banks generally capitalise well on their advantages and exhibit a higher level of efficiency than their domestic counterparts. Cross-country evidence can be found in studies of Central and East European (CEE) countries (Kasman & Yildirim, 2006; Naaborg, 2007; Rossi, Schwaiger, Winkler, & Nationalbank, 2005) ; 40 African countries (Figueira, Nellis, & Parker, 2006), and 20 Latin American countries (Figueira, Nellis, & Parker, 2009). Some single-country studies in Asia-specific countries (for example Berger, Hasan, and Zhou (2009) in China; Tahir and Haron (2008) in Malaysia; Sharma, Gounder, and Xiang (2013) in India) support the general findings which suggest that economic reforms have significant effects on foreign bank entry and their efficiencies in developing countries.
5 The big four domestic banks are Commonwealth Bank Australia( CBA), Westpac Banking Corporation
5 The relationship between foreign ownership and foreign banks’ efficiency has been examined among the previous foreign bank efficiency studies reviewed. Two popular hypotheses, the home field advantage hypothesis and limited global advantage hypothesis6, have been developed (Berger et al., 2000) and tested in the literature. Berger
and Mester (1997) reviews 130 bank efficiency studies, of which a few addressed the impact of foreign ownership on banks’ efficiency, suggest that foreign banks in developed countries likely experience higher costs, lower profitability and diminished competitiveness with regards to domestic banks, thus the efficiency disadvantages of foreign banks relative to domestic banks, on average, tend to outweigh the efficiency advantages (home field advantage hypothesis). Previous studies in the US (Chang et al., 1998), European countries (Curi, Guarda, Lozano-Vivas, & Zelenyuk, 2013; Naaborg, 2007) and Australia financial market (Sturm & Williams, 2008, 2009, 2010) appear to support the home field advantage hypothesis.
Some foreign banks, however, are likely to be able to overcome some cross-border disadvantages when they operate in host nations with similar financial markets, regulatory, or supervisory conditions, as opposed to banks from nations with less similarity between home and host countries (limited global advantages hypothesis). Evidence can be found in Sturm and Williams (2009,2010) in Australia, Lensink, Meesters, and Naaborg (2008), Naaborg (2007) in the European Union (EU) market, Curi et al. (2013) in Luxembourg, Berger et al. (2009) in China, and Vu and Nahm (2013) in Vietnam. In the New Zealand context, To and Tripe (2002) found that Australia-owned banks were more competitive compared with foreign banks from other nations (Netherland, Germany, the US, Japan, Korea, etc.), which is attributable to the knowledge, experience and general managerial expertise their parent banks have in the New Zealand financial market.
Organisational form has also been documented in a few foreign banks’ efficiency studies (for example, Curi et al, 2012, Luxembourg; Isik and Hassan, 2002, Turkey). Evidence in Luxembourg suggests that foreign branch banks are more efficient than subsidiary banks. However, Isik and Hassan (2002) suggest that organizational forms of foreign banks do not play an important role in determining foreign banks’ efficiency in Turkey’s banking
6 Berger et al. (2000) developed home field advantage hypothesis and the global advantage hypothesis. There
6 sector, both subsidiary and branch forms exhibit higher cost and profit efficiency than domestic banks.
There has been a trend that foreign banks establish a physical presence in the host country through cross-border mergers and acquisitions (M&As) to improve scale, scope, product mix or X-efficiency (Berger et al., 2000). In recent times, mergers and acquisitions among foreign banks within one single nation have become more frequent in many countries. The impact of M&As has been addressed in several foreign bank efficiency studies (Berger et al., 2000; Havrylchyk & Jurzyk, 2011; Peng & Wang, 2004) which suggest that two larger merged banks have competitive advantages in pricing thus reflecting the banks’ cost efficiencies and better risk management in the local market. Liu and Tripe (2003) and Tripe (2003) support the premise that banks’ efficiency gains are associated with bank merger and acquisitions in New Zealand.
Some foreign bank efficiency studies have also sought to disentangle foreign banks’ managerial inefficiencies by examining the general bank-specific characteristics such as bank size (Sabi, 1988) capital requirement (Yildirim & Philippatos, 2007), asset quality (Havrylchyk, 2006) and market concentration ((Berger & Hannan, 1998; Berger & Mester, 1997; Chan, Schumacher, & Tripe, 2007). Findings are not unanimous on the impact of bank size, capital requirement and market concentration on foreign banks’ efficiency levels, however, efficient foreign banks generally are found to have a lower level of non-performing loans or impaired assets (Berger & DeYoung, 1997). More importantly, these bank specific factors can be part of accounting for different risk preferences, which affect the banks’ goal of cost minimization or profit maximization. If these factors are excluded in the bank efficiency assessment, then banks’ efficiency can be mismeasured (Berger & Mester, 1997).
7 With regard to the measurement techniques in foreign banks’ efficiency literature, frontier efficiency estimations7 have been applied intensively. The basic framework is to identify
the best practice firms as efficiency leaders to represent the technical efficiency optimal
frontier, then compare the efficiency degree of other firms or groups with the optimal performance under the assumption that the firms face the same market conditions(Farrell,
1957). The two principal frontier efficiency estimation methods when measuring foreign
banks efficiency are Data Envelopment Analysis (DEA) and Stochastic Frontier Analysis (SFA), which involve mathematical programming and econometric methods, respectively. The choice of the techniques can be affected by the data sample, data availability: ( in particular pricing data), the purpose of the research, and other factors (Coelli, Rao, O'Donnell, & Battese, 2005).
The DEA approach8 is a linear mathematic programming method which constructs a
non-parametric frontier over the data to calculate the efficiency measures relative to the frontier. Comprehensive details of the method are available in the discussion on the frontier efficiency studies by Berger and Mester (1997) and Coelli et al. (2005). The DEA method can be used when price data is not available and works well with small data samples, for example, Gaganis and Pasiouras (2009) in Greece; Sharma et al. (2013) in Fiji; Lozano-Vivas, Pastor, and Hasan (2001) in 10 small European countries; Anayiotos, Toroyan, and Vamvakidis (2010) in 14 emerging European countries, and in the New Zealand literature. This non-parametric technique typically focuses on technological optimization rather than economic optimization, and usually does not allow for random error in the data (Berger & Mester, 1997).
In contrast, the Stochastic Frontier Analysis9 (SFA) approach as a parametric frontier
measurement method requires assumptions to be made about the distribution of inefficiency in a functional form to reveal the relationship between inputs and outputs, thus it generally accounts for both random error and systematic difference (Berger & Mester, 1997; Coelli et al., 2005); (Kumbhakar & Wang, 2005). Berger and Humphrey
7 According to Berger and Mester (1997) there are five common efficiency estimation techniques: data
envelopment analysis (DEA), free disposable hull analysis (FDH), stochastic frontier approach(SFA), thick frontier approach (TFA) and distribution-fee approach (DFA). More discussion can be found in their study.
8 DEA approach was originally defined by Fried, Lovell, and Schmidt (1993) and has been developed by
Coelli et al. (2005).
9 Stochastic Frontier Analysis (SFA) was originally defined by Aigner, Lovell, and Schmidt (1977), Battese
9 established domestic Kiwibank in 2002,and ANZ’s acquisition of the National Bank in 2003. Thus, bank efficiency evaluation should have been promoted by addressing these changes in the competitive environment in New Zealand, particularly following the global financial crisis during 2007 and 2009 (Bloor & Hunt, 2011). Unfortunately, no empirical studies in New Zealand literature have undertaken this task.
Previous New Zealand bank efficiency studies mostly focus on estimating the efficiency of major, locally incorporated foreign banks and domestic banks between 1989 and 2003, with all large foreign-owned banks (ANZ, The National Bank, BNZ, ASB and Westpac bank) and TSB (a small regional domestic bank) included in the data sample for all six bank efficiency studies. However, the studies have neglected some specialist foreign branches that have concentrated on a particular market niche in which they have a comparative advantage in the New Zealand banking industry (Rhoades, 1998),for example, Rabobank, specialising in rural banking and Deutsche bank in investment banking. Excluding these banks in the data sample could have possibly resulted in overestimated efficiency levels for the major banks in those studies.
In addition, the techniques of efficiency measurement in the New Zealand studies are not diversified and tested, with the DEA approach the principal technique used in all existing New Zealand bank efficiency studies. This could be the result of the small bank sample size and data availability in New Zealand (Tripe, 2005b), as the DEA approach can avoid imposing specific functional forms on pricing data and bypass problems associated with price data and data heterogeneity in the New Zealand banking sector. However, the method has no control of measurement errors, which could also lead to overestimated efficiency scores (Tripe, 2003).
13 peaked at 24 in 1990, but fell to below 20 by 1994, then remained fewer than 20 until March 2011(Matthews & Rex, 2013). The relatively static number of registered banks has been largely due to the highly competitive New Zealand financial market and the costs of setting up a new banking operation given the small scale of the market (Bollard et al., 2011).
As at 31 December 2010, there were a total of 20 registered banks in New Zealand, with total assets of $380 billion, accounting for 195% of New Zealand GDP and 80% of the total financial system assets. Of the total 20 registered banks, 17 were foreign-owned banks, accounting for 89% of total banking assets in the banking system (Bollard et al., 2011). The high degree of foreign ownership by large offshore parent banks has particular implications for New Zealand banking regulatory regimes, such as the disclosure and capital adequacy requirements.
Based on the Financial Stability Report (Reserve Bank of New Zealand, 2012a) as at 31 December 2011, the highest percentage of market share11 of foreign-owned banks in New
Zealand is held by Australia (87.6%), followed by banks from the Netherlands (2.7%), the UK (1.3%), the US and Germany (0.8% each), Japan (0.6%) and South Korea (0.1%).
The big-four Australian-owned banks in New Zealand 12 have significant market shares
(measured by the percentage of the total banking sector assets) in New Zealand, with 29.2% for ANZ National Bank Limited (ANZN13), 18.25% for Bank of New Zealand
(BNZ), 17.1% for Westpac Banking Corporation, New Zealand Branch (Westpac NZ), and 16.6% for ASB Bank limited (ASB).Theirparent banks are the four major domestic banks in Australia: Australia and New Zealand Banking Group (ANZ), National Australia Bank Limited (NAB), Westpac Banking Corporation (Westpac) and Commonwealth Bank of Australia (CBA) respectively. This implies that the structure of New Zealand’s banking
11 Total registered banks’ assets as a proportion of the total assets of the banking system, including domestic
banks but excluding the Co-operative Bank limited and Bank of Baroda (New Zealand) Limited and Bank of India (New Zealand) limited. (Reserve Bank of New Zealand: (Reserve Bank of New Zealand, 2012a)
12 There were ‘big five’ banks in New Zealand before National bank was acquired by ANZ Banking Group
(New Zealand) Limited in 2003.
13 ANZ Banking Group (New Zealand) Limited amended their registered name to ANZ National Bank
14 system is heavily dependent on developments in the Australian banking system (Rodgers, 2003).
No domestic banks have held a dominant position in any segment of the financial market in New Zealand. For example, there were only four domestic banks in New Zealand by December 2011 accounting for only 5.7% of total banking assets in 2011: Kiwibank Bank Limited (3.7%), TSB Bank Limited (1.3%) and The Southland Building Society (0.7%) (Reserve Bank of New Zealand, 2012). TSB, registered in 1987, was a regional bank with branches in certain areas only while Kiwibank, registered in 2002, operated from government owned Post Shops throughout the country. The other two new banks, The Southland Building Society (registered in 2008) and the Co-operative Bank Limited (registered in October 2011) were formerly building societies.
The dominant position of foreign-owned banks in New Zealand’s banking system raises the issue of the relationship between the home and the host supervisory agencies and central banks. The RBNZ openly acknowledges the New Zealand banking system derives benefits from the home regulatory authorities of the parent banks. Foreign banks in New Zealand have, for example, access to the expertise and technology present in the foreign operations of global companies, and funding and operational support from parent banks and related parties (Chetwin, 2006). However, the RBNZ also recognizes the potential diverging and conflicting interests between home and host authorities, such as in the allocation of capital and risks across a multinational group of banks (Bollard, 2004b).
16 example, the Act of Parliament 1989 virtually ruled out new bank entrants into New Zealand, and there had been no new entrants for over 30 years, since 1951(Grimes, 1998).
The legislation prior to the financial reforms in 1984 split the financial service market into different segments and restricted their products and services’ boundaries. Trading banks and savings banks were the two major types of banks. Prior to 1987, the legislation required a specific Act of Parliament to establish a trading bank, which were mainly allowed to serve business clients and provide cheque accounts to individuals. Savings banks were also governed by legislation and were largely restricted to providing services to meet individual’s other financial needs(Grimes, 1998). There were only four designated trading banks and some smaller savings institutions prior to 1984.
The financial reform process was completed in 1984, although the New Zealand Government started to ease the restrictions on financial institutions in 1957 (Evans, Grimes, Wilkinson, & Teece, 1996). The major reforms of 1984 include the removal of all interest rate controls and directed lending criteria; the removal of credit ceilings; the elimination of exchange controls, and the move to a floating exchange rate (Grimes, 1998). The most significant effect of the removal of those restrictions was to put financial institutions on an equal footing to compete more actively for market share, and develop, defend and retain a secure niche in the market place (Russell, 1985).
21 The process of integration between New Zealand and Australia, formerly referred to as Closer Economic Relations (CER), was inaugurated in 1983 before major reforms began in New Zealand in 1984. CER is a series of agreements and arrangements with the objective of expanding free trade by eliminating barriers to trade and promoting fair competition between New Zealand and Australia.
Since 1990, both countries have moved progressively towards much deeper cooperation in policies, laws and regulation regimes through the process of coordination, mutual recognition and harmonisation (Ministry of Foreign Affaris and Trade, 2013) . The Trans-Tasman Mutual Recognition Agreement (TTMRA) of 1998 is the key driver in the integrated Trans-Tasman market for the sale of goods and the registration of occupations, lowering compliance costs for business and reducing technical barriers to trade, and has contributed significantly to increasing the Trans-Tasman mobility of goods and labour (Conway, Meehan, & Zheng, 2012).
In the banking sector also efforts were made, with longstanding bilateral support for improving the degree of cooperation between the systems in New Zealand and Australia (ANZ, 2012). These included areas such as taxation (e.g. mutual recognition of franking and imputation credits, capital and withholding tax reform), prudential standards (e.g. Basel Committee on Banking Supervision), crisis management and bank resolution (alignment of bank resolution schemes such as deposit insurance), transaction banking (seamless transaction banking) and super portability (movement of retirement savings accounts across the Tasman).
23
Table 2.1: Registered Banks: 2002-2011
Foreign-owned Banks Details
Locally incorporated banks Registered Ownership
ANZ National Bank Limited 2004 Australia
(ANZ Banking Group (New Zealand) Limited)b 1987 Australia
Bank of New Zealand 1987 Australia
ASB Bank Limited 1989 Australia
Westpac New Zealand Limited 2006 Australia
Branches of overseas-incorporated banks
Westpac Banking Corporation 1987 Australia
The Hongkong and Shanghai Banking Corporation Limited 1987 The UK
Citibank N.A 1987 The US
Deutsche Bank A G 1996 Germany
Kookmin Bank 1997 Korean
Rabobank Nederland 1996 Netherland
Rabobank New Zealand Limited 1999 Netherland
The bank of Tokyo-Mitsubishi (UFJ), Ltd 2004 Japan
JP Morgan Chase Bank NA 2007 The US
Baroda (New Zealand) Limited 2009 India
Commonwealth Bank of Australia 2000 Australia
BOI (New Zealand) Limited 2011 India
Domestic-owned Banks
TSB Bank Limited 1989 Kiwibank Limited 2001
The Co-operative Bank of New Zealand 2011
Southland Building Society 2008
Sources: Reserve Bank of New Zealand Notes:
a. Banks locally incorporated in New Zealand all have 100% of foreign ownership by 2011 b: ANZ Banking (New Zealand) Group Limited was amended to ANZ National Bank Limited after the acquisition of the National Bank in 2003.
24 For the purpose of this study20, we provide profiles for the banks21which were in
continuous operation over the study period between 2001 and 201122.
They arethe four systematically important Australian-owned banks (ANZ National Bank, BNZ, ASB and Westpac as a branch), four major foreign branch banks (Citibank, Deutsche Bank, Rabobank Nederland and HSBC), and two major domestic banks (Kiwibank and TSB Bank). In addition, we include the ANZ Banking Group (NZ) Limited and The National Bank due to the involvement of the ANZ’s acquisition of the National Bank. Rabobank New Zealand Limited and Westpac New Zealand Limited are also discussed in the profile of their consolidated group (Rabobank Nederland and Westpac branch) in New Zealand.
Table A.2 in Appendix A summarises the reviews of the New Zealand banking industry between 2002 and 2011 to provide readers a better understanding of the performance of the industry.
The profiles of the major banks which operated in New Zealand over the period 2002-2011 are summarised below based on information from the Financial Institutions Performance Survey Reviews by KPMG (2002-2011a), the Reserve Bank of New Zealand website (www.rbnz.govt.nz), individual banks’ websites, and Matthews and Rex (2013):
Foreign banks’ profiles:
ANZ Banking Group (New Zealand) Limited (ANZ NZ): The fourth largest banking group in New Zealand by total assets prior to acquisition of the National Bank in 2003. ANZ acquired Post Bank from the New Zealand government in 1989 and operated it for five years before amalgamating the legal entity into ANZ Bank in 1994, then acquired EFTPOS New Zealand Limited during 2000. ANZ has a significant market share in funds management and business banking.
20 The banks not listed here are either those with a small market share or newly established. Price data is
not available for our study. The four banks with small market shares as at 31 December 2011 were: CBA branch, 1.5%, Kookmin Bank, 0.1%, JPMorgan Chase Bank, 0.3% and the Bank of Tokyo-Mitsubishi, 0.6%). The 4 newly established foreign banks are Bank of Baroda (New Zealand) Limited and Bank of India (New Zealand) Limited, while domestic banks are Southern Building Society (SBS, registered in 2008), and the Co-operative Bank Limited which registered on 26 October 2011 (Reserve Bank of New Zealand, 2012a).
21 For complete bank profiles, see (Matthews & Rex, 2013) and (KPMG, 2002-2011a).
25
ANZ National Bank Limited (ANZN). In December 2003, the ANZ Banking Group (New Zealand) Limited acquired the National Bank from Lloyds TSB Group PLC, and became the largest banking group in New Zealand in terms of total assets. The two banks operated for a further 10 years as separate brands until 2013. There has been increasingly intense competition across both wholesale and retail banking since 2003, when ANZ acquired the National Bank.
The National Bank of New Zealand Limited (NBNZ): Founded in London in 1872, The National Bank was a 100% owned subsidiary of Lloyds TSB Group PLC before being acquired by the ANZ Banking Group (New Zealand) Limited in 2003. It was recognized for its strong retail network, securities and derivatives market, funds management and wholesale banking and rural lending.
Bank of New Zealand (BNZ): BNZ was owned by the New Zealand government before being sold to the National Australia Bank in November 1992. It is one of the largest banks in total assets with significant market share in all areas, especially business banking, rural banking and credit cards.
Westpac Banking Corporation (Westpac): Westpac (Australia) is Australia’s first bank, dating back to 1817, focusing on domestic markets in Australia, with some overseas operations. Itregistered with the RBNZ on 1 April 1987as Westpac Trust, formed by the merger of Westpac and Trust Bank in 1996, and operated in New Zealand as a branch of Westpac Banking Corporation (Australia) until November 2006, when its retail business was separately incorporated as Westpac New Zealand Limited.
ASB Bank Limited (ASB): 100% owned by Commonwealth Bank of Australia (CBA) since October 2000 when CBA purchased the remaining of 25% share from the ASB Community Trust, ASB is stronger in the traditional Auckland market. It has undertaken expansion throughout New Zealand since the 1990s and achieved strong asset growth and profit over the last decade. ASB has been recognized as the leader in the use of technology in the banking industry.
26 network available to their customers, specialising in foreign exchange, derivatives, and a full range of balance sheet lending.
DeutscheBank: Registered as a branch in New Zealand in 1996, it is not a trading bank, its activities are more in investment banking and securities trading. The bank’s business strategy is to focus on the integrated delivery of high value products to a broad range of domestic and international, global, corporate, and institutional clients in New Zealand.
Rabobank: The Netherland based Rabobank is an international bank with a focus on the food and agri-business industry with a credit rating of triple “A”. It registered two entities in New Zealand --- Rabobank Nederland branch (in 1996) and Rabobank New Zealand Limited (in 1999). The branch conducts corporate banking, food and agribusiness banking and structured finance activities while Rabobank New Zealand limited is responsible for the rural banking business. The disclosure statements for Rabobank Nederland are consolidated with Rabobank New Zealand Limited.
The Hong Kong and Shanghai Banking Corporation Limited (HSBC): Operates in New Zealand as a branch, wholly owned by The Hong Kong and Shanghai Banking Corporation Limited. The London-based multinational bank primarily focusses on the corporate market but has seen recent rapid growth in both commercial and personal financial service sectors. The New Zealand branch employs around 200 people on average.
Domestic banks:
TSB Bank Limited: Registered in 1989, TSB bank is the most established New Zealand owned registered bank and has marketed its services beyond its community in Taranaki to a national customer base.
28 According to KPMG (2003), the year 2002 exhibited a record 16.9% improvement in profitability for New Zealand’s registered bank sector. The overall net profit after tax for the sector increased by 25.8%, equivalent to 2.2% of GDP in 2002 (Reserve Bank of New Zealand, 2004a).
Prior to the global financial crises, the four major banks contributed almost 90% of the total sector profit which reflects the variation in performance of some smaller registered banks. ANZ National, ASB and BNZ increased their profit, on average, by 16.20% compared to the 7.0% increase across the sector (KPMG, 2006).
During the global finance crisis period between 2007 and 2009, banks experienced significant falls in profit which were mainly driven by the increase in impaired assets and reduced interest margins. With liquidity support from the New Zealand government and the RZBN, there was no bank failure during the crisis period, rather a continuation of profit growth in registered banks from 2010 (KPMG, 2011).
In fact, the total profit of registered banks increased from 2.09% in 2010 to 2.20% in 2011 while the net profit after tax increased by 19.2% from $2,775 million to $3,306 million . The low interest rate environment and increased borrowing volume played their parts in the increased interest income while interest expenses increased, but to a lesser extent in a flat lending environment (KPMG, 2011).
Foreign banks clearly enjoyed an advantage and achieved high profits before tax over the study period 2002 to 2011. Domestic banks also seemed to be responding positively to foreign banks’ competitive pressure, especially during the global financial crisis period, due to less dependency on off shore funding resources.
30
Figure 2.3 Registered Banks: Impaired Assets ratios (2002-2011)
Source: Reserve Bank of New Zealand Statistic
The trend in Figures 2.3 reflects that New Zealand major banks enjoyed a relatively flat, low, impaired asset level (between 0.11% to 0.19%) from 2003 until a significant increase in 2007, which suggests a significant reduction in banks’ credit quality due to the global financial crisis (GFC) and domestic recession between 2007 and 2009. One should be aware that data on impaired assets tend to be lagging indicators of changes in credit quality while credit quality in turn can be lagging indicators of changes in the economic cycle. Therefore, banks should be alert to signs of any deterioration in asset quality and ensure that provisioning levels are adequate to the circumstances.
KPMG (2012) also reported that banks’ asset quality improved and moved away from the legacy issues of the GFC in 2011, with the total banking sector impaired asset expenses decreasing by 35%. The total impaired asset expenses of average loans and advances in 2011 was 0.28%, compared to the peak of 0.7% in 2009, due to the best value recovery strategies realised and implemented by the banks. Kiwibank had the highest ratio of 0.72% among the major banks in 2011 due to the Christchurch earthquake and certain specific business lending accounts, followed by Westpac with 0.39%.
The level of impaired assets of foreign banks’ branches (excluding Westpac) were, however, different from the foreign subsidiaries. For example, while the subsidiaries commanded 54% of the lending in residential mortgages in 2005, branch banks had only
0.00 0.20 0.40 0.60 0.80 1.00 1.20 1.40 1.60 1.80
2002 2003 2004 2005 2006 2007 2008 2009 2010 2011
%
33 banks (foreign-owned and domestic-owned) in New Zealand. Branches of overseas incorporated banks are not required to maintain capital in New Zealand.
Capital serves as a buffer against banks’ unexpected losses and as a basis for their medium-term growth (Yeh et al., 2005). The challenge for banks and regulators is demedium-termining an appropriate amount of capital to be held to absorb unexpected losses in the event of bank’ failure. Like many other countries (such as Australia, the US), Basel I had been applicable as a capital adequacy requirement in New Zealand from 1988 (until Basel II was introduced in 2008). BaselI designates banks’ capital as Tier 1 and Tier 2, according to the banks’ loss-absorbing or creditor-protecting characteristics. Tier 1 capital includes common stock and retained earnings, while Tier 2 includes subordinated debts to provide some protection to depositors in the event of bank failure. In New Zealand, all registered banks are required to maintain a minimum ratio of 4% Tier 1 capital to total risk-weighted exposures, and 8% as total capital (Tier 1 plus Tier 2 capital) to total risk-weighted exposures.
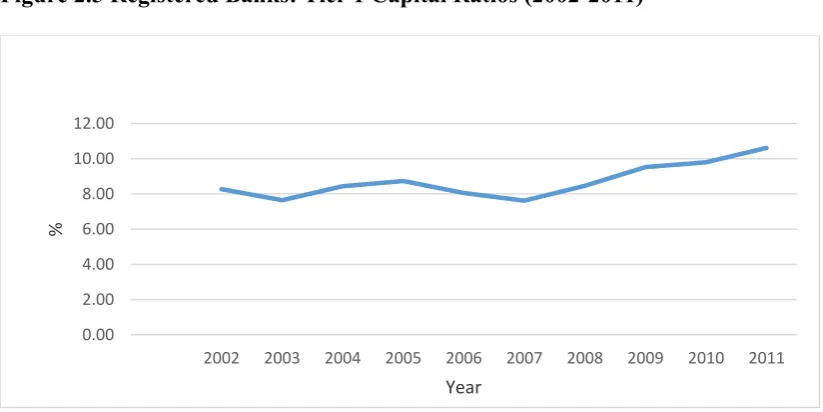
Figures 2.5 shows registered banks in New Zealand’s Tier 1 ratios ranging from 7.62% to 10.61% over the period 2002 to 2011 (Reserve Bank of New Zealand, 2015a), which is above the 4% minimum Tier 1 capital ratio required by the RBNZ. It indicates the banks’ own capital capacity to absorb losses while still continue their business growth. Retained earnings have the best ability to absorb unexpected losses to a certain level without a significant disruption to banks’ trading (Yeh et al., 2005).
Figure 2.5 Registered Banks: Tier 1 Capital Ratios (2002-2011)
Source: Statistic, Reserve Bank of New Zealand 0.00 2.00 4.00 6.00 8.00 10.00 12.00
2002 2003 2004 2005 2006 2007 2008 2009 2010 2011
%
34 From 1 January 2008, Basel II was introduced as the risk-based capital requirement for banks and applies to all locally registered incorporated banks (foreign-owned and domestic owned) in New Zealand. It focuses on the conflict between home and host regulators regarding how to verify and share information and how to allocate banks’ capital to account for the exposure to insolvency risks (Kane, 2007). A major development of Basel II is allowing banks to use their own models and techniques to measure the major risks they face, along with the probability of loss and the capital requirement to meet that loss (Yeh et al., 2005).
During the GFC and domestic recession period between 2007 and 2009, the capital position of New Zealand banks compared favourably to most overseas banks, which reflects the relative quality and simplicity of the New Zealand banks’ assets (KPMG, 2010b). Since 2011, New Zealand banks have predominantly relied on retained profits to provide increases in capital.
The incorporated bank sector had a total capital ratio of 12.5% in 2011, with Tier 1 capital ratio increased to 10%, consistent with global trends to strengthen Tier 1 capital (KPMG, 2011). The major domestic bank, TSB bank, exhibited the highest total capital ratio of 15.8% while retaining a sizeable portion of its profit, which essentially reflects the domestic ownership model of the bank requiring higher capital in the event of a crisis due to the difficulties in raising capital in a crisis compared with foreign-owned banks. However, Kiwibanks’ capital ratios decreased significantly in 2011, possibly driven by the increase in risk weighted exposure, primarily through the increase in lending without any assurance of further capital (KPMG, 2011)
Basel III was released by the Basel Committee in late 2010 and incorporates lessons learned from the GFC. It was implemented by international banking authorities and focused on quality of banks capital, consequently, from 1 January 2013, all locally incorporated registered banks in New Zealand are required to comply with the new framework of a common Equity Tier 1 capital ratio of 4.5%, a Tier 1 capital ratio of 6% and a total capital of 8% 25 (Reserve Bank of New Zealand, 2013).
25 Reserve Bank of New Zealand (2013) provides the regulatory impact assessment of Basel III capital
37 Economies of scale refer to how the banks’ scale of operations (size) is related to cost while economies of scope refer to how the banks’ choice of product mix is related to cost. X-efficiency measures how well bank management aligns technology, human resources management and other resources to produce given levels of output; it gauges the degree of friction and waste in the production process (Berger, Hunter, & Timme, 1993). Scale and scope economies and X-efficiency are different aspects of performance, with scale economies and scope economies referring to selecting the appropriate outputs, while X-efficiency refers to selecting the appropriate inputs (Mester, 2003).
X-efficiency has two components: technical and allocative efficiency. Technical efficiency refers to a firm operating below the production frontier due to unmeasured factors (“X” inefficiency), such as managerial or motivational issues. Different from technical efficiency, allocative efficiency measures how optimally mixed inputs minimise total input costs at given output quantity and input prices (Berger et al., 1993).
To achieve technical efficiency, a firm must seek the minimum combination of inputs to produce given outputs or the maximum combination of outputs obtainable from given inputs. From an economic perspective, a firm’s economic objective is cost minimization and profit maximization. Cost minimization requires technical and allocative efficiency to avoid excessive input use and a non-optimal input mix, while profit maximization also requires both, as well as operating at a right scale to achieve these efficiencies (Kumbhakar & Lovell, 2003). The production of a given output is economically efficient if there are no other ways of producing the output that use a smaller amount of inputs (Pearson Education Canada Inc., 2005).
Berger and Mester (1997) considered the most important economic efficiency concepts cost and profit efficiencies. The authors believed these concepts “have the best economic foundation for analysing efficiency of financial institutions because they are based on economic optimization in reaction to market prices and competition rather than being based solely on the use of technology” (Berger & Mester, 1997, p. 898).
40 Farrell (1957) explains that the basic framework for measuring efficiency by the frontier method is to identify the best practice bank as the efficiency leader to represent the technical efficiency frontier, then compare the efficiency degree of other firms or groups with the optimal performance, assuming the bank faces the same market conditions (Bauer et al., 1998; Von Furstenberg, 2008) . Berger and Humphrey (1997) describe the frontier efficiency analysis as essentially a sophisticated way to benchmark the relative performance of production units” within the financial industry. It provides an overall, objectively determined, numerical efficiency value and ranking of financial institutions, which is not otherwise available. Thus, frontier efficiency analysis can be used by bank managers to improve their managerial performance by identifying the “best practise” and “worst practise” banks associated with high and low efficiency measurements, respectively.
Overall, there are two main streams of frontier approach employed in the empirical literature; non-parametric (or programing) and parametric (or econometric). Fried et al. (1993) identified the two essential differences between them. First, the programming approach is deterministic, with a combination of noise and inefficiency, whereas the econometric approach is stochastic, attempting to distinguish the effects of noise from the effects of inefficiency. Second, the nonparametric approach is less prone to specification error while the econometric approach is parametric, confounding the effects of misspecification of the functional form.
The large variations in banking data necessitates the application of frontier analysis in a number of bank efficiency studies, despite there being no consensus on the best method for estimating bank efficiency. Berger and Humphrey (1997) surveyed 130 previous studies on efficiency and identified the five most common estimation techniques : Data Envelopment Analysis (DEA) and Free Disposable Hull analysis (FDH), which are nonparametric techniques, and the Stochastic Frontier Approach (SFA), Thick Frontier Approach (TFA) and Distribution Free Approach (DFA) being the parametric methods.
3.2.4.1 Non-Parametric Approaches
41 linear programming model introduced by Charnes, Cooper, and Rhodes (1978) and extended by and Banker, Charnes, and Cooper (1984). The technique envelopes observed production possibilities to obtain an empirical frontier and measures efficiency as the distance to the frontier (Ruggiero, 2007). FDH is a special form of DEA, where the points on the lines connecting the DEA vertices are excluded from the frontier. Both approaches permit efficiency to vary over time and make no prior assumptions regarding the form of the distribution of inefficiencies across observations.
DEA has been extensively used to examine banks’ X-efficiency (in particular, technical efficiency) and scale efficiency. The objective of DEA is to measure the relative efficiency among similar units that share the same technology for similar goals using similar resources (Toby, 2006). The primary advantages of the DEA approach, according to Ruggiero (2007) and (Tripe, 2005a, 2005b), are the nonparametric nature of the method and the ability to handle multiple outputs and inputs. It also has the advantage of being computationally simple as it does not require assumption of a particular functional form of relationship between outputs and inputs. In addition, DEA generally works well with small samples.
The main drawback of the DEA method is that it assumes no random fluctuations, so that all deviations from the estimated frontier represent inefficiency (Rangan, Grabowski, Aly, & Pasurka, 1988). This could lead to two biased results with either the unit under analysis biased relative to the frontier or the frontier biased upwards because of measurement error (Ruggiero, 2004).
42
3.2.4.2 Parametric Approaches
Parametric approaches, as alternative frontier estimation methods, can be dated back to Aigner et al. (1977) and Meeusen and Van den Broeck (1977). This approach assumes a given functional form for the relationship between outputs and inputs where, in a specified functional form, unknown parameters are estimated using econometric techniques. There are several parametric frontier approaches, including the Stochastic Frontier Approach (SFA), Thick Frontier Approach and Distribution Free Approach.
The SFA approach employs econometric techniques to estimate efficiency scores by allowing an error term with two components: a normally distributed random effects component and an asymmetrically (typically half-normally) distributed technical inefficiency component, estimated via maximum likelihood. This approach has a purported advantage of having the ability to measure efficiency in the presence of statistical noise (Coelli et al, 2005). Further reviews on SFA are provided in the data and methodology chapter.
Berger (1993) developed a “distribution free” approach (DFA) to separate efficiencies from random error in a different way when panel data are available. It assumes an average efficiency for each firm which is constant over time, while the random error tends to average out over time. Although DFA is less dependent on a priori distributional assumption than SFA, it relies on the strong assumption that the firm’s X-efficiencies are constant over time, and if there are changes in the X-efficiencies, then one can only predict the firm’s average inefficiency over the past (Wagenvoort & Schure, 1999).
43 Comparisons of the above parametric methods and DEA, a non-parametric method, can be found in a number of studies (Bauer et al., 1998; Berger & Mester, 1997); Ferrier and
Lovell (1990); (Hasan & Hunter, 1996) and, more recently, Coelli et al. (2005).
There are some common functional forms used in the above approaches, as summarised by (Coelli et al., 2005, p. 211): the linear, Cobb-Douglas, normalised quadratic and translog functional forms. Among these forms, the second order translog function, is more flexible, thus usually preferred, although it could face econometric difficulties due to the possibility of excessive parameters being estimated in the function.
Panel data, a time series of information for a cross-section of firms in the market, are commonly used in studies that are interested in investigating the efficiency of each firm using either non-parametric or parametric frontier analysis. Under the general framework of parametric frontier efficiency analysis, efficiency is essentially a measurement of the distance between the estimated frontier and the observed firms, which, in most situations, is captured by a residual. With panel data, the residuals of each firm are available, which allows the testing of structural hypotheses on the efficiency or statistical significance of the efficiency of each firm (Kneip & Simar, 1996).
51 The SFA results from several of the cross-country studies (see Table B.2) in transition economies show that foreign banks are more cost and/or profit efficient than domestic banks (Bonin et al., 2005a; Fang, Hasan, & Marton, 2011; Fries & Taci, 2005; Kasman & Yildirim, 2006; Rossi et al., 2005; Yildirim & Philippatos, 2007). For example, (Fries & Taci, 2005) examined the cost efficiency of a sample of 289 banks in 15 East European countries for the period 1994-2001. The authors found evidence that privatised banks with foreign ownership of at least 50% of the shares were the most cost efficient banks, compared to the least efficient privatised banks which had major domestic ownership. Kasman and Yildirim (2006) found that foreign banks were more profit efficient on average than domestic banks in 8 CEEs from 1995 to 2002, although all banking systems displayed significant levels of cost and profit inefficiency over that time. Yildirim and Philippatos (2007) reported that foreign banks were more cost efficient but less profit efficient than domestically owned banks in 12 European transition countries over the period 1993-2000.
Similarly, some single nation studies in EU emerging markets (see Table B.3) also show that foreign banks are more efficient than domestic banks. Styrin (2005) employed both SFA and DEA methods to measure banks’ X-efficiency in the Russian banking sector between 1998 and 2002. Isik and Hassan (2002) found that foreign banks in Turkey strongly outperformed domestic banks, while El‐Gamal and Inanoglu (2005) explained that foreign banks utilised advanced technology compared with domestic banks in Turkey. Havrylchyk (2006) in Poland employs the DEA technique and reports that foreign banks exhibit higher technical and allocative efficiency compared with domestically-owned banks between 1997 and 2001, despite the Polish banking system not improving over the study period.
52 Interestingly, there are limited studies on foreign banks’ efficiency in developed economies in the European banking market. A cross-country study by Berger et al. (2000) in France, Germany, Spain, the United Kingdom and the US, and single nation studies by Gaganis and Pasiouras (2009) in Greece, Béjaoui Rouissi and Bouzgarrou (2012) in France and Curi et al. (2013) in Luxembourg are reviewed here.
Berger et al. (2000) test the cost and profit efficiency in France, Germany, Spain, the United Kingdom and the US, finding domestic banks in most of the countries have both higher cost and profit efficiency than foreign banks operating in France, Germany and the UK. Foreign banks in Spain, however, exhibited lower cost efficiency but higher profit efficiency than domestic banks over the study period 1993-1998. In addition, Béjaoui Rouissi and Bouzgarrou (2012) compared cost efficiency between 62 domestic and 40 foreign-owned commercial banks in France. The authors’ SFA results showed foreign commercial banks were more cost efficient than domestic counterparts in France over the period 2000-2007, supporting the findings of Berger et al. (2000).
Gaganis and Pasiouras (2009) examined banks’ efficiency in a sample of 18 foreign and 21 domestic banks in Greece from 1999-2004 using a DEA model. Their results showed that foreign banks were more scale efficient despite having lower technical efficiency (TE) than domestic banks in almost all the years during the study period. However, both TE and scale efficiency (SE) were not statistically significant, which implies foreign banks were less efficient than domestic banks in Greece over the period 1999-2004, during which Greece was considered a small but developed country .
Curi et al. (2013) employed the DEA method to test foreign bank efficiency in Luxembourg over the period 1991-2009. Their results indicate that foreign branch banks are more diversified and foreign banks from the European region exhibited higher technical efficiency, on average. The banking sector in Luxembourg is highly dominated by foreign banks with a total of 148 foreign banks in 2009 compared with only two domestic banks, where most banks are subsidiaries and foreign branch banks.
55 sample of 204 banks in 20 Latin America countries during 2001. Their DEA and stochastic cost function (SCF) results showed that foreign-owned banks were not as efficient as their domestically owned counterparts in 2001, with differences in efficiency more related to the national regulatory and economic environment than banks’ ownership, in each country. Similarly, Wezel (2010) investigated the X-efficiency of domestic and foreign banks in the Central American region from 2002-2007. The author’s DEA and SFA results show that foreign banks in Central America were not necessarily more efficient, on average, than the local or regional banks from Brazil (Tecles & Tabak, 2010) showed that foreign banks were less cost efficient but more profit efficient over the post-privatisation period of 2000-2007.
Foreign banks have played a smaller role in most Asian financial systems than in CEEs and Latin America, reflecting regulatory limits on foreign banks entry into Asia. Chan and Karim (2011) provided cross-country evidence on four selected ASEAN (Association of Southeast Asian Nations) countries that foreign banks were more profit efficient than cost efficient relative to their domestically-owned banks. On the other hand, foreign banks operating in Malaysia exhibited higher cost and profit efficiency compared to foreign banks in Indonesia, Thailand and the Philippines.
57 New Zealand over the period 2000-2002. New Zealand’s banking industry was found to be competitive, and banks in New Zealand became more efficient over the study period, with supremely high efficiency scores ranging from 0.86 to 0.96, which are consistent with the results reported in Liu and Tripe (2003), Tripe (2003) and Adjei-Frimpong et al. (2014). The National Bank was highly efficient over the study period before being acquired by the ANZ in 2003(Vedula & Tripe, 2004).
Tripe (2004) is one of the few studies which addresses the effect of foreign ownership on bank efficiency in New Zealand. Tripe’s study shows that New Zealand banks (ANZ, ASB, BNZ, NBNZ, TSB, and Westpac NZ) with branch networks are more efficient than Australian banks (ANZ, CBA, NAB and Westpac Australia) with branch networks over the period 1996-2003. Using a DEA model with capital as the input, Tripe’s results show significant differences in average efficiency scores (0.908 for Australia major banks and 0.868 for New Zealand businesses) comparing Australian major banks and their New Zealand counterparts. However, no significant difference was found when taking into account the level of equity suggesting a strong link between the New Zealand banking system and the major Australian banks.
Tripe (2005a, 2005b) then measured the efficiency levels of six major retail banks (ANZ, ASB, BNZ, NBNZ, TSB, Westpac NZ) in the New Zealand banking market from 1996 to 2003. The author applied the DEA panel data approach as it allows the use of a range and size variables and is less constrained, which is more applicable than the traditional DEA method in the New Zealand case (Tripe, 2005b). The studies found that improvement in bank efficiency in New Zealand is possibly due to reductions in the general interest rate over the study period.
Chan et al. (2007), examining the efficiency of major banks in New Zealand between 1996 and 2005, indicated that the New Zealand banking market exhibits oligopolistic behaviour to new entrants to the banking sector. The efficient structure hypothesis revealed that larger banks enhanced the whole banking sector performance in New Zealand during the study period.
59 DeYoung and Nolle (1996) found that foreign banks in the US exhibited an inability to develop customer relationships necessary to raise and maintain core deposits, consequently, foreign banks financed their growth in the US market with higher-cost funding sources (such as offering higher deposit rates than domestic banks). Supporting evidence can also be found in other US efficiency studies by Chang et al. (1998), Hasan and Hunter (1996), and Peek et al. (1999).
There are also other single nation studies in developing countries, Hasan and Marton (2003) in Hungary; Gaganis and Pasiouras (2009) in Greece; Aysan et al. (2011) in Turkey, Jiang and Yao (2010) in China, supporting the home field advantage hypothesis that foreign banks are less efficient than domestic banks in these nations. For instance, Jiang and Yao (2010) employed the SFA approach to examine the effect of ownership on bank efficiency in China. The authors found that foreign ownership participation has a negative effect on foreign banks’ profit efficiency, despite foreign banks initially acquiring profitable Chinese-owned banks. The authors suggest that the profit inefficiency of banks with foreign ownership participation could be caused by investing more in upgrading their technology to improve service quality or being required to hold more loan loss provisions by bank regulation in the host country. China’s legal and financial systems are not well developed compared with those in developed countries (Berger et al., 2009).
3.5.1.2 Global advantage hypothesis
In contrast to the home field advantage hypothesis, under the global advantage hypothesis, foreign banks might benefit from competitive advantages relative to domestic owned banks. Berger et al., (2000) considered two forms: the general global advantage form and limited global advantage form.
Under the general global advantage form, efficient foreign banks from several nations are able to overcome competitive disadvantages when operating in distant markets with foreign economic, cultural and regulatory environments.