PRODUCTIVITY IMPROVEMENT IN
BREWERIES THROUGH LINE
BALANCING USING HEURISTIC
METHOD
OSUYA EMEKE GREAT
Department of Mechanical Engineering, University of Uyo, Uyo, Nigeria, P.M.B 1017 [email protected]
DR. ANIEKAN OFFIONG
Department of Mechanical Engineering, University of Uyo, Uyo, Nigeria, P.M.B 1017
ABSTRACT
This paper presents a heuristic procedure for improving productivity in breweries companies. A case study of Champion brewery Plc, Uyo, Akwa Ibom State was adopted. The aim of this paper is to balance the Production line of Champion lager beer. In the course of line balancing, the idle time and the number of workstations on the production line was minimized so as to maximize the efficiency of the production line. All the required data was measured and the parameters such as elapsed time at each work station, efficiencies, number of workers, time of each of the workstations etc. was calculated from the existing line. A new heuristic approach, the Longest Operation Time (LOT) method was used in designing the new production line. After set up of the new production line, the cost of production and effectiveness of the new line was computed and compared with those of the existing one. The new production line was found to have been increased by a significant amount reducing the overall production cost per unit.
Keywords: Assembly Line Balancing (AlB), balancing techniques, idle time, Line Efficiency, Task Time, Cycle Time and Bottleneck.
1. Introduction
Assembly lines are production systems developed to meet the requirements of mankind, which continue to grow day by day. The demand for greater product variability and shorter life cycles has caused traditional production methods to be replaced with assembly lines. The aims of these systems are to manufacture products at production rates in the shortest time, in the most productive way, cheaply and with the quality required. Since assembly line balancing is an NP-hard problem, some heuristic methods are still needed to solve large scale assembly line balancing problems.
An assembly line consists of a number of workstations which are arranged along a conveyor belt, or similar material transportation equipment, in order to obtain a sequence of finished product types. The work pieces are moved from station to station and at each one certain operations are performed in view of some constraints. The first primary constraint is the cycle time. The cycle time is the time interval between finishing two units or the maximum available time for the production of any work piece at any workstation. Assembly line exists when we assemble or handle any device or product in a planned, sequential manner with two or more operators performing tasks of repetitive work at established workstation (Milas, 1990). When the products have many operations and the demand is high the process of balancing the line becomes more difficult. There are two types of optimization problems for the line-balancing problem (Ajenbit, 1998). In Type I, the cycle-time (maximum amount of time units that can be spent at each workstation) is fixed and the objective is to minimize the required number of workstations. The Type II attempts to minimize the maximum cycle-time given a fixed number of workstations. This research paper will adopt the Type I problem. The overall objective of this paper is to improve productivity through line balancing by minimizing both labour and idle times on the production line. This paper intends to investigate and evaluate the line balancing problem in a production line of Champion lager beer .The paper seeks to:
I. Identify the line balancing problem.
ii. Identify the idle time at each workstations and how it can be reduced.
1.1 Terminology Defined:
The Terminology of assembly line analysis are as follows:
1. Work Element (i): The job is divided into its component tasks so that the work may be spread along the line. Work element is a part of the total job content in the line. Let TV be the maximum number of work element, which is obtained by dividing the total work elements into minimum rational work elements. Minimum rational work element is the smallest practical divisible task into which a work can be divided. The time in a-work element, i say (TjN), is assumed as constant.
2. Work Stations (w): It is a location on the assembly line where a combination of few work elements is performed.
3. Total Work Content (Twc): This is the algebraic sum of time of all the work elements on the line. 4. Station Time (Tsi): It is the sum of all the work elements (i) on work station (s).
5. Cycle Time (c): This is the time between two successive assemblies coming out of a line. Cycle time can be greater than or equal to the maximum of all times. If, c = max {Tsi}, then there will be ideal time at all stations having station time less than the cycle time.
6. Delay or Idle Time at Station (Tds):This is the difference between the cycle time of the line and station time.
7. Precedence Diagram: This is a diagram in which the work elements are shown as per their sequence relations. Any job cannot be performed unless its predecessor is completed. A graphical representation, containing arrows from predecessor to Predecessor have the successor work element. Every node in the diagram represents a work element.
8. Balance Delay or Balancing Loss (d):This is a measure of line-inefficiency. Therefore, the efficient is done to minimize the balance delay. Due to imperfect allocation of work along various stations, there is idle time to station.
9. Line Efficiency (LE):It is expressed as the ratio of the total station time to the cycle time, multiplied by the number of work stations.
10. Target time: Target cycle time (which must be greater than or equal to the target task) or define the target number of workstations.
2. Method Used
The Longest Operation Time (LOT) procedure is used in this research work. It is the line-balancing heuristic that gives top assignment priority to the task that has the longest operation time. The steps of LOT are:
LOT 1: To assign first the task that takes the most time to the first station.
LOT 2: After assigning a task, to determine how much time the station has left to contribute. LOT 3: If the station can contribute more time, assign it to a task requiring as much time as possible.
2.1 Data and Results
The following are the work elements that make up the production line of Champion lager beer: 1. Carrying pallets from the store by the forklift to the production line.
Break Point: Forklift drops the pallet. 2. Depalletizing by depalletizer.
Break point: Depalletizer drops the last crate. 3. Moving one crate to Decrater
Break Point: The crate reaches the Decrater 4. Decrating by Decrater.
Break point: The bottles are dropped on the conveyor 5. The empty crate moves to the crate washer
Break point: The crate is at the exit of crate washer. 6. The empty bottles moves to the bottle washer.
Break point: The bottles are at the entrance of the bottle washer. 7. Washing of the bottle by bottle washer.
Break point: The bottle is at the exit of the bottle washer. 8. Pre-Inspection by Inspector.
Break point: The bottle is at the exit of the pre-inspection point. 9. The bottle moves to empty bottle inspector.
Break point: The bottle is at the entrance of the empty bottle inspector. 10. Empty bottle Inspection by Inspector.
Break point: The bottle is at the entrance of the filler. 12. Filling of the bottle with the beverage and crowning.
Break point: The bottle is at the exit of the crowner. 13. The bottle moves to the manual filled bottle inspector.
Break point: The bottle is at the exit of the manual filled bottle inspector. 14. The bottle moves to pasturizer for treatment.
Break point: The bottle is at the entrance of pasturizer. 15. Full inspection by pasturizer.
Break point: The bottle is at the exit of the pasturizer. 16. The bottle moves to the labeler.
Break point: The bottle is at the entrance of the labeler 17. Labeling the bottle by Labeler
18. The bottle moves to the packing table. Break point: The bottle is at the packing table. 19. Packing at the packing table by Packer.
Break point: A crate of Coca Cola is packed. 20. The crate moves to the palletizer.
Break point: A crate reaches the palletizer. 21. Palletizing by palletizer.
Break point: A pallet is packed. 22. Carrying a pallet to the store by forklift.
Break point: A pallet gets to the store.
The work elements (or tasks) are represented by numbers 1 to 22.
The time study was conducted on one pallet of 60cl bottle of Champion lager beer. One pallet contains 48 crates, which contains 12 bottles each. Therefore, the total number of bottles in one pallet is 576 bottles.
It takes 12856 seconds to produce one pallet of Champion lager beer. This means, a crate, which contains 12 bottles, is produced in 275 seconds. The precedence diagram of Champion lager beer production line starts with carrying the pallets from the store by the forklift and ends with carrying pallet of finished product to the store. Task 12 is the bottleneck operation and its task time is 108 seconds is the cycle time. Thus, cycle time is 108 seconds. Champion lager beer production lines originally have 9 workstations and 15 workers excluding one supervisor. The production line is comprises of machines and workers. The production line is been monitored and operation of the line is analyzed in this research paper.
Task number 12, (filling the bottle with the beverage and crowning) has a task time of 108 seconds giving us a production rate of 400 crates per day.
1 2 3 4
5
6 7 8 9 10 11 12 13
14 15
16
The table below shows the summary sheet for Champion lager beer Production line:
Task or Element
Basic time (sec)
ALLOWANCE (sec) Standard
Time per Pallet (sec)
Standard Time per Crate (sec) Fatigue (4%) Personal Need
(6%)
1 197 7.88 11.82 217 5
2 262 10.48 15.72 288 6
3 273 10.92 16.31 300 6
4 542 21.68 32.02 596 12
5 217 8.68 13.02 239 5
6 480 19.2 28.8 528 11
7 989 39.56 59.34 1088 23
8 206 8.24 12.36 227 5
9 202 8.08 12.12 222 5
10 559 22.36 33.54 615 13
11 210 8.4 12.6 213 4
12 4700 188 282 5170 108
13 245 9.8 14.7 270 6
14 189 7.56 11.34 208 4
15 613 24.52 36.78 674 14
16 206 8.24 12.36 227 5
17 498 19.92 29.88 548 11
18 218 8.72 13.08 240 5
19 506 20.24 30.36 557 12
20 185 7.4 11.1 204 4
21 250 10 15 275 6
22 208 8.32 12.48 229 5
TOTAL 12856 275
The production line of Champion lager beer is operational for 12 hours in seconds daily. Maximum daily output = Available time per day in seconds
Cycle time required per crate = 3600 x 12
108 = 43200
The table below shows the assignment of task to workstations for Champion lager beer Production line:
Workstation Number of
workers work element Task times (sec) Time per station (sec) Idle time Per station (sec) 1 2 1 2 3 4 5 6 6 12
29 79
2 1 5 6 5 11 16 92 3 2 7 8 23 5 28 80 4 2 9 10 11 5 13 4 22 86 5 1 12
108 108 0
6 2
13 14 15 6 4 14 24 84
7 1
16 17
5
11 16 92
8 1
18 19 5 12 17 91 9 2 20 21 22 4 6 5 15 93 TOTAL 15
275 697 2.1.1 Sample Calculation of the existing Production Line:
Idle time per day =
=
Line efficiency =
Balance Delay (BD) =
Balance Efficiency =
One hour in seconds
3600
Total Station time 697
= 0.2 hours
Cycle time x no of workstation x 100%
108 x 9
x 100%
= 28.3%
275 =
Total idle time per station
= (100 – 28.3) %
Idle time of all workstations Available working time for all stations BD = (100 – LE)
= 71.1%
Theoretical minimum no. of worker = Since, Total time, ΣT = W1T1 + W2T2 + W3T3 +…………+ WyTy
= 3 x 29 + 1 x 16 + 2 x 28 + 2 x 22 + 1 x 10⁸ + 2 x 24 + 1 x 16 + 1 x 17 + 2 x 15 = 885 seconds
Theoretical minimum no. of worker =
Balance Efficiency = x 100% = 55%
Balancing of Champion lager beer Production line as to minimize the number of work stations. Originally, the production line of Champion brewery has 9 workstations. In an attempt to balance the line, the new number of workstations is calculated as follows:
Theoretical minimum = Number of workstation
=
=
= 2.55 = 3 stations
To balance the production line, the tasks or elements would be assigned to at least 3 workstations following the precedence relationship of the elements. The performance times assigned to each station cannot exceed 108 seconds cycle time. To minimize idle time, the line should now have 3 workstations and 10 workers, instead of the previous 9 workstations and 15 workers.
ΣT CT
885 108
8.2 15
= 8.2 no.
Total productive time available per day Total work content
(Time) per unit Desire number of units per day
(Total time per cycle)(Desire number of unit Available time per day
The table below shows the new task workstations assignment in Champion lager beer Production line:
Workstation Number of
workers Task or element Task time (sec) Time per station (sec)
Idle time per station (sec) 1 5 1 2 3 4 5 6 7 8 9 10 11 5 6 6 12 5 11 23 5 5 13 4 95 13 2
1 12 108 108 0
3 4 13 14 15 16 17 18 19 20 21 22 6 4 14 5 11 5 12 4 6 5 72 36 TOTAL
10 275 49
Sample Calculation of the New Production line:
New idle time per day =
=
The new idle time per day is 0.14 hours compared to the former 0.2 hours
New Line efficiency =
=
New Balance Delay (BD) = (100 – LE)
New Balance Efficiency =
= Idle time cycle
One hour in seconds 49
3600 = 0.14 hours
Total station time
Cycle time x no. of workstation
275
108 x 9 = 84.9%
x 100%
x 100%
= (100 – 84.9) %
= 15.1%
Theoretical minimum no. of workers x 100% Reduced no. of workers
8.2
3. Cost analysis and comparison
The table below shows the cost analysis and comparison of Champion lager beer Production line:
Total no. of reduced workers = 10 Nos.
The company pays at least ₦1500 to every worker for each working day.
The previous design of the production line has 15 workers at the production line. Therefore, the total labour costs for the previous design of production line are:
Daily labour cost = ₦1500 x 15 = ₦22,500.00 Weekly labour cost = ₦22,500 x 6 = ₦135,000.00 Monthly labour cost = ₦22,500 x 26 = ₦585,000.00
Considering one day as holiday, the number of working days in a month = 26
Hence, the previous design of the production line of Champion lager beer shows that the top management spent ₦585,000.00 per month for workers salary.
The new production line of Champion lager beer has 10 workers at the production line. The total labour costs for the new design of the production line are:
Daily labour cost = ₦1,500 x 10 = ₦15,000.00 Weekly labour cost = ₦15,000 x 6 = ₦90,000.00 Monthly labour cost = ₦15,000 x 26 = ₦390,000.00
The modify production line of Coca Cola, reveals that the company spent ₦390,000.00 per month for workers salary.By comparison, the new production line will improve the productivity of the company by minimizing the labour cost in the production line. The difference between the previous and the new production line of the labour cost per month is ₦585,000 – ₦390,000 = ₦195,000.00
Therefore, it would be now easy to realize that, it would be more profitable to choice the modify production line, because it minimizes the labour cost per month of the production line by ₦195,000.00.
In summary, Champion lager beer production line was balanced using longest operational time (LOT). The idle and workstations was minimized to improve productivity. A modify or new production line of 3 workstations and 10 workers was introduced instead of the previous 9 workstations and 15 workers. It was discovered that the worker responsible for task 2 (i.e depalletizing) could also take care of task 3. Also, the worker responsible for task 12 (i.e filling the bottle with beer and crowning) could also take care of task 13 and the worker responsible for task 14, could also take care task 15 and finally, worker responsible for task 20, could also take care of task 21 and 22. This led to the reduction of workers from 15 to 10 workers. As a result of this, the labour utilization or line efficiency increased from 28.3% to 84.9%, the idle time or balance delay reduced from 17.7% to 15.1% and the balance efficiency increased from 55% to 82%. Consequently, daily labour hour idle reduced from 0.2 hours to 0.14 hours and labour cost per month of the production line reduced from ₦585,000.00 to ₦390,000.00.
4. Conclusions
The cycle time used and the precedence diagrams used were based on the result of this study. Normally, it took 12856 seconds for Champion Brewery PLC., Plant to produce one pallet of 60cl bottles of Champion lager beer. The production line runs 12 hours and the maximum daily output is 400 crates (i.e 4800 bottles). The production line consists of 9 workstations and 15 workers including one supervisor. Before the production line was balance, the line was not efficient. The line efficiency was 28.3%, the idle time was 17.7%, the balance
Station number
No. of workers of the existing production line
New station number
No. of workers of the new production line
01 3 01 5
02 1 02 1
03 2 03 4
05 1 Total 10
06 2
07 1
08 1
09 2
efficiency was 56% and the daily idle time was 0.2 hours. As a result of assembly line balancing, the line efficiency increased from 28.3% to 84.9%, the idle time decreased from 17.7% to 15.1%, the balance efficiency increased from 53% to 82%, and the daily idle time reduced from 0.2 hours to 0.14 hours. Through the study of the total costs, it had been shown that ₦195,000.00 could be saved every month. Although the output remains the same but the number of workstations reduced from 9 to 3 workstations and the number of workers reduced from 15 to 10 workers including one supervisor. Hence, the same amount of product (Champion lager beer) is produced at less cost.
4.1 Recommendations and Recommendation for further study
On Champion lager beer production line, task 12 is the bottleneck operation. The company should create an efficient pathways linking pasturizer to the labeler. The empty inspection light should also be replaced with a new one for higher performances. Lastly, the speed of the conveyor belt should be increased for efficient drive. This paper covered extent of activities on the production line, for further studies, work measurement and assembly line balancing should be carried out on other sectors of the industries. The other sectors include placement of orders of raw material before getting to the production line, storage and before and after sale services. Also, other heuristic techniques for production line balancing should also be used for further studies.
Acknowledgment
The authors would like to thank the Department of Mechanical Engineering, University of Uyo, Nigeria for their numerous assistants.
References
[1] Ahmadi, R H., Dasu, S., and Tang, C.S. (1992), 'The Dynamic Line Allocation Problem', Management Science, Vol. 38, No.9, 1341-1353.
[2] Ajenbit, D. A. “Applying Genetic Algorithms to U-shaped Assembly Line Balancing Problem “Proceedings of the IEEE Conference on Evolutionary Computation (1992), pp.96 – 101.
[3] Amen, M., (2001), Heuristic methods for cost oriented assembly Line balancing: A comparison on solution quality and computing time. International Journal of Production Economic, 69(3), 255-264
[4] Assembly Line Balancing www.prenhall.com/weiss_qmwin/balancie.htm
[5] Baybars, I (1986) A survey of Exact Algorithms for the simple Assembly Line Balancing Problem. Management Science, pp.32.909-932.
[6] Helgeson, W. R. and Birnie, D. P. (1961). “Assembly line balancing using the ranked positional weight technique”, Journal of Industrial Engineering, 12, 394-398.
[7] Ibeh, M. I. (1995). Productivity in Manufacturing Industry, Federal University of Technology, Mechanical Engineering Department, Owerri, Nigeria.
[8] Johnson, R.V. (1983). 'A Branch and Bound Algorithm for Assembly Line Balancing Problems with Formulation Irregularities', Management Science, Vol. 29, No. 11, 1309-1324.
[9] M. A. Hannan, H.A. Munsur, M. Muhsin, (Nov 2011), ‘’An Investigation of the production line for enhance Production using heuristic method,’’ International Journal of Advances in Engineering & Technology.
[10] Macaskill, J. L. C. (1972), 'Production-line Balances for Mixed Model Lines', Management.
[11] Malakooti, B. and Kumar, A. (1996), “Knowledge-based System for Solving Multiobjective Assembly Line Balancing Problems”. www.prenhall.com/ weiss-qmwin/html/balance.htm
[12] Nicosia, G., Pacciarelli, D. and Pacifici, A. (2002), “Optimally balancing assembly lines with different workstations,” Discrete Applied Mathematics, 118, 99-113.
[13] Salveson, M. E. (1955), “The assembly line balancing problem,” The Journal of Industrial Engineering, 6, 18-25. [14] www.securities.com/Pubic/company-profile/NG/CHAMPION_BREWERIES_ PLC_en_2119798.html.
APPENDIX 1
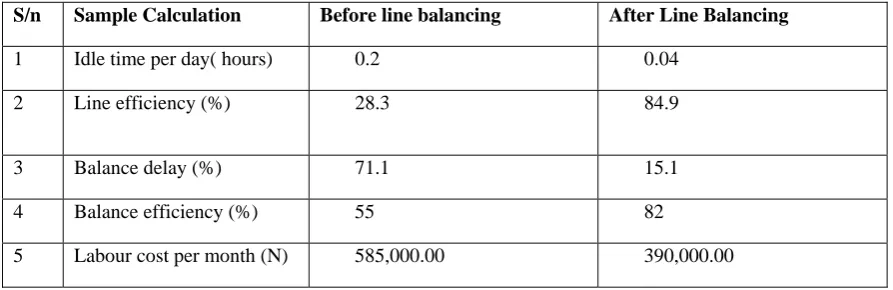
Table below shows the summary result of Champion lager beer Production line:
S/n Sample Calculation Before line balancing After Line Balancing
1 Idle time per day( hours) 0.2 0.04 2 Line efficiency (%) 28.3 84.9
3 Balance delay (%) 71.1 15.1 4 Balance efficiency (%) 55 82
APPENDIX 2
Time study top sheet for Champion lager beer Production line Observed time (sec) Total
time (sec)
Average time (sec)
Ratin g
Basic time (sec)
E 1 2 3 4 5 6 7 8 9 10
1 180 175 165 185 190 180 195 170 160 190 1790 179 110 197
2 264 250 255 260 270 275 268 258 250 272 2622 262.2 100 262
3 280 270 260 285 274 288 266 275 279 265 2733 273.3 100 273
4 456 465 475 486 495 512 520 450 530 535 4924 492.4 110 542
5 200 192 198 220 215 210 195 185 180 175 1970 197 110 217
6 485 476 478 480 481 480 476 480 481 489 4800 480 100 480
7 900 920 915 850 855 895 885 935 930 910 8995 899.5 110 989
8 204 214 228 230 210 198 195 190 192 200 2061 206.1 100 206
9 195 190 200 215 225 185 180 184 220 230 2024 202.4 100 202
10 553 560 543 565 548 568 570 550 560 568 5585 558.5 100 559
11 200 220 190 210 215 195 220 210 230 200 2100 210 100 210
12 4800 4700 4480 4600 4850 4650 4860 4660 4750 4650 47000 4700 100 4700
13 252 242 230 220 255 260 265 270 235 225 2454 245.4 100 245
14 180 185 189 192 178 186 195 198 200 175 1878 187.8 100 189
15 560 554 550 540 565 560 570 555 545 575 5574 557.4 110 613
16 200 216 220 225 195 198 190 187 215 210 2056 205.6 100 206
17 475 450 445 435 460 455 465 430 445 470 4530 453 110 498
18 220 222 218 215 200 210 230 225 235 205 2180 218 100 218
19 460 456 450 465 455 470 445 440 475 485 4601 460.1 110 506
20 190 180 196 184 186 176 170 180 190 195 1847 184.7 100 185
21 254 250 248 240 235 260 262 248 268 238 2503 250.3 100 250
Authors Biography
Emeke Osuya Great is a Master Student in the Department of Mechanical Engineering, University of Uyo, Nigeria, researching on improving productivity through line balancing in bottling companies using heuristic method. He holds a Bachelor Degree in Mechanical Engineering obtained from Enugu State University of Science and Technology, Enugu, Nigeria. His area of research interest is Industrial Engineering and Management.
Aniekan Offiong is a Senior Lecturer in Mechanical Engineering. He holds a Bachelor, Master and Doctorate Degree in Mechanical Engineering obtained from the University of Nigeria, Nsukka in 1989, 1994 and 1997 respectively. His area of research interests is Industrial Engineering and Management.