This may be the author’s version of a work that was submitted/accepted for publication in the following source:
Yu, Vivian, Hu, Wenbiao, Mengersen, Kerrie, Guo, Yuming, Pan, Xi-aochuan, Connell, Desley, &Tong, Shilu
(2011)
Time course of temperature effects on cardiovascular mortality in Bris-bane, Australia.
Heart,97(13), pp. 1089-1093.
This file was downloaded from: https://eprints.qut.edu.au/41969/
c
Consult author(s) regarding copyright matters
This work is covered by copyright. Unless the document is being made available under a Creative Commons Licence, you must assume that re-use is limited to personal use and that permission from the copyright owner must be obtained for all other uses. If the docu-ment is available under a Creative Commons License (or other specified license) then refer to the Licence for details of permitted re-use. It is a condition of access that users recog-nise and abide by the legal requirements associated with these rights. If you believe that this work infringes copyright please provide details by email to [email protected]
Notice:Please note that this document may not be the Version of Record (i.e. published version) of the work. Author manuscript versions (as Sub-mitted for peer review or as Accepted for publication after peer review) can be identified by an absence of publisher branding and/or typeset appear-ance. If there is any doubt, please refer to the published source.
The time course of temperature effects on cardiovascular mortality in
Brisbane, Australia
Weiwei Yu1*, Wenbiao Hu2, Kerrie Mengersen3, Yuming Guo1, Xiaochuan Pan4, Des
Connell5 and Shilu Tong1*
1School of Public Health and Institute of Health and Biomedical Innovation, Queensland
University of Technology, Brisbane, Australia.
2School of Population Health, University of Queensland, Brisbane, Australia.
3 Discipline of Mathematical Sciences, Faculty of Science and Technology, Queensland
University of Technology, Brisbane, Australia.
4School of Public Health, Peking University, Beijing, 100191, China.
5Griffith School of Environment, Griffith University, Brisbane, Australia.
*Corresponding Authors
Dr. Shilu Tong, School of Public Health and Institute of Health and Biomedical Innovation,
Queensland University of Technology, Kelvin Grove, QLD 4059, Australia
Telephone: +61 7 3138 9745
Fax: +61 7 3138 3369
Email: [email protected]
Weiwei Yu, School of Public Health and Institute of Health and Biomedical Innovation,
Queensland University of Technology, Kelvin Grove, QLD 4059, Australia
Telephone: +61 7 3138 8298
Email: [email protected]
ABSTRACT
Objective: To quantify the lagged effects of mean temperature on deaths from cardiovascular
diseases in Brisbane, Australia.
Design: Polynomial distributed lag models were used to assess the percentage increase in
mortality up to 30 days associated with 1°C increase (or decrease) above (or below) the
threshold temperature.
Setting: Brisbane, Australia.
Patients: 22,805 cardiovascular deaths registered between 1996 and 2004.
Main outcome measures: Deaths from cardiovascular diseases.
Results: The results show a longer lagged effect in cold days and a shorter lagged effect in
hot days. For the hot effect, a statistically significant association was observed only for lag 0–
1 days. The percentage increase in mortality was found to be 3.7% (95% CI: 0.4%, 7.1% for
people aged ≥65 years and 3.5% (95% CI: 0.4%, 6.7%) for all ages associated with 1 °C
increase above the threshold temperature of 24°C. For the cold effect, a significant effect of
temperature was found for 10-15 lag days. The percentage estimates for older people and all
ages were 3.1% (95% CI: 0.7%, 5.7%) and 2.8% (95% CI: 0.5%, 5.1%), respectively, with
1 °C decrease below the threshold temperature of 24°C.
Conclusions: The lagged effects lasted longer for cold temperatures, but were apparently
shorter for hot temperatures. There was no substantial difference in the lag effect of
temperature on mortality between all ages and those aged ≥65 years in Brisbane, Australia.
The association between temperature and cardiovascular deaths (CVD) has long been known.
[1] There is an increasing interest in the assessment of this relationship as a response to
climate change resulting from increased emissions of anthropogenic greenhouse gases. [2 3]
There is a broad agreement that the relationship between temperature and CVD is V–, U– or
J–shaped, with optimum temperature corresponding to the lowest point in the temperature–
mortality curve. [4 5] Investigators divide temperature into three linear parts with hot and
cold thresholds. The middle section is constrained to a zero slope and the “V” shaped
association is the special case when cold and hot thresholds are equal. [6]
A lagged effect of temperature on mortality is well known. [7] The mortality of the current
day may be associated with exposure to the temperatures of the current day and of several
previous days. [8 9] Recently, a distributed lag model has been applied to explore the lag
structure of temperature on mortality. Because there is substantial correlation between
temperatures on days close together, investigators have implemented constrained distributed
lag models (CDLM) including stratified, polynomial and smoothing constrained distributed
lag models to overcome this problem. [6] In addition, CDLM could specify some
assumptions on the shape of the distributed lagged effect and provide more precise estimates
for individual lag day.[10 11]
The impact of temperature on mortality varies with population because local geographical
conditions (i.e. vegetation) and adaptation (i.e. housing) are different. Although the lagged
effects of temperature on CVD have been described in Europe and the USA, [6 9 12 13 14 15]
A recent review has pointed out that future research of allowance for the delayed temperature
Hemisphere. Better understanding of these effects will provide useful information for
developing public health intervention programs and risk management that will better target
those most vulnerable to temperature-related CVD.
This study identified the lagged effects of mean temperature on CVD for all ages and those
aged over 65 years (CVD65+) in Brisbane, Australia, which has a typical subtropical climate
in the Southern Hemisphere.
METHODS
Data collection
The data on CVD between January 1996 and December 2004 were obtained from the Office
of Economic and Statistical Research of the Queensland Treasury. The causes of
cardiovascular mortality were classified according to the International Classification of
Diseases, ninth version (ICD-9) before December 1996 and ICD-10 between December 1996
and December 2004 (ICD-9:390–499; ICD-10:I00-I99) .
Daily meteorological data including maximum temperature, minimum temperature and mean
relative humidity (RH) were obtained from the Australian Bureau of Meteorology. Mean
temperature was calculated from maximum temperature and minimum temperature. Air
pollution data including mean daily ozone (O3), nitrogen dioxide (NO2) and particulate matter
with aerodynamic diameter less than 10µm (PM10), recorded in a central monitoring site in
Brisbane, were obtained from the Queensland Environmental Protection Agency.
The use of temperature indicators and thresholds were evaluated through a comparison of
Akaike’s Information Criterion (AIC) for the corresponding models described in our previous
study. [16] Mean temperature was used as an indicator of temperature in this study because
the previous study suggested that it performed better than minimum or maximum temperature
in estimates of temperature-related mortality. [16]
We plotted the graphs of the relationship between current day’s mean temperature and
all-cause mortality based on the multivariable model with a thin plate regression splines function
of temperature with 3 degrees of freedom. There was a “V” shaped association between
temperature and mortality as indicated in fig 1. AIC values were iteratively calculated for
generalised additive models (GAMs) using one degree increment in mean temperature from
20 °C to 30 °C which was selected based on the visual inspection of the plots. The
temperature corresponding to the model with the lowest AIC value was chosen as the
threshold temperature. A similar method has been adopted in many previous studies. [16 17
18]
We applied the GAM model as follows: [19]
. ) * 7 , ( ) 3 , ( ) ( ) ( ) ( 1 1 t t d q d d p j t j H t H C t C t year time s x x s T T Y Log
1Where t refers to the day of the observation; (Yt) denotes the observed daily death counts on
day t; Tt denotes daily mean temperature on day t; C and H were the cold and hot
thresholds; s(.) denotes thin plate smoothing splines; xj denotes the covariates of RH, PM10,
influenza outbreak; α is the intercept term; β and δ are coefficients; and εt is the residual.
Three degrees of freedom were used to smooth the covariates and the time trend was
controlled by smoothing calendar time with 7 degrees of freedom/year according to previous
studies. [9 20 21 22 23]
Polynomial distributed lag models were used to analyse the lagged effects of mean
temperature on CVD for all ages, and those aged over 65 years old (CVD65+), respectively. In
order to overcome the problem of the collinearity, [6 11] the polynomial distributed lag (PDL)
model (q,d) was implemented in equation 1 through the following restriction:
C (Tt C ) / H (Tt H ) 0Tt 1Tt1 ...nTtn
d 0 k k n kn a l , l [ 0 , m ]
2
Where d is the degree polynomial, l is the lags and q is the maximum number of lag days.
[11] The fourth degree polynomial was selected as the sensitivity analyses show no
substantial changes of the results when we applied fifth- or sixth order polynomial. Lags were
chosen up to 30 days because longer-term effects may involve longer lags. [24] We used the
whole dataset to plot 3 dimension of lags, temperature and relative risks in the package of
“dlnm” (Indicated as fig 2). [10 25] We also plotted the relative risks in mortality with one
degree increase (or decrease) of temperature above (or below) the threshold up to 30 lag days
in fig 3.
Sensitivity analyses were conducted with different degrees of freedom (e.g. 4, 5, 6, 8) to
of including and excluding air pollutants variables was also evaluated. No substantial changes
were found in these analyses. For completeness, the air pollution variables were retained in
the final model.
All statistical analyses were performed in the packages of “mgcv” and “dlnm” in R2.11.1
(The R Foundation for Statistical Computing, version 2.11.1 http://cran.r-project.org).
RESULTS
The relationships between mean temperature and CVD mortality in both age groups are
observed as a “V” shape (fig 1). In a total of 3,274 days, there were 22,805 CVD registered in
the study population, among which 91.4% were over 65 years. During the study period, the
average value of the mean, maximum, minimum daily temperatures and RH was 20.1°C,
25.2°C, 15.4°C, and 72.5%, respectively. The mean daily average concentration of PM10,
NO2 and O3 was 16.6 µg/m3, 12.1 ppb and 11.3 ppb, respectively (Table 1).
The polynomial distributed lag model (df=4) demonstrated a clear pattern of longer lagged
effects in the cold temperature range and shorter lagged effects in the hot temperature range
(fig 2). The highest percent increases occurred in CVD on the lag of 10–15 days for cold and
0–1 days for heat (fig 3).
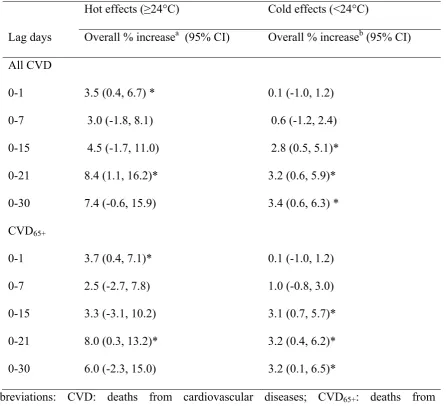
For hot effects, a 1°C of temperature increase above the threshold temperature was associated
with the overall increases of 3.5 % (95% CI: 0.4%, 6.7%) and 3.7 % (95% CI: 0.4%, 7.1%) in
CVD mortality at lags 0-1, respectively, for all ages and those aged over 65 years; and at lags
0-21 days, 8.4 % (95% CI: 1.1%, 16.2%) and 8.0 % (95% CI: 0.3%, 13.2%), respectively.
with the overall increases of 2.8%, 95% CI: 0.5%, 5.1%) and 3.1% (95% CI: 0.7%, 5.7%) in
CVD mortality at lags 0-15, respectively, for all ages and those aged over 65 years (Table 2).
Table 1. Characteristics of mortality, weather condition, and air pollutants in Brisbane
between 1996 and 2004.
Abbreviations: PM10: particulate matter with an aerodynamic diameter less than 10 μm; NO2:
nitrogen dioxide; O3: ozone; SD: standard deviation; CVD: cardiovascular deaths.
Percentile
Mean(SD) Minimum 25% 50% 75% Maximum
CVD
All ages 7.0 (3.0) 0 5 7 9 31
65+ 6.4 (2.8) 0 4 6 8 31
Meteorological measures
24-h mean temperature (°C) 20.1 (4.0) 9.8 16.8 20.5 23.4 31.9
Daily relative humidity (%) 72.5 (10.8) 23.8 67.1 73.6 79.6 98.4
Air pollutant concentration
PM10 (µg/m3) 16.6 (7.9) 2.1 12.1 15.3 19.3 162.1
NO2 (ppb) 12.1 (5.8) 2.0 8 11 16 35.8
Table 2. The lagged effect of temperature on CVD among all ages and over 65 years in
Brisbane from 1996-2004.
Hot effects (≥24°C) Cold effects (<24°C)
Lag days Overall % increasea (95% CI) Overall % increaseb (95% CI)
All CVD
0-1 3.5 (0.4, 6.7) * 0.1 (-1.0, 1.2)
0-7 3.0 (-1.8, 8.1) 0.6 (-1.2, 2.4)
0-15 4.5 (-1.7, 11.0) 2.8 (0.5, 5.1)*
0-21 8.4 (1.1, 16.2)* 3.2 (0.6, 5.9)*
0-30 7.4 (-0.6, 15.9) 3.4 (0.6, 6.3) *
CVD65+
0-1 3.7 (0.4, 7.1)* 0.1 (-1.0, 1.2)
0-7 2.5 (-2.7, 7.8) 1.0 (-0.8, 3.0)
0-15 3.3 (-3.1, 10.2) 3.1 (0.7, 5.7)*
0-21 8.0 (0.3, 13.2)* 3.2 (0.4, 6.2)*
0-30 6.0 (-2.3, 15.0) 3.2 (0.1, 6.5)*
Abbreviations: CVD: deaths from cardiovascular diseases; CVD65+: deaths from
cardiovascular diseases and over 65 ages.
a the percent increase with 1°C of temperature increase above 24°C;
bthe percent increase with 1°C of temperature decrease below 24 °C;
* p<0.05.
DISCUSSION
To our knowledge, this is the first attempt to quantify the lagged effects of temperature on
knowledge gap because the characteristics of climate, adaptation and socio-demographic
patterns in Brisbane are likely to differ from the cities in Europe or the USA. We investigated
lagged effects up to 30 days on all for both cold and hot effects. An approximately two-week
delayed effect was observed for cold temperatures but the apparent hot effects were identified
at lags 0-1 days.
Several hypotheses have been proposed to explain the mechanism of the association between
temperature and cardiovascular mortality. Environmental temperature has an inverse relation
with blood pressure. [26] Cold temperature may exert a direct effect on heart or have an
indirect effect via changes in blood pressure. [27] An increase in plasma cholesterol and
plasma fibrinogen with cold temperatures, coupled with a higher blood pressure, could lead
to thrombosis through haemoconcentration and trigger an acute cardiac event. [13 28 29]
Whereas in hot weather, the heat balance of the body is sustained by enlarging skin vessels
and increased sweating which in turn increases the cardiac work and loss of fluid and salt.
This may lead to haemoconcentration, increased blood viscosity and the risk of thrombosis.
[30 31]
In addition, the different types of CVD may have different sensitivity to higher and lower
temperatures. For example, cold temperature can induce deaths from myocardial ischemia
and acute myocardial infarction, [32 33] while in people with congestive heart failure, the
extra heat load may lead to fatal consequences. [30 31]
In this study, the strongest hot effects were found shortly after exposure among both age
groups. This is in agreement with results from earlier heat-related mortality studies which
previously) in Europe and the USA. [4 28 34 35] Heat seems to induce an acute event in
CVD for advanced forms of illness (e.g. myocardial infarction and stroke) among people who
may be expected to die within a short period. [36] On the contrary, cold-related mortality did
not occur immediately but was observed after approximately a week, persisting for
approximately two weeks among both groups. Other researchers reported similar findings.
[24 37 38 39]
The results illustrate that the relationship between temperature and mortality was similar
amongst all ages and those aged over 65 years. Similarly, other studies also found that the
effect of temperature on CVD did not vary with age. [13 40] Although the ability of older
adults to maintain core temperature is usually compromised, other factors such as living
conditions including being equipped with air conditioning, family and/or social cares as well
as medical support can be modifiers of the effect of temperature on the elderly mortality. [41]
One possible explanation for this finding is that the members of susceptible group of CVD65+
modify their behavioral patterns in cold or hot weather (i.e. spending less time outdoor or
using air conditioning). [13] Another explanation is that the majority of CVD in Brisbane
(91.4%) is experienced by people aged over 65 years.
It has long been known that there is an association between air pollution and increased CVD
mortality in different parts of the world. [42] Pollution exposure leads to disturbances in the
autonomic control of the heart, reflecting altered balance of the sympathetic and
parasympathetic nervous systems. [43] Ambient temperature and air pollution levels often
influence human health on a daily basis. Thus, the actual association between ambient
temperature and mortality should be assessed after adjustment for air pollutants in the models.
This study has three major strengths. Firstly, to our knowledge, this is the first research on the
lag structure of temperature on CVD in a city in the Southern Hemisphere. Secondly, this
study examined both cold and hot lagged effects on mortality up to 30 days for both all ages
and the elderly. Thirdly, the polynomial distributed lag model was applied to overcome the
collinearity of the temperatures on days close together. The sensitivity analyses were used to
evaluate the outputs of polynomial distributed lag model with different degree polynomial.
This study also has two limitations. Firstly, although we found that hot temperature effects
were acute but cold temperature effects lasted longer, the specific lag structures used here
were intended to be representative, not to reflect the exact lag measurements appropriate for
temperature-mortality relationship. Secondly, we only focused on one city, and therefore the
results of this study have limited generalisability.
These findings on the lag structure of temperature on CVD may have implications for
policy-making. The identified lags signify the need for targeted temperature-mortality prevention
efforts. Results on lags for different subpopulation are particularly important for estimating
temperature-related mortality from climate change.
CONCLUSIONS
In summary, the lagged effects of temperature on CVD lasted longer during cold days, but
were shorter during hot days. The cardiovascular vulnerability to temperature stress was
Acknowledgements
We thank Dr. Cizao Ren for his statistical advice and the Office of Economic and Statistical
Research of the Queensland Treasury, Australian Bureau of Meteorology, and the
Queensland Environmental Protection Agency for providing the relevant data.
Competing interests
There are no competing interests.
Funding
This work was partly supported by the Australian Research Council Discovery grant
(#559655). S.T. was supported by an NHMRC Research Fellowship (# 553043), and W.Y.
was supported by a Queensland University of Technology scholarship.
Copyright license Statement
The Corresponding Author has the right to grant on behalf of all authors and does grant on
behalf of all authors, an exclusive license (or non exclusive for government employees) on a
worldwide basis to the BMJ Publishing Group Ltd and its Licensees to permit this article (if
accepted) to be published in HEART editions and any other BMJPGL products to exploit all
REFERENCES
1. Anderson T, Le Riche W. Cold weather and myocardial infarction. Lancet 1970; 1
:291-6.
2. Schwartz J. The effects of particulate air pollution on daily deaths: a multi-city case
crossover analysis. Occup Environ Med 2004;61:956-61.
3. Jean-Bernard Henrotin MZ, Luc Lorgis, Yves Cottin, Maurice Giroud,, Be´jot Y.
Evidence of the role of short-term exposure to ozone on ischaemic cerebral and cardiac
events: the Dijon Vascular Project (DIVA). doi. 10.1136/hrt.2010.200337.
4. Curriero FC, Heiner KS, Samet JM, et al. Temperature and mortality in 11 cities of the
eastern United States. Am J Epidemiol 2002;155:80-7.
5. Kassomenos P, Gryparis A, Samoli E, et al. Atmospheric circulation types and daily
mortality in Athens, Greece. Environmental Health Perspectives 2001;109:591-6.
6. Armstrong B. Models for the relationship between ambient temperature and daily
mortality. Epidemiology 2006;17:624-31.
7. Rogot E, Blackwelder WC. Associations of cardiovascular mortality with weather in
Memphis, Tennessee. Public Health Reports 1970;85:25.
8. Bi P, Parton KA, Wang J, et al. Temperature and direct effects on population health in
Brisbane, 1986-1995. J Environ Health 2008;70:48-53.
9. Anderson BG, Bell ML. Weather-related mortality: how heat, cold, and heat waves
affect mortality in the United States. Epidemiology 2009;20:205-13.
10. Gasparrini A, Armstrong B. Time series analysis on the health effects of temperature:
Advancements and limitations. Environ Res 2010;110:633-8.
11. Schwartz J. The Distributed Lag between Air Pollution and Daily Deaths.
12. Hajat S, Armstrong BG, Gouveia N, et al. Mortality displacement of heat-related
deaths - A comparison of Delhi, Sao Paulo, and London. Epidemiology 2005;16:613-20.
13. Carder M, McNamee R, Beverland I, et al. The lagged effect of cold temperature and
wind chill on cardiorespiratory mortality in Scotland. Occup Environ Med
2005;62:702-10.
14. Braga ALF, Zanobetti A, Schwartz J. The time course of weather- related deaths.
Epidemiology 2001;12:662-7.
15. Bhaskaran K, hajat S, Haines A, et al. Effects of ambient temperature on the incidence
of myocardial infarction. Heart 2009;95: 1760-9.
16. Yu W, Vaneckova P, Mengersen K, et al. Is the association between temperature and
mortality modified by age, gender and socio-economic status? Sci Total Environ
2010;408:3513-8.
17. Chung JY, Honda Y, Hong Y-C, et al. Ambient temperature and mortality: An
international study in four capital cities of East Asia. Sci Total Environ 2009;408:390-6.
18. Kim H, Ha JS, Park J. High temperature, heat index, and mortality in 6 major cities in
South Korea. Arch Environ Occup Health 2006;61:265-70.
19. Dominici F, McDermott A, Hastie TJ. Improved semiparametric time series models of
air pollution and mortality. J Am Stat Assoc 2004;99:938-49.
20. McMichael AJ, Wilkinson P, Kovats RS, et al. International study of temperature, heat
and urban mortality: the 'ISOTHURM' project. Int J Epidemiol 2008;37:1121-31.
21. Hajat S, Kovats RS, Lachowycz K. Heat-related and cold-related deaths in England
and Wales: who is at risk? Occup Environ Med 2007;64:93-100.
22. Stafoggia M, Schwartz J, Forastiere F, et al. Does temperature modify the association
between air pollution and mortality? A multicity case-crossover analysis in Italy. Am J
23. Filleul L, Cassadou S, Medina S, et al. The relation between temperature, ozone, and
mortality in nine French cities during the heat wave of 2003. Environmental Health
Perspectives 2006;114:1344-7.
24. Pattenden S, Nikiforov B, Armstrong BG. Mortality and temperature in Sofia and
London. J Epidemiol Community Health 2003;57:628-33.
25. Gasparrini A, Armstrong B, Kenward MG. Distributed lag non-linear models. Stat
Med 2010;29:2224-34.
26. Kunes J, Tremblay J, Bellavance F, et al. Influence of environmental temperature on
the blood pressure of hypertensive patients in Montréal. Am J Hypertens 1991;4:422-6.
27. Pell JP, Cobbe SM. Seasonal variations in coronary heart disease. QJM 1999;92:689.
28. Medina-Ramón M, Schwartz J. Temperature, temperature extremes, and mortality: a
study of acclimatisation and effect modification in 50 US cities. Occup Environ Med
2007;64:827-33.
29. Ballester F, Corella D, Perez-Hoyos S, et al. Mortality as a function of temperature, a
study in Valencia, Spain, 1991-1993. International Journal of Epidemiology
1997;26:551-61.
30. Keatinge WR, Coleshaw SRK, Easton JC, et al. Increased platelet and red cell counts,
blood viscosity, and plasma cholesterol levels during heat stress, and mortality from
coronary and cerebral thrombosis. The American Journal of Medicine 1986;81:795-800.
31. Näyhä S. Environmental temperature and mortality. Int J Circumpolar Health
2005;64:451-8.
32. Hong YC, Rha JH, Lee JT, et al. Ischemic stroke associated with decrease in
33. Stewart S, McIntyre K, Capewell S, et al. Heart failure in a cold climate: Seasonal
variation in heart failure-related morbidity and mortality. J Am Coll Cardiol
2002;39:760-6.
34. Baccini M, Biggeri A, Accetta G, et al. Heat effects on mortality in 15 European cities.
Epidemiology 2008;19:711-9.
35. Analitis A, Katsouyanni K, Biggeri A, et al. Effects of cold weather on mortality:
results from 15 European cities within the PHEWE project. Am J Epidemiol
2008;168:1397-408.
36. Muggeo VM, Hajat S. Modelling the non-linear multiple-lag effects of ambient
temperature on mortality in Santiago and Palermo: a constrained segmented distributed
lag approach. Br Med J 2009;66:584-91.
37. Goodman PG, Dockery DW, Clancy L. Cause-Specific Mortality and the Extended
Effects of Particulate Pollution and Temperature Exposure. Environmental Health
Perspectives 2004;112:179-85.
38. Gouveia N, Hajat S, Armstrong B. Socioeconomic differentials in the
temperature-mortality relationship in Sao Paulo, Brazil. Int J Epidemiol 2003;32:390-7.
39. Braga ALF, Zanobetti A, Schwartz J. The effect of Weather on restiratory and
cardiovascular deaths in 12 U.S. cities. Environ Health Perspect 2002;110:859-63.
40. Revich B, Shaposhnikov D. Temperature-induced excess mortality in Moscow, Russia.
Int J Biometeorol 2008;52:367-74.
41. Stafoggia M, Forastiere F, Agostini D, et al. Factors affecting in-hospital heat-related
mortality: a multi-city case-crossover analysis. J Epidemiol Community Health
2008;62:209-15.
43. Bhaskaran K, Hajat S, A H, et al. Effects of air pollution on the incidence of
myocardial infarction. Heart 2009:1746-59.
44. Basu R. High ambient temperature and mortality: a review of epidemiologic studies
Figure legends
Figure 1: The relationships between mean temperature and CVD among all ages and those
aged over 65 years in Brisbane, 1996–2004.
Figure 2. The relationships between mean temperature and cardiovascular deaths in Brisbane,
1996-2004.
Figure 3. The relative risks in CVD with 1°C of mean temperature increase (or decrease) in