Using Multilevel Confirmatory Factor
Analysis To Study Student
Well-Being In Thailand
Thomrat Siriparp, Ph.D. Student, Chulalongkorn University, ThailandDuangkamol Traiwichitkhun, Chulalongkorn University, Thailand Sirichai Kanjanawasee, Chulalongkorn University, Thailand
ABSTRACT
Multilevel confirmatory factor analysis was used to assess the factor structure of the six-factor student well-being scale at between- and within-class levels. A total of 2,707 Matthayom 4-6 students (equivalent to grades 10-12) from 71 classrooms (785 male and 1,922 female) completed this 54-items student well-being scale. Results showed that a single latent factor structure was acceptable fitted at between and within class levels. The reliability estimates of the six factors (Positive attitudes and emotions towards school, Enjoyment in school, Positive academic self-concept, (Absence of) Social problems in school, (Absence of) School worries, and (Absence of) Physical complaints) were 0.73, 0.38, 0.22, 0.13, 0.14, and 0.02, respectively, at the student level, whereas these estimates were 0.39, 0.44, 0.48, 0.61, 0.65, and 0.82, respectively, at the classroom level.
Keywords: Student Well-Being; Multilevel Structural Equation Modeling ; Multilevel Confirmatory Factor Analysis for Thai Students
INTRODUCTION
n Thailand, the importance of considering student well-being while forming education policies was recently pointed out. In accordance with national policy, the quality of students’ performance should be determined by not only cognitive but also affective criteria. Thus, Thai students are expected to excel academically, maintain good conduct in school, and be satisfied with their school lives. Although many research tools (e.g., standardized tests and achievement tests) are available to assess how and to what extent students perform academically, very little is known about the concept of student happiness or, more academically, “student well-being”. Borrowed from the psychological concept of well-being, this concept provides a clear and concrete basis for this study. Student well-being is a construct that describes an individual’s perception with regard to self-assessment of his/her life. It is defined as “an emotional experience characterized by the dominance of positive feeling and cognitions towards school, persons in school and the school context in comparison to negative feelings and cognitions towards school life. Well-being in school represents subjective, emotional and cognitive evaluations of school reality and can be seen as a misbalance of positive and negative aspects in favor of positive aspects” (Hascher, 2003, p.129 as cited in Hascher, 2008). Within the educational context, student well-being can create a positive learning environment that enables students to succeed academically and socially in school. Although it is not a direct school outcome in the way an achievement is, student well-being is required to create a positive bias for the learning experience in an education setting.
To examine the structure of the concept of student well-being, researchers usually employ confirmatory factor analysis for an entire sample (i.e., they pool all respondents from all classrooms), ignoring class-level variances in the factor structure. However, the conventional confirmatory factor analysis with its assumption of independent and identically distributed observations cannot be applied to this pooled sample, because students are clustered in the classroom. Thus, the method appropriate for this study is multilevel confirmatory factor analysis
368 http://www.cluteinstitute.com/ © 2012 The Clute Institute (MCFA), which fits the factor structure at both individual and class levels simultaneously and, further, gives lower bias for parameter estimation. Other advantages of this method include robust estimation with even unbalanced cases (Muthén, 1991, 1994; Hox & Maas, 2001).
Because of the complexity of multilevel data, guidelines to simplify the multilevel modeling process are needed. Muthén (1994) suggests conducting four initial steps before applying MCFA: applying a conventional factor analysis on the sample’s total covariance matrix (ST), estimation of between variation, estimation of within structure (SPW), and estimation of between structures (SB).
The advantages of Muthén’s procedures are that they allow:
examination of various aspects of student well-being structures in single-level modeling, two-level modeling while ignoring clustered data, and two-level modeling with clustered data;
exploration of the possible ideal of the modeling; and
reduction of the technical problems regarding convergence, particularly the non-positive definite ones.
The two research questions in this study are:
Is the factor structure underlining student well-being at the student level similar to or different from the factor structure at the class level?
What is the reliability of the scores of student well-being at student and class levels?
METHOD
Sample
A sample of 2,707 Matthayom 4-6 students (equivalent to Grade 10-12) attending public schools run by the Office of Basic Education Commissions, Ministry of Education, Thailand participated in this study. A multi-stage sampling strategy based on regional and provincial criteria was used to select them. A sample of 36 schools was drawn from a database and 71 classes were selected from among them. Finally, data of all 2,707 students in those classes were used to perform the analysis.
Questionnaire on student well-being
A self-evaluation questionnaire developed by Hascher (2008) to examine student well-being within the school context was used. The questionnaire used a five-point Likert scale, ranging from 1 “strongly disagree” to 5 “strongly agree,” and assessed the following three positive and three negative dimensions: Positive attitudes and emotions towards school (9 items), for example, “I like to go to school”; Enjoyment in school (9 items), for example, “I have fun with the activities in class”; Positive academic self-concept (9 items), for example, “I like to share my opinions when teachers ask for it”; Social problems in school ( 9 items), for example, “I do not need friends in school”; School worries (9 items), for example, “Have you been worried in the past few weeks because of people whom you are dealing with”;Physical complaints (9 items), for example, “In the past few weeks, have you been to the nursing office?” The questionnaire was written in Thai. It was reviewed and approved by experts in the field of education and psychology before being administered.
Data analysis
RESULTS
Descriptive Statistics
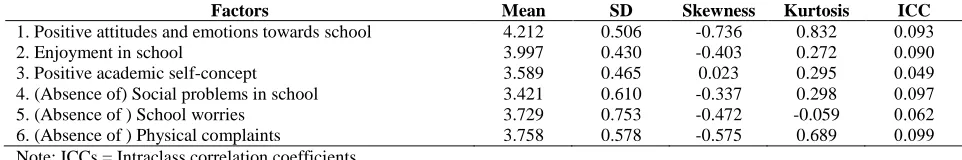
Item means ranged from 3.421 (SD = 0.610) for Social problems in school to 4.212 (SD = 0.506) for Positive attitudes and emotions towards school. Responses were assumed to be normally distributed, with skewness ranging from -0.736 to 0.023 and kurtosis values ranging from -0.059 to 0.832 (Table 1).
Multilevel Confirmatory Factor Analysis (MCFA)
Because of the complexity of the multilevel structure, the literature recommends conducting the aforementioned initial four-step procedure before applying MCFA. First, a conventional factor analysis with a single-factor model for the total sample covariance matrix is conducted to examine model specification and rough fit. Second, between-class variation is estimated using intraclass correlations (ICC) to ensure the amount of student well-being variation between classes. Note that ICCs range from 0 to 1, with the number close to 0 indicating less between-class variance. Third, a single factor structure using the pooled within-covariance matrix is estimated to explore individual-level variation. Fourth, a single factor structure using the between-class correlation matrix is estimated in order to explore the class-level structure (Muthén, 1994).
Initial analysis in four steps
Conventional factor analysis of ST
All estimates are significant at the p < .01 level. Model fit indices are 2 (7) = 12.36, p < .01, CFI = 1.000, TLI = 1.000, RMSEA = 0.017, and SRMR = 0.003 (Table 2). The result of the ST analysis shows a good fit. Additionally, all factor coefficients (loadings) were significantly different from zero (p < .01). Positive attitudes and emotions towards school had the highest loading (b = 0.43), followed by School worries (b = 0.30), Enjoyment in school (b = 0.28), Social problems in school (b = 0.24), Positive academic self-concept (b = 0.22), and Physical complaints (b = 0.11). Because the hierarchical nature of the data was ignored in these steps, using the fit indices and estimated parameters as part of the result is misleading. However, they do provide an indication of the model structure at the within level. The next step is to assess the between-class level information contained in the total matrix.
Estimation of between variations
The proportion between variations or ICCs of the six factors of student well-being ranged from 0.062 to 0.099, meaning that 6.2 to 9.9% of the variance of the variables results from between-group variation (Table 1). Physical complaints had the greatest between-class variability (ICC = 0.099), followed by Social problems in school (ICC = 0.97), Positive Attitudes and Emotions toward school (ICC = 0.93), Enjoyment in school (ICC = 0.090), School worries (ICC = 0.062) and Positive academic self-concept (ICC = 0.049). These values indicated that there was sufficient between-class variability to ensure the multilevel analysis in the next step.
Estimation of within structure
370 http://www.cluteinstitute.com/ © 2012 The Clute Institute Estimation of between structures
The between structure is investigated in this step. The correlation matrix and an exploratory factor analysis are employed. A one-factor model shows that the eigenvalues range from 0.049 to 4.062 with the estimated loading ranged from 0.557 to 0.945. Thus, this model could be an acceptable fit for one-factor modeling of student well-being.
Multilevel confirmatory factor analysis
Results of the two-level confirmatory factor analysis indicated a good fit of the model to the data. Those of the chi-square test were 17.473 with 12 degrees of freedom. The 2 (df) was less than 2:1, which indicates a good fit. Moreover, according to other fit criteria, the RMSEA of 0.013 and CFI of 0.998 indicated an acceptable fit overall. The RMSEA fit indices at each level indicate that the fit at the student-level (within) part of the model was better than it was at the classroom-level (between) part (SRMRW = 0.013 vs. SRMRB = 0.039; see Table 2 for measures of fit).
At student level (within), all factor coefficients (loadings) were significantly different from zero (p < .01). Positive attitudes and emotions towards school had the highest loading (b = 1.00), followed by School worries (b = 0.67), Enjoyment in school (b = 0.61), Positive academic self-concept (b = 0.52), Social problems in school (b = 0.51), and Physical complaints (b = 0.20). The within reliabilities were ranged from 0.02 to 0.73 (Table 3 and Figure 1).
At the classroom level (between), all factor coefficients (loadings) were significantly different from zero (p < .01). Physical complaints (b = 1.00) had the highest loading, followed by School worries (b = 0.91), Social problems in school (b = 0.90), Positive attitudes and emotions towards school (b = 0.57), Enjoyment in school (b = 0.51), and Positive academic self-concept (b = 0.43). Table 3 displays the unstandardized factor loadings, standard errors, significant test, and reliabilities for both student and classroom levels. The between reliabilities ranged from 0.39 to 0.82 (Table 3 and Figure 1).
Table 1. Descriptive statistics for student well-being (SWB) (n = 2,707)
Factors Mean SD Skewness Kurtosis ICC
1. Positive attitudes and emotions towards school 4.212 0.506 -0.736 0.832 0.093
2. Enjoyment in school 3.997 0.430 -0.403 0.272 0.090
3. Positive academic self-concept 3.589 0.465 0.023 0.295 0.049
4. (Absence of) Social problems in school 3.421 0.610 -0.337 0.298 0.097
5. (Absence of ) School worries 3.729 0.753 -0.472 -0.059 0.062
6. (Absence of ) Physical complaints 3.758 0.578 -0.575 0.689 0.099
Note: ICCs = Intraclass correlation coefficients
Table 2. Summary of model fit for each model
Model 2 (df) P CFI TLI RMSEA SRMR
Conventional CFA 12.36 (7) 0.0890 1.000 1.000 0.017 0.003
Pooled-within 11.449 (7) 0.1202 1.000 0.999 0.015 0.005
MCFA 17.473 (12) 0.1327 0.998 0.996 0.013 W: 0.013/B: 0.039
Note: CFI = norm comparative fit index; RMSEA = root mean square error of approximation; SRMR = standardized root mean square residual
Table 3. Untandardized coefficients for student well-being factors within- and between-class levels Factors Within Between
b SE T R2 b SE t R2
1. Positive attitudes and emotions towards school 1.00 - - 0.73 0.57 0.15 3.76** 0.39
2. Enjoyment in school 0.61 0.02 25.73** 0.38 0.51 0.12 4.38** 0.44
Figure 1. Multilevel confirmatory factor model for student well-being
Note: AFF = Positive attitudes and emotions towards school; ENJ = Enjoyment in school; SEL = Positive academic self-concept; SOC = (Absence of) Social problems in school; WOR = (Absence of) School worries; PHY = (Absence of) Physical complaints;
W = within level; B = between level.
CONCLUSION
The application of MCFA provided two significant points of view with respect to our research questions. First, the factor structures for student well-being between student and class levels differ. While each individual student tended to mention his/her well-being differently in terms of his/her attitude and feelings, groups/classes of students tended to mention their physical health instead. Second, the reliabilities of student well-being factors varied differently between student and class levels, implying that the explained variance components of student well-being at each level were different as well. These two results were consistent and broaden our perspective on how research should examine student well-being at student and class levels.
AUTHOR INFORMATION
Thomrat Siriparp is a PhD candidate in the department of educational research and psychology at Chulalongkorn University (Thailand). Her current research interests include multilevel structural equation modeling and mediation testing. E-mail: [email protected] (Corresponding author)
Duangkamol Traiwichitkhun, PhD, is associate professor of educational research and psychology at Chulalongkorn University. Her research interests include measurement and evaluation, and curriculum research and development. E-mail: [email protected]
Sirichai Kanjanawasee, PhD, is a professor of educational research and psychology at Chulalongkorn University. His research interests include advanced measurement and evaluation theories, and multilevel modeling. E-mail: [email protected]
REFERENCES
1. Hascher, T. (2008). Quantitative and qualitative research approaches to assess student well-being.
International Journal of Educational Research, 47, 84–96.
372 http://www.cluteinstitute.com/ © 2012 The Clute Institute 3. Hox, J. J., & Maas, C. J. (2001). The accuracy of multilevel structural equation modeling with
pseudobalanced groups and small samples. Structural Equation Modeling, 8(2), 157-174.
4. Muthén, B. O. (1991). Multilevel factor analysis of class and student achievement components. Journal of Educational Measurement, 28(4), 338–354.
5. Muthén, B. O. (1994). Multilevel covariance structure analysis. Sociological Methods & Research, 22(3), 376–398.