R E S E A R C H A R T I C L E
Open Access
Reliability and validity of a questionnaire for
self-assessment of complete dentures
Yuriko Komagamine, Manabu Kanazawa
*, Yoshinori Kaiba, Yusuke Sato and Shunsuke Minakuchi
Abstract
Background:Demand for complete denture treatment is expected to rise over several decades. However, to date, no questionnaire on complete dentures, as evaluated by edentulous patients, has been shown to be reliable and valid. This study sought to assess the reliability and validity of Patient’s Denture Assessment (PDA), which provides a multidimensional evaluation of dentures among edentulous patients.
Methods:Patients, who had new complete dentures fabricated at the University Hospital of Dentistry, Tokyo Medical and Dental University through 2009 to 2010, were enrolled. The reliability of the PDA was determined by examining internal consistency and test-retest reliability. Internal consistency for all of the question items and the six subscales was measured using Cronbach’sαand average inter-item correlation coefficients among 93 participants. For 33 of these participants, test-retest reliability was determined at a 2 month-interval using the interclass correlation coefficients (ICCs) and 95% confidence interval for the summary scores and the six subscale scores. The PDA was validated in 93 participants by examining the difference in the summary score and the six subscale scores of the PDA before and after replacement with new dentures by the paired t-test. Ability to detect change was also tested in 93 patients using effect size.
Results:The Cronbach’sαfor the PDA ranged from 0.56 to 0.93. The average inter-item correlation coefficients ranged from 0.28 to 0.83. ICCs for the PDA ranged from 0.37 to 0.83. The paired t-test showed a significant
difference between the summary score and the six subscale scores before and after replacement with new dentures (p< 0.05) and the effect size was 0.97.
Conclusions:The PDA demonstrated good reliability by assessing internal consistency and test-retest reliability. In addition, the PDA demonstrated good validity by assessing discriminant validity. Thus, the PDA could help dentists obtain a detailed understanding of the patients’perceptions in using their dentures.
Keywords:Complete denture, Questionnaire, Edentulous, Self-assessment, Reliability, Validity
Background
In recent years, the National Epidemiological Survey data have revealed a decline in the proportion of edentulous people. However, given the simultaneous decline in the per-centage of edentulous people and increase in the number of older people, the number of people requiring complete dentures in the United States is predicted to increase over the next 20 years [1]. Thus, the need for complete denture treatment is likely to remain substantial [2].
Patient-reported outcome measures, as recommended by the United States Food and Drug Administration, is a
growing area within research [3], and the impact of treatment on patients has been attracting attention. This is also the case for prosthetic treatment: the success of complete denture treatment does not depend on the as-sessment by the dentist, but on patient self-asas-sessment results. The patient self-assessment is an inexpensive and economical method with which to measure the suc-cess of the denture and can yield a large amount of data in a short period of time.
Patient satisfaction is rated using a questionnaire that is assessed via a Likert scale or the 100-mm visual analogue scale (VAS). Some patient satisfaction evalu-ation methods depend on only one question [4,5], and it is likely that such evaluations may not be reliable. For
* Correspondence:[email protected]
Gerodontology and Oral Rehabilitation, Graduate School of Medical and Dental Sciences, Tokyo Medical and Dental University, Yushima, Bunkyo-ku, Tokyo 113-8549, Japan
example, in dissatisfied patients, it is not known whether the dissatisfaction was caused by the lower or upper denture. In addition, patient satisfaction is usually not based on one factor, but on many factors, such as taste, ease of chewing, comfort, retention, pain, fit and aesthet-ics. Taking those factors into consideration, other evalu-ation methods have been introduced that comprise several questions to permit the multidimensional evalu-ation of patient satisfaction [6-9]. Limitevalu-ations of these questionnaires are the lack of reliabilities and validities. On the other hand, in prosthetic treatment, one of the most widely used evaluation tools for measurements of oral health related quality of life (OHRQoL) is the Oral Health Impact Profile (OHIP). This instrument has been translated into many languages across the globe [10-16], which has allowed for comparisons of reliability and val-idity between OHIP in different regions. The OHIP as-sesses the impact of oral conditions on the quality of life using a frequency estimation of the disruption, such as dysfunction, discomfort and disability, in daily activities. Thus, negative-oriented measures composing the OHIP may be unable to capture positive changes in patients with no negative impacts recorded at baseline because the absence of a negative does not necessarily imply a positive [17].
Consequently, it is necessary to establish a multidi-mensional patient self-assessment specific to dentures that can capture both positive and negative denture-related effects and have reliability and validity. We first developed a questionnaire for the self-assessment of complete dentures [18] referred to as the Patient’s Den-ture Assessment (PDA). The PDA was developed from an original questionnaire that is a subjective assessment about oral, physical, and psychological conditions on daily functioning. In the PDA, some question items con-tain quality of life similar to the OHIP, but the PDA is absolutely assessment of dentures in themselves. More-over, the PDA is the bipolar design, which could capture both negative and positive impacts on the patients. The conceptual of framework established for the PDA is in the following. The purposes of complete denture treat-ment are recoveries of three major functions; chewing, speech, and aesthetics. This three functions influence acceptances and expectations for dentures, which have impacts on patients’perceptions, consciousness and feel-ings of dentures. The PDA assesses these impacts of complete denture treatment on the patients’perceptions, consciousness and feelings of dentures. From the clinical point of view, the PDA will be used for the diagnosis, prognosis, and comparing the efficacy of prosthetic treatment. For example, if the association between the PDA scores before treatment and outcomes after treat-ment, such as numbers of denture adjusttreat-ment, length of denture survival and denture survival rate is assessed,
the difficulties of treatments and longevities of dentures as prognosis will be predictable from the PDA scores at pre-treatment diagnosis. However, at this point, reliabil-ity and validreliabil-ity of the PDA has not been confirmed yet. Thus, the purpose of this study is to demonstrate that the PDA was a reliable and valid instrument for applica-tion in clinical settings.
Methods Participants
A total of 122 edentulous patients wearing upper and lower complete dentures and requiring new complete dentures were enrolled (55 men, 67 women; mean age, 74.4 years). All participants were recruited from under-graduate student treatment clinics at the University Hos-pital of Dentistry, Tokyo Medical and Dental University through 2009 to 2010. All participants could read and respond in Japanese. Of these 122 participants, 28 were excluded from the study as they did not complete the questionnaire, and one participant was unable to attend the study because of severe general condition. The remaining 93 participants were included in the analysis of internal consistency, discriminant validity and ability to detect change (Table 1). From the 93 participants, 33 participants were randomly selected to investigate test-retest reliability. The sample size and characteristics of the participants in each investigation are presented in Table 2. All participants gave their informed consent prior to enrolment. The study was approved by the insti-tutional ethics committee of Tokyo Medical and Dental University (approval number 232). The patients were treated by undergraduate students under faculty staff supervision from the first visit. The technique for fabri-cating complete dentures involved primary and second-ary impressions, recording of jaw relationships using occlusal rims, Gothic arch tracing, one or two trial inser-tions, and delivery of the new dentures. After delivery of the new complete dentures, adjustments to the dentures were made until a prosthodontist judged that further ad-justment was unnecessary.
Development of the patient denture assessment (PDA)
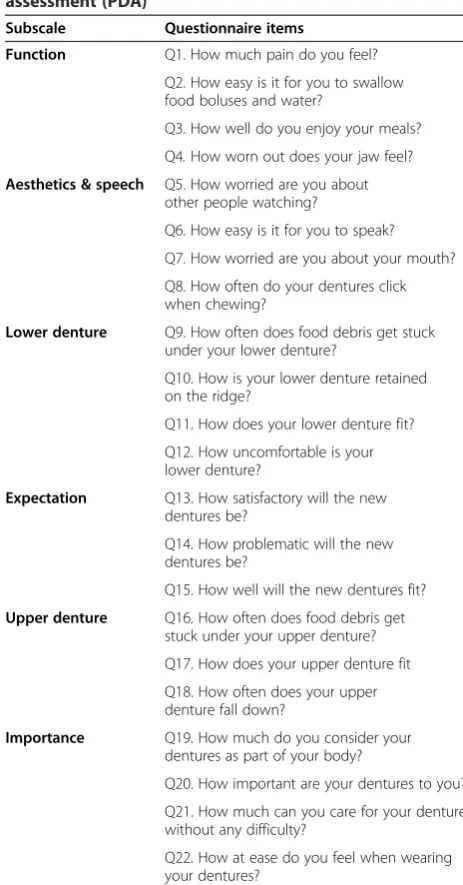
added. Throughout the process of developing the PDA, the questionnaire comprised 22 question items covering six factors, which were classified as ‘function’, ‘lower denture’, ‘upper denture’, ‘expectation’, ‘aesthetic and speech’and‘importance’. Table 3 represents 22 question items of the PDA, which were translated from Japanese to English for this article. It hasn’t been translated ac-cording to the guideline of translation. In the question-naire, each item was measured using a 100-mm VAS, which consisted of a horizontal 100-mm line anchored by words representing the worst situation at the left ex-tremity of the scale and words representing the best situation at the right extremity.
Clinical measurements
All 93 participants were instructed to complete the PDA twice: before replacement (Before-1 PDA), and on com-pletion of denture adjustment after replacement (After PDA). An additional PDA was performed before replace-ment (Before-2 PDA) for 33 participants randomly
selected among the 93 participants. The interval be-tween Before-1 PDA and Before-2 PDA was two months. Each subscale score was calculated by summing the values of the question items corresponding to each subscale. Moreover, the summary score of all the ques-tion items was calculated.
Reliability and validity
Internal consistency of the PDA was assessed by Cronbach’s
α and average inter-item correlation. Before-1 PDA scores from the 93 participants were used for an assess-ment of internal consistency. Cronbach’sαfor summary score of 0.70-0.80 are considered satisfactory for a reli-able comparison between groups and more than 0.90 are required for clinical usefulness of the instrument [19]. The test-retest reliability was assessed by deter-mining the interclass correlation coefficients (ICCs) and 95% confidence interval of the test-retest difference for 33 participants. Factor analysis is reported in previous study [18]. To evaluate discriminant validity, we assessed the difference between Before-1 PDA and After PDA scores in 93 patients using a paired t-test. Values of p< 0.05 were considered significant for the paired t-test.
Ability to detect change
Effect size was used to investigate the ability to detect change to the treatment. Ability to detect change to the questionnaire was assessed in 93 participants by calcu-lating the effect size. Effect size is one of the most com-monly used methods for interpreting a change in scores [20]. The effect size was evaluated by calculating the dif-ference between the means of the summary scores of Before-1 PDA and After PDA and dividing the difference by the standard deviation (SD) of the summary scores of Before-1 PDA [21]. To facilitate decisions regarding the clinical importance of the observed change in the meas-ure, some benchmarks have been proposed; a value of 0.2 or less, 0.5 and 0.8 or greater has been proposed to represent low, moderate and high ability to detect change, respectively [22].
Statistical analysis
Internal consistency of the PDA was assessed by Cronbach’s
α and average inter-item correlation. Test-retest reliability
Table 1 Distribution of patients’previous and current denture status according to upper and lower dentures (N = 93)
Variable Upper denture Lower denture Period of
edentulousness
<1 year 11 21
1 year≤3 years 2 4
3 years≤5 years 12 6
5 years≤10 years 13 12
≥10 years 55 50
Number of previous complete dentures
0 3 11
1–3 74 65
4–6 12 13
≥7 4 4
Time since current complete dentures
<0.5 years 28 27
0.5 years≤10 years 33 35
≥10 years 32 31
Table 2 Sample size and characteristics of the participants for each investigation
Type of investigation N (male/female) Mean age (years) Year of enrolment
Internal consistency 93 (44/49) 75.0 2009 & 2010
Test-retest reliability 33 (15/18) 74.5 2009
Discriminant validity 93 (44/49) 75.0 2009 & 2010
was assessed by the interclass correlation coefficients (ICCs) and 95% confidence interval. Discriminant validity was assessed by a paired t-test between PDA scores before and after treatment. Values of p< 0.05 were considered significant for the paired t-test. Ability to detect change was investigated by effect size. SPSS version 16.0 (SPSS Japan, Tokyo, Japan) was used for all analyses.
Results
Table 4 provides the mean and SD of the Before-1 and After PDA scores. It’s notable that the some question items in the ‘importance’subscale exhibited a‘ceiling ef-fect’. In addition, the ‘lower denture’ and ‘expectation’
subscales had lower means for the Before-1 PDA scores than that seen with the other subscales.
Reliability and validity
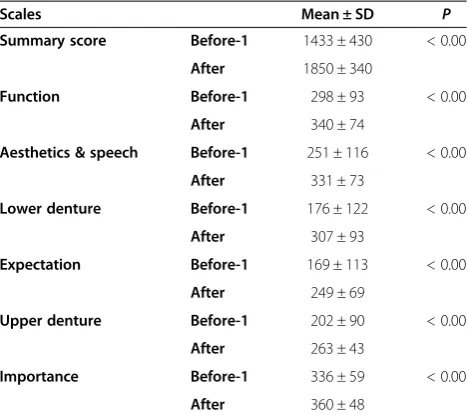
The Cronbach’s α score for all question items was 0.91 and fulfilled the criterion for clinical usefulness. For the six subscales, it ranged from 0.56 to 0.93. The average inter-item correlation for all question items was 0.59 and for the six subscales, it ranged from 0.28 to 0.83 (Table 5). The ICC of the summary score was 0.78 and the ICCs of the six subscales ranged from 0.37 to 0.83 (Table 6). The results of the assessment of discriminant validity are presented in Table 7. The paired t-test showed a significant difference between the Before-1 PDA and After PDA scores.
Ability to detect change
The mean summary scores changed from 1433 for the Before-1 PDA score to 1850 for the After PDA score.
Table 3 Question items of the patient’s denture assessment (PDA)
Subscale Questionnaire items
Function Q1. How much pain do you feel? Q2. How easy is it for you to swallow food boluses and water?
Q3. How well do you enjoy your meals?
Q4.How worn out does your jaw feel?
Aesthetics & speech Q5. How worried are you about other people watching?
Q6. How easy is it for you to speak?
Q7. How worried are you about your mouth?
Q8. How often do your dentures click when chewing?
Lower denture Q9. How often does food debris get stuck under your lower denture?
Q10. How is your lower denture retained on the ridge?
Q11. How does your lower denture fit?
Q12. How uncomfortable is your lower denture?
Expectation Q13. How satisfactory will the new dentures be?
Q14. How problematic will the new dentures be?
Q15. How well will the new dentures fit?
Upper denture Q16. How often does food debris get stuck under your upper denture?
Q17. How does your upper denture fit
Q18. How often does your upper denture fall down?
Importance Q19. How much do you consider your dentures as part of your body?
Q20. How important are your dentures to you?
Q21. How much can you care for your dentures without any difficulty?
Q22. How at ease do you feel when wearing your dentures?
Table 4 Mean values and standard deviations (SDs) for before-1 and after patient’s denture assessment (PDA) scores (N = 93)
Subscale Items Mean ± SD
Before-1 After
Function Q1 74 ± 30 83 ± 24
Q2 78 ± 24 87 ± 18
Q3 72 ± 28 83 ± 23
Q4 74 ± 29 87 ± 21
Aesthetics & speech Q5 67 ± 34 88 ± 20
Q6 66 ± 33 85 ± 22
Q7 58 ± 37 86 ± 21
Q8 60 ± 37 72 ± 31
Lower denture Q9 41 ± 35 70 ± 30
Q10 45 ± 34 77 ± 28
Q11 43 ± 35 82 ± 23
Q12 47 ± 36 79 ± 26
Expectation Q13 64 ± 38 87 ± 20
Q14 51 ± 40 80 ± 28
Q15 54 ± 42 82 ± 27
Upper denture Q16 60 ± 36 83 ± 24
Q17 71 ± 33 89 ± 18
Q18 72 ± 33 91 ± 17
Importance Q19 88 ± 23 90 ± 20
Q20 95 ± 11 97 ± 6
Q21 75 ± 26 84 ± 21
Q22 79 ± 27 88 ± 18
The SD of the summary scores of the Before-1 PDA was 430 and the effect size for the summary score was 0.97.
Discussion
In the present study, both the reliability assessed by in-ternal consistency and test-retest reliability and the val-idity assessed by discriminant valval-idity of the PDA were satisfactory. Therefore, the PDA is suitable for use in clinical settings.
The internal consistency of the PDA was assessed using two measures: average inter-item correlation and Cronbach’sα. Cronbach’sαis computed from the SDs of the question items and the SD of the total scores. As the difference between the SDs for question items of a sub-scale becomes larger, the Cronbach’s α of the subscale decreases [23]. In the PDA, each subscale comprised three or four question items, which often resulted in a smaller value of Cronbach’s α in each subscale. Never-theless, five out of the six subscales presented with a value of 0.8-0.9. Only the ‘importance’ subscale pre-sented with a low Cronbach’sαof 0.56.
It is important to note that, in this study, in describing the importance of dentures, Q20 exhibited a ‘ceiling
effect’. This was because all patients had used complete dentures previously and required new dentures, thus complete dentures were important for them. For this reason, the SDs of Q20 were small for most of the pa-tients as compared with that in the other three question items for this subscale. Moreover, the difference between the Before-1 PDA and After PDA scores mean values of Q21 or Q22 was large with wide variance. On the other hand, the difference of Q19 or Q20 was small with nar-row variance. The question items of Q21 and Q22 were added after second factor analysis. Thus, the directions of the construct of Q19 or Q20 might be different from Q21and Q22. These led to a small Cronbach’s α, the average inter-item correlation and the impact in the‘ im-portance’ subscale. By comparison, the highest average inter-item correlation coefficient was in the‘expectation’ subscale. It is likely that Q13 and Q15 (Table 3) deliver similar content, which may account for the highest score of the average inter-item correlation coefficients in the ‘expectation’subscale.
The ICCs of the test-retest reliability for the ‘ expect-ation’and‘importance’subscales were low as compared with other studies [10,11]. The reason for this discrep-ancy may be that the interval between the test-retest in our study was 2 months while other studies used a 1- or 2-week-interval. The ‘expectation’subscale consisted of question items related to expectancy of improvement with new dentures and the ‘importance’ subscale con-sisted of question items related to the importance of dentures to patients, depending on the patients’ percep-tion. The 2-month interval was sufficient time to en-hance the relationship and trust between the patients
Table 5 Cronbach’sαand average inter-item correlation coefficients assessed by Before-1 PDA scores (N = 93)
Scales Cronbach’sα Average inter-item correlation coefficient
Summary score 0.91 0.59
Function 0.85 0.59
Aesthetics & speech
0.83 0.54
Lower denture 0.89 0.67
Expectation 0.93 0.83
Upper denture 0.86 0.67
Importance 0.56 0.28
Before-1, questionnaire before replacement; PDA, Patient’s Denture Assessment.
Table 6 Test-retest reliability assessed by before-1 and before-2 patient’s denture assessment (PDA) scores (N = 33)
Scales ICC 95% CI
Summary score 0.78 [0.61, 0.89]
Function 0.74 [0.54, 0.86]
Aesthetics & speech 0.77 [0.69, 0.91]
Lower denture 0.83 [0.46, 0.83]
Expectation 0.37 [0.03, 0.63]
Upper denture 0.69 [0.59, 0.88]
Importance 0.59 [0.32, 0.77]
Before-1, questionnaire before replacement; Before-2, second questionnaire before replacement within 2 months of the first; After, questionnaire after replacement; ICC, interclass correlation coefficients CI, Confidential Interval.
Table 7 Results of the paired t-test for before-1 and after patient’s denture assessment (PDA) scores
Scales Mean ± SD P
Summary score Before-1 1433 ± 430 < 0.00
After 1850 ± 340
Function Before-1 298 ± 93 < 0.00
After 340 ± 74
Aesthetics & speech Before-1 251 ± 116 < 0.00
After 331 ± 73
Lower denture Before-1 176 ± 122 < 0.00
After 307 ± 93
Expectation Before-1 169 ± 113 < 0.00
After 249 ± 69
Upper denture Before-1 202 ± 90 < 0.00
After 263 ± 43
Importance Before-1 336 ± 59 < 0.00
and their operators, which may have influenced their ex-pectation perceptions to new dentures and the import-ance of wearing dentures.
For the assessment of validity, there was a significant difference in the summary score and the six subscale scores before and after replacement of new dentures. Thus, it is suggested that the PDA can detect differences in patients’ self-assessment between previous and new dentures.
The ‘lower denture’ and ‘expectation’ subscales had lower means for the Before-1 PDA scores than that seen with the other subscales. This suggests that most of the participants selected for the study wore insufficient lower dentures and they had low expectations for the ef-ficacy of their new dentures. Table 1 shows larger num-ber of patients whose period of lower edentulousness was less than one year than upper edentulousness. Moreover, the previous study has shown that patients have a lower expectation for their new dentures when their rating for their previous dentures is low [24]. Therefore, it is suggested that shorter period of edentu-lousness and insufficient dentures might cause problems with lower dentures and following low expectations in the study.
In the present study, the effect size was 0.97. Accord-ing to the already-described statement, it is suggested that 0.97 of the ability to detect change in the study rep-resents high ability to detect change. The PDA after treatment was requested after the dentures had been completely adjusted, with all participants given adequate time for these adjustments. Thus, the negative effects of the previous dentures were no longer present and posi-tive effects of the new complete dentures might explain the large effect size reported in the study.
This study demonstrated good reliability and validity of the PDA. Thus, this questionnaire could help dentists ob-tain a detailed understanding of the patients’perceptions in using their dentures, which is considered valuable infor-mation for dentists when designing new dentures. In our previous study, we demonstrated that sufficient retention of lower dentures and appropriate appearance would lead to improved OHRQoL in edentulous patients who had previously been wearing insufficient lower dentures and/ or dentures with an unsatisfactory appearance [18]. The PDA can be thus applied in the clinical situation. How-ever, dentists should carefully interpret the results specific to the‘importance’subscale because of the ‘ceiling effect’ and the possibility of the difference direction between Q19 or Q20 and Q21 or Q22 seen in this study.
All participants in the study were recruited in a uni-versity hospital setting. Therefore, the reliability and val-idity of our test must be extrapolated to the general population besides patients in university hospitals. In addition, the questionnaire is presently written in Japanese
only. It is recommended that the questionnaire is trans-lated into other languages and evaluated for its reliabil-ity and validreliabil-ity with a view for its wider implementation in future studies.
Conclusions
When used among edentulous patients requiring new complete dentures, the PDA demonstrated good reliabil-ity by assessing internal consistency and test-retest reli-ability. In addition, the PDA demonstrated good validity by assessing discriminant validity.
Abbreviations
FDA:United States food and drug administration; OHRoL: Oral health-related quality of life; VAS: Visual analogue scale; OHIP: Oral health impact profile; PDA: Patient’s denture assessment.
Competing interests
The authors declare that they have no competing interests.
Authors’contributions
YK contributed to the design of the study, data analysis and drafted the manuscript. MK, YK, YS and SM contributed to the design of the study, data collection and performed data analysis. All authors read and approved the final manuscript.
Acknowledgements
This work was supported by a Japanese Society for the Promotion of Sciences KAKENHI Grant-in-Aid for Scientific Research (C) 20592257.
Received: 26 September 2013 Accepted: 25 April 2014 Published: 2 May 2014
References
1. Douglass CW, Shih A, Ostry L:Will there be a need for complete dentures in the United States in 2020?J Prosthet Dent2002,87:5–8.
2. Carlsson GE, Omar R:The future of complete dentures in oral rehabilitation. A critical review.J Oral Rehabil2010,37:143–156. 3. U.S. Department of Health and Human Services FDA Center for Drug
Evaluation and Research; U.S. Department of Health and Human Services FDA Center for Biologics Evaluation and Research; U.S. Department of Health and Human Services FDA Center for Devices and Radiological Health:Guidance for industry: patient-reported outcome measures: use in medical product development to support labeling claims: draft guid-ance.Health Qual Life Out2006,4:79.
4. Divaris K, Ntounis A, Marinis A, Polyzois GL, Polychronopoulou A:Patients’ profiles and perceptions of complete dentures in a university dental clinic.Int J Prosthodont2012,25:145–147.
5. Stober T, Danner D, Lehmann F, Séché AC, Rammelsberg P, Hassel AJ: Association between patient satisfaction with complete dentures and oral health-related quality of life: two-year longitudinal assessment.Clin Oral Invest2012,16:313–318.
6. Gjengedal H, Berg E, Boe OE, Trovik TA:Self-reported oral health and denture satisfaction in partially and completely edentulous patients.Int J Prosthodont2011,24:9–15.
7. Turker SB, Sener ID, Ozkan YK:Satisfaction of the complete denture wearers related to various factors.Arch Gerontol Geriat2009, 49:e126–e129.
8. Forgie AH, Scott BJ, Davis DM:A study to compare the oral health impact profile and satisfaction before and after having replacement complete dentures in England and Scotland.Gerodontology2005,22:137–142. 9. Kawai Y, Murakami H, Shariati B, Klemetti E, Blomfield JV, Billette L, Lund JP,
Feine JS:Do traditional techniques produce better conventional complete dentures than simplified techniques?J Dent2005,33:659–668. 10. Bae KH, Kim HD, Jung SH, Park DY, Kim JB, Paik DI, Chung SC:Validation of
11. Wong MC, Lo EC, McMillan AS:Validation of a Chinese version of the oral health impact profile (OHIP).Community Dent Oral Epidemiol2002, 30:423–430.
12. van der Meulen MJ, John MT, Naeije M, Lobbezoo F:The Dutch version of the oral health impact profile (OHIP-NL): translation, reliability and construct validity.BMC Oral Health2008,8:11.
13. Papagiannopoulou V, Oulis CJ, Papaioannou W, Antonogeorgos G, Yfantopoulos J:Validation of a Greek version of the oral health impact profile (OHIP-14) for use among adults.Health Qual Life Out2012,10:7. 14. Sato Y, Kaiba Y, Yamaga E, Minakuchi S:Reliability and validity of a
Japanese version of the oral health impact profile for edentulous subjects.Gerodontology2012,29:e1033–e1037.
15. Saub R, Locker D, Allison P:Derivation and validation of the short version of the Malaysian oral health impact profile.Community Dent Oral Epidemiol2005,33:378–383.
16. Souza RF, Patrocínio L, Pero AC, Marra J, Compagnoni MA:Reliability and validation of a Brazilian version of the oral health impact profile for assessing edentulous subjects.J Oral Rehabil2007,34:821–826. 17. McGrath C, Broder H, Wilson-Genderson M:Assessing the impact of oral
health on the life quality of children: implications for research and prac-tice.Community Dent Oral Epidemiol2004,32:81–85.
18. Komagamine Y, Kanazawa M, Kaiba Y, Sato Y, Minakuchi S, Sasaki Y: Association between self-assessment of complete dentures and oral health-related quality of life.J Oral Rehabil2012,39:847–857. 19. Bland JM, Altman DG:Cronbach’s alpha.BMJ1997,314:572. 20. Szentpétery A, Szabó G, Marada G, Szántó I, John MT:The Hungarian
version of the oral health impact profile.Eur J Oral Sci2006,114:197–203. 21. Allen PF, McMillan AS, Locker D:An assessment of sensitivity to change of
the oral health impact profile in a clinical trial.Community Dent Oral Epidemiol2001,29:175–182.
22. Cohen J:A power primer.Psychol Bull1992,112:155–159.
23. Cortina JM:What is coefficient alpha? An examination of theory and applications.J Appl Psychol1993,78:98–104.
24. Gaspar MG, Dos Santos MB, Dos Santos JF, Marchini L:Correlation of previous experience, patient expectation and the number of post-delivery adjustments of complete dentures with patient satisfaction in a Brazilian population.J Oral Rehabil2013,40:590–594.
doi:10.1186/1472-6831-14-45
Cite this article as:Komagamineet al.:Reliability and validity of a
questionnaire for self-assessment of complete dentures.BMC Oral Health 201414:45.
Submit your next manuscript to BioMed Central and take full advantage of:
• Convenient online submission
• Thorough peer review
• No space constraints or color figure charges
• Immediate publication on acceptance
• Inclusion in PubMed, CAS, Scopus and Google Scholar
• Research which is freely available for redistribution