Classification of Microarray Data
using
Artificial Neural Network
Sandeep Singh
Department of Computer Science and Engineering
National Institute of Technology Rourkela
Rourkela-769008, Odisha, India
May 2015
Classification of Microarray Data
using
Artificial Neural Network
Thesis submitted in partial fulfillment of the requirements for the degree of
Master of Technology
inComputer Science and Engineering
(Specialization: Software Engineering)
by
Sandeep Singh
(Roll No.- 213CS3192)under the supervision of
Prof. S. K. Rath
Department of Computer Science and Engineering
National Institute of Technology Rourkela
Rourkela, Odisha, 769 008, India
Department of Computer Science and Engineering
National Institute of Technology Rourkela
Rourkela-769 008, Odisha, India.
Certificate
This is to certify that the work in the thesis entitled Classification of Mi-croarray Data using Artificial Neural Network by Sandeep Singh is a record of an original research work carried out by him under my supervision and guidance in partial fulfillment of the requirements for the award of the degree of Master of Technology with the specialization of Software Engineering in the de-partment of Computer Science and Engineering, National Institute of Technology Rourkela. Neither this thesis nor any part of it has been submitted for any degree or academic award elsewhere.
Place: NIT Rourkela (Prof. Santanu Kumar Rath)
Date: May 26, 2015 Professor, CSE Department
Acknowledgment
I am grateful to numerous local and global peers who have contributed towards shaping this thesis. At the outset, I would like to express my sincere thanks to Prof. Santanu Kumar Rath for his advice during my thesis work. As my supervisor, he has constantly encouraged me to remain focused on achieving my goal. His observations and comments helped me to establish the overall direction to the research and to move forward with investigation in depth. He has helped me greatly and been a source of knowledge.
I am very much indebted to Prof. Santanu Kumar Rath, for his continuous encouragement and support. He is always ready to help with a smile. I am also thankful to all the professors at the department for their support.
I would like to thank all my friends and lab-mates for their encouragement and understanding. Their help can never be penned with words.
I must acknowledge the academic resources that I have got from NIT Rourkela. I would like to thank administrative and technical staff members of the Department who have been kind enough to advise and help in their respective roles.
Last, but not the least, I would like to dedicate this thesis to my family, for their love, patience, and understanding.
Sandeep Singh 213CS3192
Abstract
Microarray dataset often contains a huge number of insignificant and irrele-vant features that might lead to loss of useful information. The classes with both high relevance and having high significance feature sets are generally preferred for selecting the features, which determines the sample classification into their respec-tive classes. This property has gained a lot of significance among the researchers and practitioners in DNA micro array classification.Classifier named as, Functional link neural network (FLNN) with four different functional expansion (Power se-ries polynomial, Trigonometric, Chebyshev polynomial and Legendre polynomial functions) have been considered to classify microarray data sets using t-test as a feature selection method. Further, a comparative analysis on the obtained clas-sification accuracy by coupling FLNN with different basis function. Performance parameters available in literature such as precision, recall, specificity, F-Measure, ROC curve and accuracy are applied in this comparative analysis to analyze the behavior of the classifiers. From the proposed approach, it is apparent that FLNN using Legendre polynomial is the suitable classification model among FLNN using different basis functions and other classifiers.
Keywords: DNA Classification, Functional Link Neural Network,Gene selec-tion, Microarray,t-test.
Contents
Certificate ii
Acknowledgement iii
Abstract iv
List of Figures vii
List of Tables viii
List of Abbreviation ix 1 Introduction 2 1.1 Introduction . . . 2 1.1.1 DNA Microarray . . . 3 1.1.2 t-statistic . . . 3 1.1.3 Classification methodology . . . 4 1.2 Literature Review . . . 4 1.3 Research Motivation . . . 4 1.4 Research Objective . . . 4 1.5 Thesis Organization . . . 5 2 Proposed work 6 2.1 Proposed Work . . . 6
3 Functional Link Neural Network 9 3.1 Introduction . . . 9
3.1.1 FLNN Architecture . . . 9
3.2 Methodology Used . . . 10
CONTENTS CONTENTS
3.2.2 FLNN Classifier . . . 12
3.3 Results and interpretation . . . 15
3.3.1 Case study: Leukemia cancer dataset . . . 16
3.3.2 Case study: Ovarian cancer . . . 18
3.3.3 Case study: Breast cancer . . . 18
4 Comparative analysis 21
5 Conclusion and Future work 23
Bibliography 24
Dissemination of Work 28
List of Figures
2.1 Proposed work for microarray classification. . . 7
3.1 System architecture of FLNN using Polynomial expansion . . . 10
3.2 System architecture of FLNN using Trigonometric expansion . . . . 10
3.3 System architecture of FLNN using Chebyshev expansion . . . 11
3.4 System architecture of FLNN using Legendre expansion . . . 11
3.5 Systematic algorithm of Functional Link neural Network (FLNN) based classifier model. . . 13
3.6 Mean Square Error vs. Epoch curve . . . 17
3.7 Mean Square Error vs. Epoch curve . . . 18
List of Tables
1.1 Results obtained by various researchers and practitioners for classi-fication using microarray (leukemia) data set. The Table gives the feature selection and classification methodologies adopted and their corresponding accuracies. . . 5
3.1 Before applying classification algorithm . . . 16 3.2 Classification matrix for FLNN models using Leukemia dataset. . . 17 3.3 Performance analysis of FLNN classifiers using Leukemia dataset. . 17 3.4 Before applying classification algorithm . . . 18 3.5 Classification matrix for FLNN models using Ovarian cancer dataset. 19 3.6 Performance analysis of FLNN classifiers using Ovarian cancer dataset. 19 3.7 Before applying classification algorithm . . . 19 3.8 Classification matrix for FLNN models using Breast dataset. . . 20 3.9 Performance analysis of FLNN classifiers using Breast dataset. . . . 20
4.1 Performance analysis of FLNN classifiers on all three dataset. . . . 21
LIST OF TABLES LIST OF TABLES
List Of Abbreviation
ANN Artificial neural network
FLNN Functional Link neural network
HON Higher order network
ROC Receive operating characteristics
TS Relevance Score
FP False Positive
FN False Negative
GA Genetics algorithm
SVM Support Vector Machine
TP True Positive
Introduction
Introduction Performance Parameter Literature Review Research Motivation Research Objective Thesis OrganizationChapter 1
Introduction
1.1
Introduction
Diagnosis of any disease in particular cancer, is vital for successful application of any specific therapy. Even though the classification of cells into cancerous and non-cancerous categories in relation to cancer diagnosis has improved quite significantly over the past few years, still the research is being carried out and there is a scope for improvement in proper diagnosis. This objective can be achieved with the application of less subjective models. Recent development in diagnosis, indicates that DNA microarray provides an insight to cancer classification at gene level. This is due to their capability in measuring abundant messenger ribonucleic acid (mRNA) transcripts for numerous genes concurrently.
Microarray based quality expression profiling has been developed as an effec-tive system for disease like cancer classification and additionally for its visualiza-tion, and treatment purposes [1]. In recent years, Deoxyribonucleic acid (DNA) microarray technique has shown a great impact in determining the informative genes that cause cancer [2,3]. The major drawback that exists in microarray data is the condemnation of dimensionality issue, i.e., the number of genes ‘N’ exceeds by wide margin the number of samples ‘M’ i.e., N>> M [4]. This problem hinders the useful information of data set and leads to computational instability. There-fore, selecting relevant genes is a challenging task in microarray data analysis.
A good number of feature (gene) extraction techniques and classifiers based on Artificial Neural Network have been proposed by various researchers and
practi-1.1 Introduction Introduction
tioners [5–9].
Further, work can be extended by using the kernel trick where data is not linearly separable, i.e., data is complex in nature and can be mapped into a higher dimension. Using classifiers, data can be classified using kernel functions for non-linear space. The kernel trick can also be applied for all the existing classifiers to classify data with high predictive accuracy [10].
1.1.1
DNA Microarray
A DNA micorarray permits researchers to perform a research on thousands of different gene simultaneously.
Each spot on a microarray contains numerous indistinguishable strands of
DNA.
The DNA arrangement on every spot is remarkable. Each spot speaks of one gene.
Thousands of spots are arranged efficiently in the form of rows and column
on a surface (generally glass).
The exact location and arrangement of every spot is recorded in the form of
database
Microarrays are generally small in size, may be the size of a microscopic
slide.
1.1.2
t-statistic
The t-test is an univariate criterion, which is a widely used in a filter method, and is applied independently on each feature to show that there is no relationship among the features. Selecting features using t-test is to reduce the data dimension by finding only critical features, that leads to better performance.
Null hypothesis (H0): the ‘mean’ value of the population of a feature is same
i.e., m0 =m1.
1.2 Literature Review Introduction
Alternate hypothesis (H1): the mean value of the population of a feature
are not same i.e., m0 6=m1.
1.1.3
Classification methodology
Classifier considered here is, Functional Link Neural Network (FLNN).
FLNN Classifier
Functional link neural network (FLNN) is a classifier, that can be applied on the problem of DNA classification. It goes under the class of higher order and has been utilized as a part of numerous applications. These networks are specifically designed for handling linearly non-separable problems using appropriate input representation. Thus, suitable enhanced representation of the input data needs to be found out. This can be achieved by increasing the input dimension.
1.2
Literature Review
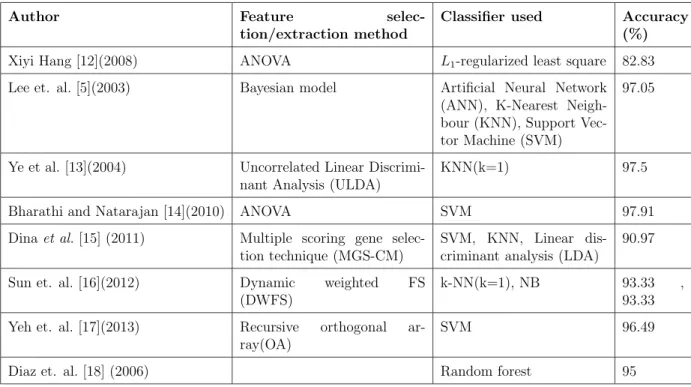
This section gives overview of feature selection methods and classifiers used by various researchers. The accuracy rate achieved by different authors for gene classification are listed in Table 1.1.
1.3
Research Motivation
Diagnosis of disease like cancer, is vital for successful application of any specific therapy. Therefore the correct classification of cells into cancerous and non can-cerous categories needs to be carried out for improvement in diagnosis. But as the microarray data sequence is of high dimension, and also contains missing and noisy samples, leads to computational instability. Therefore selecting relevant genes is a challenging task in microarray data analysis.
1.4
Research Objective
The main objective of the thesis work is to develop an efficient classifier showing high level of performance accuracy. Since the selection of features has a great
1.5 Thesis Organization Introduction
Table 1.1: Results obtained by various researchers and practitioners for classifica-tion using microarray (leukemia) data set. The Table gives the feature selecclassifica-tion and classification methodologies adopted and their corresponding accuracies.
Author Feature
selec-tion/extraction method
Classifier used Accuracy (%)
Xiyi Hang [12](2008) ANOVA L1-regularized least square 82.83
Lee et. al. [5](2003) Bayesian model Artificial Neural Network (ANN), K-Nearest Neigh-bour (KNN), Support Vec-tor Machine (SVM)
97.05
Ye et al. [13](2004) Uncorrelated Linear Discrimi-nant Analysis (ULDA)
KNN(k=1) 97.5
Bharathi and Natarajan [14](2010) ANOVA SVM 97.91
Dinaet al.[15] (2011) Multiple scoring gene selec-tion technique (MGS-CM)
SVM, KNN, Linear dis-criminant analysis (LDA)
90.97 Sun et. al. [16](2012) Dynamic weighted FS
(DWFS)
k-NN(k=1), NB 93.33 , 93.33 Yeh et. al. [17](2013) Recursive orthogonal
ar-ray(OA)
SVM 96.49
Diaz et. al. [18] (2006) Random forest 95
impact on the performance of the classifier, efforts are made to select relevant number of distinguishing features. The main focus has been given in the thesis work are on two main aspects namely feature extraction and classifier design
1.5
Thesis Organization
The rest of the thesis is organized as follows.
Chapter-2, presents the proposed work for classifying the microarray data using FLNN and ELM classifier.
Chapter-3, In this chapter Functional Link Neural Network with different Func-tional expansions has been proposed and implemented; and their results have been compared.
Chapter-4 highlights on the results obtained, interpretation drawn from it, and also presents a comparative analysis for gene classification of microarray data.
Chapter-5 closes the work and considers the extension for future work.
Chapter 2
Proposed work
2.1
Proposed Work
The existence of large number of insignificant and unessential features degrades the quality of analysis of the disease like ‘cancer’. To enhance the quality, it is very much essential to analyze the dataset in proper perspective. This section presents the proposed approach for classification of microarray data, consisting of two phases:
1) Preprocessing the input data using methods such as missing data imputation, normalization, and feature selection usingt-statistic.
2) Applying FLNN with different basis functions as a classifier.
Figure 2.1 demonstrates the flow chart of the proposed approach and brief description of the proposed approach is discussed below:
1. Data collection: The data set for classification analysis, which is the req-uisite input to the models is collected from Kent Ridge Bio-therapeutic Data Set Repository [1].
2. Missing data imputation and normalization of dataset:
Missing data of a feature (gene) of microarray data are imputed by using the
mean value of the respective feature. Input feature values are normalized over the range [0,1] using Min-Max normalization technique [19].
2.1 Proposed Work Proposed work Data Missing value imputation and Data normalization Feature selection using t-test
Training data Test data
Classify data based on FLNN
Adjustment parameters Classification result Evaluations indexes Validity of classifications ? Output classification results 10-Fold CV Yes No
Figure 2.1: Proposed work for microarray classification.
3. Division of Dataset: The data set is separated into two categories such as: training set and testing set.
4. Feature selection from dataset:
t-test statistics has been applied to select the features having high relevance value and hence the curse of dimensionality issue has been reduced.
5. Application of a classifier:
FLNN classifier with different basis function and and ELM classifier with different kernel functions have been built to classify the microarray dataset.
2.1 Proposed Work Proposed work
6. Testing:
Models are tested based on test data set and then the performance of the classifier has been compared with various performance measuring criteria such as precision, recall, specificity, F-Measure, ROC curve and accuracy using “10-fold cross validation” technique [20].
Chapter 3
Functional Link Neural Network
3.1
Introduction
Functional link neural network (FLNN) is a classifier that can be applied on the problem of DNA classification. It goes under the class of higher order and has been utilized as a part of numerous applications [21]. These networks are specifically designed for handling linearly non-separable problems using appropriate input representation. Thus, suitable improved representation of the data information needs to be found out. This can be achieved by expanding the measurement of the data space. The input data which is expanded is utilized for preparing rather than the genuine data. In this case, higher order input terms are chosen so that they are linearly independent of the original pattern components.
3.1.1
FLNN Architecture
To conquer the complexities of multi-layer neural system, single layer neural sys-tem can be well picked as an option approach. However, the single layer neural network being linear in nature, a number of times neglects to guide the complex nonlinear issues. Hence to overpass computational complexity associated with multilayer neural network, the FLNN construction modeling is proposed. The FLNN structural planning maps complex nonlinear problems by using functional expansion.
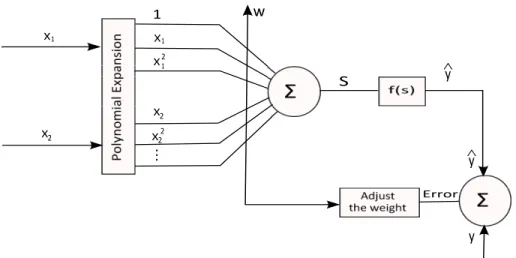
Figure 3.1, Figure 3.2, Figure 3.3, and Figure 3.4 shows the basic architecture of Functional Link Neural Network (FLNN). These architecture are varied based
3.2 Methodology Used Functional Link Neural Network
on their functional expansions.
Error y ^ y w S ^y X 1 2 X 1 2 1 X 1 X 2 2 X ... 2 X
Figure 3.1: System architecture of FLNN using Polynomial expansion
Error y ^ y w S ^y X 1 2 X 1 2 1 X 1 X ... 2 X sin( π ) X sin( π )
Figure 3.2: System architecture of FLNN using Trigonometric expansion
3.2
Methodology Used
Functional link neural network (FLNN) with four different basis functions named as Power series polynomial, Trigonometric, Chebyshev polynomial and Legendre polynomial functions have been considered to classify microarray data sets using
3.2 Methodology Used Functional Link Neural Network Error y ^ y w S ^y X 1 X 1 2 1 X 1 X ... 2 X C 1) 2 X 1 C )
Figure 3.3: System architecture of FLNN using Chebyshev expansion
Error y ^ y w S ^y X 1 X 1 2 1 X 1 X ... 2 X L 1 2 X 1 L
Figure 3.4: System architecture of FLNN using Legendre expansion
3.2.1
Feature selection using
t
-test
Generally, the problems with microarray data are (a) “curse of dimensionality”, where numbers of features exceeds by wide margin than the number of samples. (b) To many features having very less impact on the classification result, etc.
To overcome ‘curse of dimensionality’ problem for a given dataset, feature selection approaches can be considered. In our case t-statistic filter approach is used to overcome this problem. This helps in achieving better classification rate as it selects a small set of important features. Relevance score (TS) of ith feature
is computed using Equation 3.1.
T S(i) = X¯i1−X¯i2 sX1X2 q 1 n1 + 1 n2 (3.1) 11
3.2 Methodology Used Functional Link Neural Network s2X1X2 = (n1−1)s2Xi1 + (n2−1)s 2 Xi2 n1+n2−2 (3.2)
wheresX1X2 is an estimator of the common standard deviation of the two samples
and calculated using Equation 3.2, ¯Xik represents the mean of feature i of class k ∈ {1,2} and s represents the standard deviation.
Univariate criterion, which is widely used in a filter method, is applied inde-pendently on each feature to show that there is no relationship among the features. A two-class problem for the test of null hypothesis indicates that themean of two populations are equal. This suggests that there exists no noteworthy difference between their means, and both features are almost the same. Therefore, it is nec-essary to reject ‘null hypothesis’ (H0) and accept the ‘alternate hypothesis’ (H1).
Hence, one can infer that these features do not contribute much in classification. Hence the features may be discarded; and those features having significant differ-ence between their means may be accepted. In other words, alternate hypothesis may be accepted. Here, t-test on each feature has been applied. The effectiveness of separating the groups, is measured by the corresponding p-value of each feature.
3.2.2
FLNN Classifier
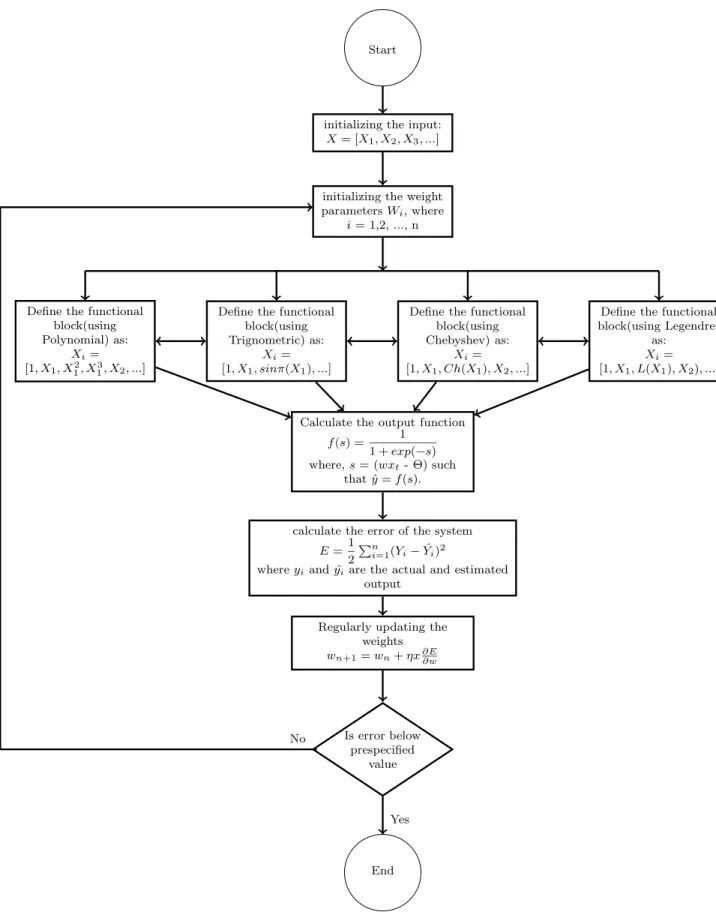
Here four different architecture of FLNN are discussed. These architectures are changed taking into account their usage of function for the improvement of func-tional expansions by enhancing the inputs [21,22]. Figure 3.5 graphically represent the algorithm of the proposed model and brief description of the proposed model is discussed below:
a) Power series polynomial FLNN:
In this architecture, power series polynomial function is used as a basis function. Here the input pattern of a FLNN is a generalized vector representation. For example, after enhancement input pattern of x= (x1, x2, x3) can be enhanced as
3.2 Methodology Used Functional Link Neural Network
Start
End initializing the input:
X= [X1, X2, X3, ...]
initializing the weight parametersWi, where
i= 1,2, ..., n
Define the functional block(using Polynomial) as: Xi= [1, X1, X12, X 3 1, X2, ...]
Define the functional block(using Legendre)
as:
Xi=
[1, X1, L(X1), X2), ...]
Define the functional block(using Chebyshev) as:
Xi=
[1, X1, Ch(X1), X2, ...]
Define the functional block(using Trignometric) as:
Xi=
[1, X1, sinπ(X1), ...]
Calculate the output function
f(s) = 1
1 +exp(−s) where,s= (wxt- Θ) such
that ˆy=f(s).
calculate the error of the system
E=1
2
Pn
i=1(Yi−Yˆi) 2
whereyiand ˆyiare the actual and estimated
output
Is error below prespecified
value Regularly updating the
weights
wn+1=wn+ηx∂E∂w
Yes No
Figure 3.5: Systematic algorithm of Functional Link neural Network (FLNN) based classifier model.
3.2 Methodology Used Functional Link Neural Network
Let f denote the output node’s activation function , Θ be a bias in f, which is defined as follows:
f(s) = 1
1 +exp(−s) (3.3)
where s is equal to (wxt - Θ) such that ˆy = f(s). Here, wxt is the inner
product of w with xt. The square error denoted by E can be measured as:
E = 1 2 n X i=1 (yi−yˆi)2 (3.4)
where yi and ˆyi are the actual and estimated output of the ith input training
pattern respectively, and n is the number of training pattern. The training phase is continued to regularly updatewusing Eq. 3.5, tillEreaches below pre-specified value.
wn+1=wn+ηx ∂E
∂w (3.5)
b) Trigonometric FLNN:
The fundamental standard of this model is same as examined in above model, however the function used here is a trigonometric basis function. Let say X = [X1, X2, ..., Xn]T is the input pattern vector; therefore the enhanced pattern is
obtained by using the trigonometric function asX∗ = [X
1, sin(πX1), cos(πX1), sin(2πX1), cos(2πX1)...]
c) Chebyshev Polynomial FLNN:
The basic principle remains same as used in previous models the only difference is basis function here used is Chebyshev orthogonal polynomial. Hence joining the fundamental qualities of FLNN and Chebyshev orthogonal polynomial resulting in another FLNN named as chebyshev FLNN (CFLNN).
The first few Chebyshev polynomials are given as:
Ch0(x) = 1, Ch1(x) = x, Ch2(x) = 2x2 −1, Ch3(x) = 4x3 −3(x), Ch4(x) =
8x3−8x2 + 1, Ch
5(x) = 16x4−20x3+ 5x.
Lets consider X = [x1, x2, x3] as input pattern vector, the expanded pattern
ob-tained by using the Chebyshev polynomial function is given by: X∗ = [1, Ch 1(x1),
3.3 Results and interpretation Functional Link Neural Network
Ch2(x1), ...,1, Ch1(x2), Ch2(x2), ...,1, Ch1(x3), Ch2(x3), ...,], where Chi(xj) is a
Chebyshev polynomial, i the order of the polynomials chosen and j = 1, 2, 3.
d) Legendre Polynomial FLNN:
The structure of Legendre neural system is like all the past model. The only difference is that Legendre neural network uses Legendre polynomial function as basis function.
The Legendre polynomials are denoted by Ln(X), where n is the order of the
polynomial chosen.
The first few Legendre polynomials are given byL0(x) = 1,L1(x) =x,L2(x) =
1/2(3x2 −1), L
3(x) = 1/2(5x3 −3x)... and so on. Polynomials are created by
utilizing the accompanying numerical expression:
Ln+1(x) =
1
n+ 1[(2n+ 1)xLn(x)−nLn−1(x)]. (3.6)
Let, the input pattern X = [x1x2]T, enhanced by Legendre polynomial function is
given as
X∗ = [1, L
1(x1), L2(x1), L3(x1), L1(x2), L2(x2), L3(x2)].
3.3
Results and interpretation
In this section, the obtained results are discussed for the proposed work. Three case studies viz., leukemia [1], ovarian cancer [23] and breast cancer [24] microarray datasets are considered to find the classification accuracy. “10 fold cross validation (CV)” is applied to assess the performance of the classifier, as it provides more realistic assessment of classifiers, which generalizes significantly to unseen data.
Since the data set contains a very huge number of features with irrelevant in-formation, feature selection (FS) method has been applied. This helps in selecting the features (genes) which have high relevance score. The genes with low relevance score are stripped off. The t-test statistic method has been used to choose genes with high relevance score.
3.3 Results and interpretation Functional Link Neural Network
After performing feature selection using t-test, the proposed classification al-gorithm “FLNN” has been applied to classify the reduced dataset.
When the samples are sequentially selected, the model designed may be over-trained or under-over-trained. This is because of the samples selected for training may contain either cancerous or non-cancerous data. To avoid this, everyNth(N = 10)
sample is selected for testing, and the rest of the samples are chosen as training set. Further, FLNN is trained using ‘10-fold CV’ technique [20].
After performing “10-fold CV”, the predicted values of test data are collected in each of the fold and the classification matrix is designed with their respective feature set using FLNN classifiers. This analysis has been carried out on three different microarray datasets by considering varying number of feature sets. The feature sets are varied in the multiple of five i.e., 5, 10, 15, 20, ....
In this study α = 0.1, η = 0.6, and Epoch = 2000 has been considered. The obtained results using top features have been presented and discussed below.
3.3.1
Case study: Leukemia cancer dataset
The leukemia dataset consists of 7129 features (genes), and is categorized into two classes viz., Acute Lymphoblastic Leukemia (ALL) and Acute Myeloid Leukemia (AML). These two in combination have 72 samples [1]. Out of 72, the dataset contains 25 AML and 47 ALL samples. Table 3.1 shows the classification matrix before the application of the classification algorithm.
Table 3.1: Before applying classification algorithm ALL(0) AML(1)
ALL(0) 47 0
AML(1) 25 0
After applying the 10-fold cross validation technique on various feature sets i.e., 5, 10, 15, 20, 25, 30. When feature set with top five features have been selected, the highest classification accuracy is achieved. Fig.??shows the Mean Square Error vs. Epoch curve on top five features for all the basis functions in FLNN Classifier using Leukemia dataset. Table 3.2a, Table 3.2b, Table 3.2c, and Table 3.2d show the
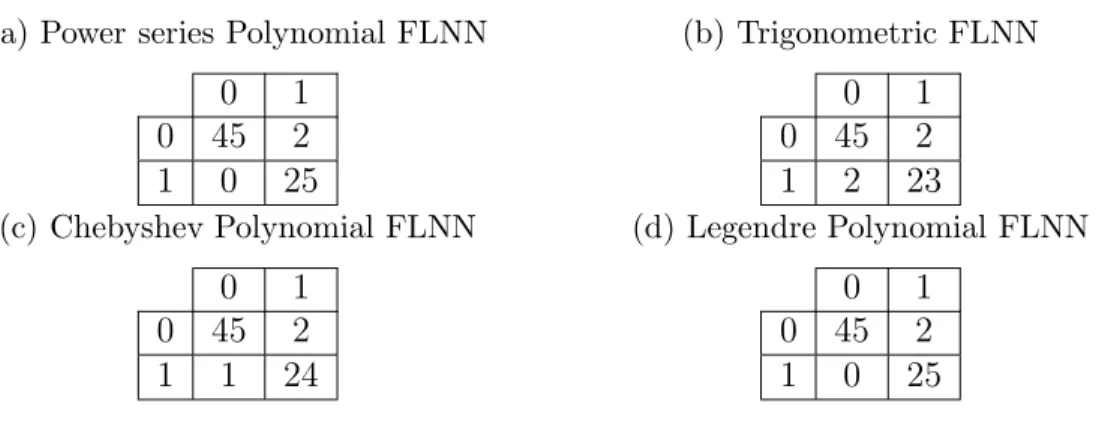
3.3 Results and interpretation Functional Link Neural Network
classification matrix for leukemia data set using FLNN models. These tables show the total number of labeled samples that are correctly classified and misclassified into their respective classes. The rest of the performance parameters are tabulated in Table 3.3. 0 200 400 600 800 1000 1200 1400 1600 1800 2000 0 0.01 0.02 0.03 0.04 0.05 0.06 0.07 Epoch
Mean Square Error
Power series Trigonometric Chebyshev Legendre
Figure 3.6: Mean Square Error vs. Epoch curve
Table 3.2: Classification matrix for FLNN models using Leukemia dataset.
(a) Power series Polynomial FLNN
0 1 0 45 2 1 0 25 (b) Trigonometric FLNN 0 1 0 45 2 1 2 23 (c) Chebyshev Polynomial FLNN 0 1 0 45 2 1 1 24 (d) Legendre Polynomial FLNN 0 1 0 45 2 1 0 25
Table 3.3: Performance analysis of FLNN classifiers using Leukemia dataset.
Classifier Accuracy Precision Recall Specificity F-measure
Power series Polynomial FLNN 0.9722 0.9259 1.0000 0.9574 0.9615 Trigonometric FLNN 0.9444 0.9200 0.9200 0.9574 0.9200 Chebyshev Polynomial FLNN 0.9583 0.9231 0.9600 0.9574 0.9412 Legendre Polynomial FLNN 0.9722 0.9259 1.000 0.9574 0.9615
3.3 Results and interpretation Functional Link Neural Network
3.3.2
Case study: Ovarian cancer
The ovarian cancer dataset consists of 15154 features (genes), categorized as cancer and normal classes, having 253 samples. Out of 253 samples, the dataset contains 162 cancer and 91 normal samples [23]. Table 3.4 shows the classification matrix before the application of the classification algorithm.
Table 3.4: Before applying classification algorithm cancer(0) normal(1)
cancer(0) 162 0
normal(1) 92 0
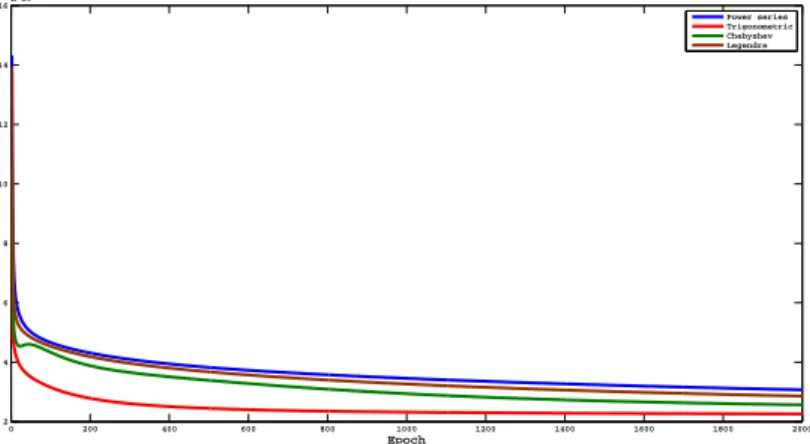
After applying the 10-fold cross validation technique on various feature sets i.e., 5, 10, 15, 20, 25, 30. When feature set with top five features have been selected, the highest classification accuracy is achieved. Fig.3.7 shows the Mean Square Error vs. Epoch curve on top five features for all the basis functions in FLNN Classifier using Ovarian dataset. Table 3.5a, Table 3.5b, Table 3.5c, and Table 3.5d show the classification matrix for ovarian data set using FLNN models. The rest of the performance parameters are tabulated in Table 3.6.
0 200 400 600 800 1000 1200 1400 1600 1800 2000 2 4 6 8 10 12 14 16x 10 −3 Epoch
Mean Square Error
Power series Trigonometric Chebyshev Legendre
Figure 3.7: Mean Square Error vs. Epoch curve
3.3.3
Case study: Breast cancer
The breast cancer dataset consists of 24481 features (genes), categorized as ‘re-lapse’ and ‘non-re‘re-lapse’ classes, having 97 samples [24]. Out of 97 samples, the
3.3 Results and interpretation Functional Link Neural Network
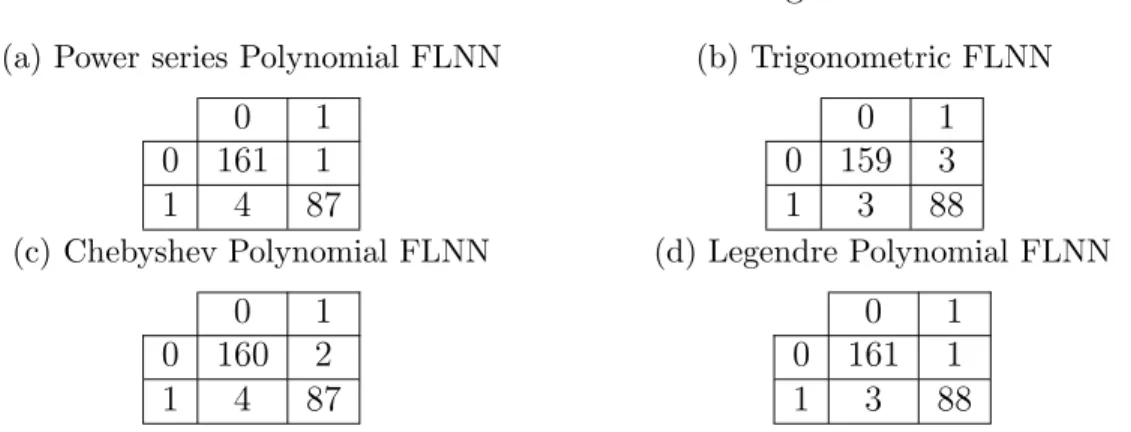
Table 3.5: Classification matrix for FLNN models using Ovarian cancer dataset.
(a) Power series Polynomial FLNN
0 1 0 161 1 1 4 87 (b) Trigonometric FLNN 0 1 0 159 3 1 3 88 (c) Chebyshev Polynomial FLNN 0 1 0 160 2 1 4 87 (d) Legendre Polynomial FLNN 0 1 0 161 1 1 3 88
Table 3.6: Performance analysis of FLNN classifiers using Ovarian cancer dataset.
Classifier used Accuracy Precision Recall Specificity F-measure
Power series Polynomial FLNN 0.9802 0.9886 0.9560 0.9938 0.9721 Trigonometric FLNN 0.9763 0.9670 0.9670 0.9815 0.9670 Chebyshev Polynomial FLNN 0.9763 0.9775 0.9560 0.9877 0.9667 Legendre Polynomial FLNN 0.9842 0.9888 0.9670 0.9938 0.9778
dataset contains 46 relapse and 51 no-relapse samples. Table 3.7 shows the clas-sification matrix before the application of the clasclas-sification algorithm.
Table 3.7: Before applying classification algorithm relapse(0) non-relapse(1)
relapse(0) 46 0
non-relapse(1) 51 0
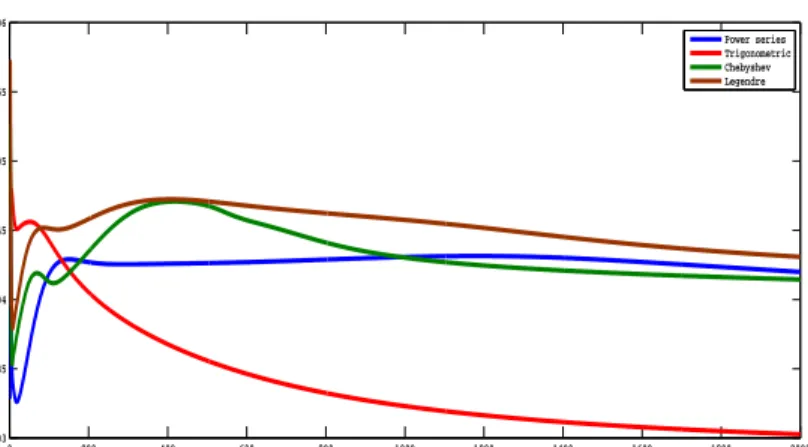
After applying the 10-fold cross validation technique on various feature sets i.e., 5, 10, 15, 20, 25, 30. When feature set with top ten features have been selected, the highest classification accuracy is achieved. Fig.3.8 shows the Mean Square Error vs. Epoch curve on top ten features for all the basis functions in FLNN Classifier using Breast dataset. Table 3.8a, Table 3.8b, Table 3.8c, and Table 3.8d show the classification matrix for Breast data set using FLNN models. These tables show the total number of labeled samples that are correctly classified and misclassified into their respective classes. The rest of the performance parameters are tabulated in Table 3.9.
3.3 Results and interpretation Functional Link Neural Network 0 200 400 600 800 1000 1200 1400 1600 1800 2000 0.03 0.035 0.04 0.045 0.05 0.055 0.06 Epoch
Mean Square Error
Power series Trigonometric Chebyshev Legendre
Figure 3.8: Mean Square Error vs. Epoch curve
Table 3.8: Classification matrix for FLNN models using Breast dataset.
(a) Power series Polynomial FLNN
0 1 0 31 15 1 5 46 (b) Trignometric FLNN 0 1 0 37 9 1 8 43 (c) Chebyshev Polynomial FLNN 0 1 0 34 12 1 6 45 (d) Legendre Polynomial FLNN 0 1 0 38 8 1 6 45
Table 3.9: Performance analysis of FLNN classifiers using Breast dataset.
Classifier Accuracy Precision Recall Specificity F-measure
Power series Polynomial FLNN 0.7938 0.7541 0.9020 0.6739 0.8214 Trigonometric FLNN 0.8247 0.8269 0.8431 0.8043 0.8350 Chebyshev Polynomial FLNN 0.8144 0.7895 0.8824 0.7391 0.8333 Legendre Polynomial FLNN 0.8557 0.8491 0.8824 0.8261 0.8654
Chapter 4
Comparative analysis
Chapter 2 highlight on the result obtained by Functional Link Neural Network (FLNN). The result obtained for the experimental work carried out on three dif-ferent datasets.
In this section, the obtained result carried out by both the classifier has to be discussed.
The detailed comparative analysis of the result obtained by FLNN classifier is discussed below:
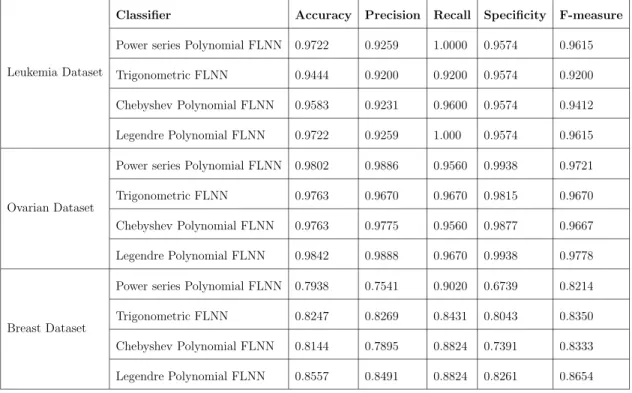
Table 4.1: Performance analysis of FLNN classifiers on all three dataset.
Leukemia Dataset
Classifier Accuracy Precision Recall Specificity F-measure
Power series Polynomial FLNN 0.9722 0.9259 1.0000 0.9574 0.9615 Trigonometric FLNN 0.9444 0.9200 0.9200 0.9574 0.9200 Chebyshev Polynomial FLNN 0.9583 0.9231 0.9600 0.9574 0.9412 Legendre Polynomial FLNN 0.9722 0.9259 1.000 0.9574 0.9615
Ovarian Dataset
Power series Polynomial FLNN 0.9802 0.9886 0.9560 0.9938 0.9721 Trigonometric FLNN 0.9763 0.9670 0.9670 0.9815 0.9670 Chebyshev Polynomial FLNN 0.9763 0.9775 0.9560 0.9877 0.9667 Legendre Polynomial FLNN 0.9842 0.9888 0.9670 0.9938 0.9778
Breast Dataset
Power series Polynomial FLNN 0.7938 0.7541 0.9020 0.6739 0.8214 Trigonometric FLNN 0.8247 0.8269 0.8431 0.8043 0.8350 Chebyshev Polynomial FLNN 0.8144 0.7895 0.8824 0.7391 0.8333 Legendre Polynomial FLNN 0.8557 0.8491 0.8824 0.8261 0.8654
From the above Table 4.1, it can be noticed that there is variation in
Comparative analysis
cation rate. The interpretation drawn from the above results are as follows:
In case of leukemia data set FLNN classifier using Power series Polynomial
and Legendre Polynomial function shows better accuracy value over the remaining two.
In case of ovarian and breast cancer data set, FLNN classifier using Legendre
Polynomial function shows better accuracy over the remaining three.
From Table 4.1, it can be inferred that FLNN using Legendre Polynomial
function is a more intelligent learning algorithm in comparison to other FLNN classifiers.
Chapter 5
Conclusion and Future work
Here an attempt has been made to design classification models for classifying the samples of microarray data into their respective classes. Hence, a classification framework for FLNN was designed using different basis function. Feature selection was carried out using t-test. 10-fold CV technique was applied to enhance the performance of the classifiers. The performance of the classifiers for all three data sets were evaluated using performance parameters available in the literature such as precision, recall, specificity, F-Measure, ROC curve and accuracy are applied in this comparative analysis to analyze the behavior of the classifiers. From the computed result, it is observed that Legendre Polynomial FLNN classifier yields better results when compared with FLNN using remaining functions.
Further, the applicability of machine learning techniques such as Genetic Al-gorithm in combination with FLNN can be studied to obtain better classification of microarray data set. This hybridization may help in reducing the complexity of the classification model.
Bibliography
[1] T. R. Golub, D. K. Slonim, P. Tamayo, C. Huard, M. Gaasenbeek, J. P. Mesirov, H. Coller, M. L. Loh, J. R. Downing, M. A. Caligiuri,et al., “Molec-ular classification of cancer: class discovery and class prediction by gene ex-pression monitoring,” science, vol. 286, pp. 531–537, October 1999.
[2] Y. F. Leung and D. Cavalieri, “Fundamentals of cdna microarray data anal-ysis,” TRENDS in Genetics, vol. 19, pp. 649–659, November 2003.
[3] M. Flores, T. Hsiao, Y. Chiu, E. Chuang, Y. Huang, and Y. Chen, “Gene reg-ulation, modreg-ulation, and their applications in gene expression data analysis.,”
Advances in Bioinformatics, vol. 2013, p. 11 pages, January 2013.
[4] G. Lee, C. Rodriguez, and A. Madabhushi, “Investigating the efficacy of nonlinear dimensionality reduction schemes in classifying gene and protein expression studies,” Computational Biology and Bioinformatics, IEEE/ACM Transactions on, vol. 5, pp. 368–384, July–September 2008.
[5] K. E. Lee, N. Sha, E. R. Dougherty, M. Vannucci, and B. K. Mallick, “Gene selection: a bayesian variable selection approach,” Bioinformatics, vol. 19, pp. 90–97, June 2003.
[6] Y. Peng, W. Li, and Y. Liu, “A hybrid approach for biomarker discovery from microarray gene expression data for cancer classification,” Cancer informat-ics, vol. 2, p. 301, February 2006.
[7] L. Wang, F. Chu, and W. Xie, “Accurate cancer classification using expres-sions of very few genes,” IEEE/ACM Transactions on Computational Biology and Bioinformatics (TCBB), vol. 4, pp. 40–53, Jan–Mar 2007.
Bibliography
[8] K. Deb and A. Raji Reddy, “Reliable classification of two-class cancer data using evolutionary algorithms,” BioSystems, vol. 72, pp. 111–129, November 2003.
[9] J. C. H. Hernandez, B. Duval, and J.-K. Hao, “A genetic embedded approach for gene selection and classification of microarray data,” inEvolutionary Com-putation, Machine Learning and Data Mining in Bioinformatics, pp. 90–101, Springer, 2007.
[10] B. Sch¨olkopf, A. Smola, and K.-R. M¨uller, “Nonlinear component analysis as a kernel eigenvalue problem,” Neural computation, vol. 10, pp. 1299–1319, March 1998.
[11] C. Catal, “Performance evaluation metrics for software fault prediction stud-ies,” Acta Polytechnica Hungarica, vol. 9, no. 4, pp. 193–206, 2012.
[12] X. Hang, “Cancer classification by sparse representation using microar-ray gene expression data,” in Bioinformatics and Biomeidcine Workshops, 2008. BIBMW 2008. IEEE International Conference on, pp. 174–177, IEEE, November 2008.
[13] J. Ye, T. Li, T. Xiong, and R. Janardan, “Using uncorrelated discrimi-nant analysis for tissue classification with gene expression data,” IEEE/ACM Transactions on Computational Biology and Bioinformatics (TCBB), vol. 1, pp. 181–190, October 2004.
[14] A. Bharathi and A. Natarajan, “Cancer classification of bioinformatics data using anova,” International Journal of Computer Theory and Engineering, vol. 2, pp. 369–373, June 2010.
[15] D. A. Salem, A. Seoud, R. Ahmed, and H. A. Ali, “Mgs-cm: A multiple scoring gene selection technique for cancer classification using microarrays,”
International Journal of Computer Applications, vol. 36, December 2011.
Bibliography
[16] X. Sun, Y. Liu, M. Xu, H. Chen, J. Han, and K. Wang, “Feature selection using dynamic weights for classification,” Knowledge-Based Systems, January 2012.
[17] W.-C. Yeh, Y.-M. Yeh, C.-W. Chiu, and Y. Y. Chung, “A wrapper-based combined recursive orthogonal array and support vector machine for classifi-cation and feature selection,” Modern Applied Science, vol. 8, p. p11, Decem-ber 2013.
[18] R. D´ıaz-Uriarte and S. A. De Andres, “Gene selection and classification of microarray data using random forest,”BMC bioinformatics, vol. 7, p. 3, June 2006.
[19] Y. K. Jain and S. K. Bhandare, “Min max normalization based data pertur-bation method for privacy protection,” International Journal of Computer & Communication Technology (IJCCT), vol. 2, pp. 45–50, October 2011.
[20] M. Kumar and S. Kumar Rath, “Classification of microarray data using kernel fuzzy inference system,” International Scholarly Research Notices, vol. 2014, p. 18 pages, August 2014.
[21] S. Dehuri and S.-B. Cho, “A comprehensive survey on functional link neural networks and an adaptive pso–bp learning for cflnn,” Neural Computing and Applications, vol. 19, no. 2, pp. 187–205, 2010.
[22] S. K. Nanda and D. P. Tripathy, “Application of functional link artificial neu-ral network for prediction of machinery noise in opencast mines,” Advances in Fuzzy Systems, vol. 2011, p. 4, 2011.
[23] E. F. Petricoin III, A. M. Ardekani, B. A. Hitt, P. J. Levine, V. A. Fusaro, S. M. Steinberg, G. B. Mills, C. Simone, D. A. Fishman, E. C. Kohn, et al., “Use of proteomic patterns in serum to identify ovarian cancer,” The lancet, vol. 359, pp. 572–577, February 2002.
[24] L. J. van’t Veer, H. Dai, M. J. Van De Vijver, Y. D. He, A. A. Hart, M. Mao, H. L. Peterse, K. van der Kooy, M. J. Marton, A. T. Witteveen, et al.,
Bibliography
“Gene expression profiling predicts clinical outcome of breast cancer,”nature, vol. 415, pp. 530–536, January 2002.
[25] G.-B. Huang, D. H. Wang, and Y. Lan, “Extreme learning machines: a survey,” International Journal of Machine Learning and Cybernetics, vol. 2, no. 2, pp. 107–122, 2011.
Dissemination of Work
Accepted
1. Mukesh Kumar, Sandeep Singh and Santanu kumar Rath. Classification of Microarray Data using Functional Link Neural Network. 3rd International Conference on Recent Trends in Computing (ICRTC-2015),Ghaziabad, In-dia, 2015.
Communicated
1. Mukesh Kumar, Sandeep Singh and Santanu kumar Rath. Classification of Microarray Data using Extreme Learning Machine Classifier. International Journal of Information Processing, (IJIP),2015.