ValpoScholar
Mathematics and Statistics Faculty Publications
Department of Mathematics and Statistics
5-7-2018
Predicting Graph Categories from Structural
Properties
James P. Canning
SUNY Geneseo
Emma E. Ingram
University of Alabama
Sammantha Nowak-Wolff
Valparaiso University
Adriana M. Ortiz
University of Puerto Rico
Nesreen K. Ahmed
Intel Labs
See next page for additional authors
Follow this and additional works at:
https://scholar.valpo.edu/math_stat_fac_pubs
This Article is brought to you for free and open access by the Department of Mathematics and Statistics at ValpoScholar. It has been accepted for inclusion in Mathematics and Statistics Faculty Publications by an authorized administrator of ValpoScholar. For more information, please contact a ValpoScholar staff member [email protected].
Recommended Citation
Canning, James P.; Ingram, Emma E.; Nowak-Wolff, Sammantha; Ortiz, Adriana M.; Ahmed, Nesreen K.; Rossi, Ryan A.; Schmitt, Karl R. B.; and Soundarajan, Sucheta, "Predicting Graph Categories from Structural Properties" (2018).Mathematics and Statistics
Faculty Publications. 53.
James P. Canning, Emma E. Ingram, Sammantha Nowak-Wolff, Adriana M. Ortiz, Nesreen K. Ahmed, Ryan
A. Rossi, Karl R. B. Schmitt, and Sucheta Soundarajan
James P. Canning
SUNY GeneseoEmma E. Ingram
University of AlabamaSammantha Nowak-Wolff
Valparaiso UniversityAdriana M. Ortiz
University of Puerto RicoNesreen K. Ahmed
Intel LabsRyan A. Rossi
Adobe ResearchKarl R. B. Schmitt
Valparaiso UniversitySucheta Soundarajan
Syracuse UniversityABSTRACT
Complex networks are often categorized according to the underly-ing phenomena that they represent such as molecular interactions, re-tweets, and brain activity. In this work, we investigate the prob-lem of predicting the category (domain) of arbitrary networks. This includes complex networks from different domains as well as syn-thetically generated graphs from five different network models. A classification accuracy of 96.6% is achieved using a random forest classifier with both real and synthetic networks. This work makes two important findings. First, our results indicate that complex networks from various domains have distinct structural properties that allow us to predict with high accuracy the category of a new previously unseen network. Second, synthetic graphs are trivial to classify as the classification model can predict with near-certainty the network model used to generate it. Overall, the results demon-strate that networks drawn from different domains (and network models) are trivial to distinguish using only a handful of simple structural properties.
CCS CONCEPTS
•Mathematics of computing→Graph algorithms;
Combina-torics;Graph theory; •Information systems→Data mining;
•Computing methodologies→Machine learning;Artificial intelligence;Logical and relational learning; •Networks→ Network types;
KEYWORDS
Network classification, network categorization, graph classifica-tion, graph features, structural properties, across-domain graph classification, network science, complex networks.
1
INTRODUCTION
Networks are often categorized according to the underlying phe-nomena that they represent, such as re-tweets, brain activity, or web page links. While there are inherent commonalities in net-work structure across different domains (e.g., a power law degree distribution), it is also generally believed that networks from differ-ent categories have inherdiffer-ently unique network characteristics. In this work, we find strong evidence supporting this hypothesis by learning a multiclass classification modelf : x →y that is able
toaccuratelypredict (with 96.6% accuracy) the category of a new
arbitrary networkG′described only by aD-dimensional feature
vectorx′wherey∈ {1,2, . . . ,K}is the class label representing the category of a graph,i.e., domain of a complex network or network model of a synthetically generated graph. The multiclass classifica-tion modelf is learned using 785 networks fromK=13 categories (See Figure1) which are characterized using onlyD=12 simple structural features, such as average degree, total number of trian-gles, and edge density. We also investigate a classification model that uses onlyD =4 features for predicting the category of un-known networks. The structural features were selected since they are computationally efficient to compute for large networks while also being the most basic fundamental properties of networks that allow us to accurately predict the category (domain) of a previously unseen network. Obviously, more complex structural features such as those based on graphlets (network motifs) [2,36] are likely to further improve the accuracy. However, such complex structural features are computationally expensive to compute, but most im-portantly, the results in this work indicate that they are not needed to accurately predict the categories (domains) of networks. In other words, we observe that networks from different domains can be accurately distinguished using only the most basic and fundamental structural properties. The findings of this work were first published in September 2017 as a short paper, see [14].
Most previous research has focused on either (i) classification of synthetic graphs [11] or (ii) graphs within a particular category (domain) such as molecular graphs [30,41,54]. Other examples include distinguishing between brain or breast cancer cells [32] or distinguishing between different social structures [51]. One of the challenges of network classification is collecting a sufficient amount of data to classify. For this reason, most work on network similarity and graph classification have used synthetically gener-ated graphs [10], as these can easily be created and customized. Alternatively, research using real-world networks has largely used graphs from the same domain such as chemical compounds or protein interactions [24,32]. In those domains, generating a large number of graphs from the similar phenomenon is still relatively simple. Central to both resesarch themes is the investigation of new or different similarity measures. A review of many different similarity measures and their motivations can be found in [50].
In this work, we investigate the problem of predicting the do-main (category) of arbitrary networks using a small set of graph features. This allows us to study questions such as whether network categories are distinguishable from one another (using both real complex networks from a variety of domains and synthetic graphs from network models), and which network properties are most
1
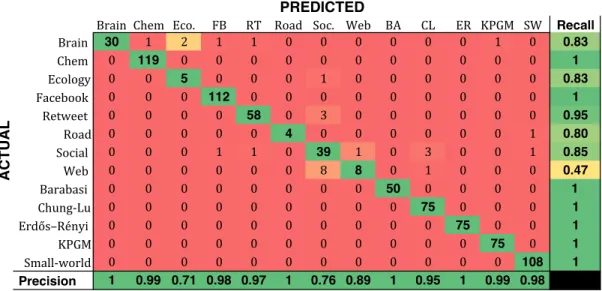
Brain Chem Eco. FB RT Road Soc. Web BA CL ER KPGM SW Recall Brain 30 1 2 1 1 0 0 0 0 0 0 1 0 0.83 Chem 0 119 0 0 0 0 0 0 0 0 0 0 0 1 Ecology 0 0 5 0 0 0 1 0 0 0 0 0 0 0.83 Facebook 0 0 0 112 0 0 0 0 0 0 0 0 0 1 Retweet 0 0 0 0 58 0 3 0 0 0 0 0 0 0.95 Road 0 0 0 0 0 4 0 0 0 0 0 0 1 0.80 Social 0 0 0 1 1 0 39 1 0 3 0 0 1 0.85 Web 0 0 0 0 0 0 8 8 0 1 0 0 0 0.47 Barabasi 0 0 0 0 0 0 0 0 50 0 0 0 0 1 Chung-Lu 0 0 0 0 0 0 0 0 0 75 0 0 0 1 Erdős–Rényi 0 0 0 0 0 0 0 0 0 0 75 0 0 1 KPGM 0 0 0 0 0 0 0 0 0 0 0 75 0 1 Small-world 0 0 0 0 0 0 0 0 0 0 0 0 108 1 Precision 1 0.99 0.71 0.98 0.97 1 0.76 0.89 1 0.95 1 0.99 0.98 ACTUAL PREDICTED
Figure 1: Classification results. The classification model is able to accurately predict with96.6%accuracy the category/domain of arbitrary unknown networks. These results are from a random forest classifier, however, similar results were obtained with other base classifiers.
useful for distinguishing the categories. To answer this question we learn a random forest classifier using real and synthetic net-works and use it to predict the domain of new previously unseen networks. Using this model, we achieve a classification accuracy of 96.6% for predicting the domain (or network model) of both real complex networks and synthetically generated graphs. Overall, the results indicate that networks drawn from different domains and network models are trivial to distinguish using only a handful of simple structural properties. Additionally, the classification mod-els also highlighted networks that are outliers within their own categories, suggesting new potential directions for understanding those networks.
This work makes two important findings:
(1) Real-world networks from various domains have distinct structural properties that allow us to predict with high ac-curacy the category of an arbitrary network.
(2) Synthetic graphs are trivial to classify as the classification model can predict with near-certainty the network model used to generate the synthetic graph.
2
MATERIALS AND METHODS
This section presents the approach and experimental setup, includ-ing a description of the large collection of graph datasets and their categories, the graph features derived from the networks, and the models used for prediction.
2.1
Network collections & data
Data was obtained from the Network Repository (NR) [43] for all non-synthetic graphs.1This included 1241 graphs. Of the network categories included on NR, three were from computational and algorithmic challenges (DIMACS, DIMACS10 and BHOSLIB) and
1http://networkrepository.com/
two recorded graphs over time (temporal reachability, dynamic networks). As all five of these categories are fundamentally different from static networks from a discipline or field they were discarded as outside the problem scope. Finally, the cheminformatics category (containing graphs describing chemical bonds between atoms) had significantly more instances than all other categories and therefore was downsampled to 119 networks which is comparable to the 2nd largest category. In addition to this large collection of real-world networks, we also generated 383 synthetic graphs. These synthetic graphs were generated from 5 different graph models including:
• 75 using the Chung-Lu (CL) graph model [15]
• 75 using the Kronecker Product Graph Model (KPGM) [31] • 108 using the Watts-Strogatz small-world (SW) graph model [55] • 50 using the Barabási-Albert (BA) model [6]
• 75 using the Erdős-Rényi (ER) model [18]
These five different graph models and the specific parameters used to generate graphs from each of them are described below. The final classification data set has 785 graphs from 13 categories. A list of the network categories are provided in Figure1.
Data Availability & Exploration: The network classification data used in this study is accessible online:
http://networkrepository.com/data/nc.csv
We also created an interactive graph visual analytics tool [4] to explore the network classification data in real-time over the web. This tool can be accessed at:
http://networkrepository.com/network- classification.
2.2
Synthetic graph models & settings
We describe the 5 different graph models used in this work below and discuss the graph model parameters used for each graph model. Chung-Lu Graph Model: The Chung-Lu (CL) graph model [15] generates a synthetic graph with a given expected degree sequence.
Given a vector of expected degreesw = w1 w2 · · · wn, an edge is created between nodeiandjwith probability
pi j=
wiwj Í
kwk
(1)
The expected degrees are based on the power law model with exponentθ. We generate CL graphs with the following parameters:
θ ∈ {1.7,1.8,1.9,2.0,2.1}and
n∈ {102,103,104,105,106} is the number of nodes.
Kronecker Product Graph Model: For the Kronecker product graph model (KPGM) [31], we follow the same methodology as de-scribed in [23]. In particular, the initiator matrix used is:0.57 0.19
0.19 0.05
. The number of nodes isn=2kwherek∈ {8,10,12,14,16}and the number of edges isα·nwhereα ∈ {8,10,12,14,16}. We repeat each combination ofkandαthree times to generate a total of 75 Kronecker graphs.
Watts-Strogatz small-world graphs: We also use synthetic graphs generated by the Watts-Strogatz small-world graph model [55]. This model creates a ring overnnodes then joins each node to its
knearest neighbors. Edges are randomly rewired with a constant probabilityp. For these graphs, we usen∈ {100,1,000,10,000},k∈ {3,4,5,6}, and randomly rewire the edges withp∈ {0.1,0.2,0.3}. We repeat each combination of parameters(n,k,p)three times to generate a total of 108 small-world networks.
Barabasi-Albert preferential attachment graphs: The Barabasi-Albert (BA) preferential attachment model [6] matches expected scale-free degree distributions. The BA graph model starts with a connected network of one or more nodes and then adds nodes one at a time such that each new node is connected toσexisting nodes with a probability proportional to the number of links already ex-isting in the graph. Thus, the new node has a preference to connect up to nodes that already have large degrees. More formally, the probabilitypi of a new node forming an edge with nodeiis:
pi=Íki jkj
(2)
whereki denotes the degree of nodeiandÍ
jkjdenotes the sum of degrees from all nodes that currently exist in the graph. We generated 25 BA graphs with 1,000 nodes and another 25 with 10,000 nodes for a total of 50 BA graphs. To select the number of edgesσto create between a new node and the existing nodes in the graph, we examined the the average degrees and number of edges in the real-world data and chose values that would make the synthetic BA networks “blend" in with the real-world networks. We generated 25 BA graphs with 1,000 nodes usingσ∈ {10,40,60}and another 25 BA graphs with 10,000 nodes usingσ ∈ {40,60,100}. Graphs with 100,000 nodes were excluded due to limits on computational resources available.
Erdős-Rényi graph model: Let er(n,p)denote an Erdős-Rényi (ER) [18] graph that arises from fixingnnodes and generating edges independently with probabilityp. Thus, the expected degree for each node is simplyp(n−1). We generate three sets of 25 Erdős-Rényi graphs such that each set of 25 graph has a different number of nodes, that is,n∈ {1000,10000,100000}. This gives a total of 75
ER graphs. To select the probabilitypthat an edge exists between two nodes in the ER model, we looked at the densities of different sizes of graphs and chosepsuch that the resulting ER graph would have a similar density to the real-world networks used in this study. For graphs with 1,000 nodes we usedp∈ {0.05,0.1,0.2}; for graphs with 10,000 nodes we usedp∈ {0.0005,0.005,0.001}; and for graphs with 100,000 nodes we usedp∈ {0.0005,0.00005,0.000005}.
2.3
Graph features
In this work, we are interested in finding the simplest graph features that allow us to predict with high accuracy the domain (category) of each network data set. We represent each graph dataset using onlyD=12 simple structural features. The features used for classi-fication are defined below. Although one could use more complex features, such as graphlet-based features [2], we find that the simple properties that we consider are sufficient to achieve a high classifi-cation accuracy. Nevertheless, our results do not depend on the use of these more complex features. All graph features are normalized appropriately using min-max scaling before using them to train the classification models. In particular, eachD-dimensional feature vectorxis scaled as follows:
ˆ
x= x−min(x)
max(x)−min(x)
(3)
This ensures the feature values in ˆx∈RDare between zero and one. Similar results were observed using other norms. As an aside, we also tried normalizing each feature independently and did not observe any obvious benefit.
Graph feature definitions: The definitions of the graph features used in this work are provided below [37,52]. LetG=(V,E)be a graph with|V|nodes and|E|edges. Further, letΓi ={j | (i,j) ∈E} denote the set of nodes adjacent to nodei∈V anddi =|Γi|is the degree of nodei.
• Density: The density of a graphGdenoted asρ(G)is the ratio of edges in the graph to the amount of possible edges. • Maximum degree: The maximum degree is the largest node degree inGdefined as∆(G)=max{d1,d2, . . . ,d|V|}where di is the degree of nodei ∈V,i.e., the number of nodes adjacent to nodeiin the graph (neighbors of nodei). • Minimum degree: The minimum degree inGis defined as
δ(G) = min{d1,d2, . . . ,dN}. If there are nodes not
con-nected to any other, the minimum degree is 0.
• Average degree: The average degree over all nodes in a graphGis defined asdavg =
1
|V| Í
idi wheredi =|Γi|is the degree of nodei.
• Assortativity coefficient: The assortativity coefficient cap-tures the tendency of nodes to connect to other nodes with similar degree, or in contrast, the tendency of dissimilar nodes to connect [38]. More formally, the assortativity coef-ficient of a graphGis defined as
r(G)= |E| −1Í (i,j)∈Edidj− |E|−1Í (i,j)∈E 1 2(di+dj) 2 |E|−1Í (i,j)∈E 1 2(d 2 i+d 2 j) − |E|−1Í (i,j)∈E 1 2(di+dj) 2 (4)
wheredianddj are the degrees of the nodes at the ends of the edge(i,j) ∈E. The summations in Eq.4are obviously over the set of edgesEand thus is linear in the number of edges takingO(|E|)time to compute.
•Total triangles: A triangle is a complete subgraph with ex-actly three vertices (3-clique). The total number of triangles in a graphGis the sum of all such triangles inGdefined as
T(G)=1 3
Í
e=(i,j)∈E|Γi∩Γj|.
•Average triangles: Average number of triangles formed by the edges inG. More formally, letTedenote the number of triangles containing edgee = (i,j) ∈ E, thenTavg =
1
|E| Í
e∈ETe.
•Maximum triangles: The maximum number of triangles centered at any edge in the graphGdefined asTmax =
maxe∈ETewhereTe =|Γi∩Γj|is the number of triangles containing edgee=(i,j) ∈E.
•Average clustering coefficient: The clustering coefficient of a graph quantifies how a node in a graph tends to cluster together [55]. More formally, the local clustering coefficient of a nodei ∈V isCi =Ti/Wi whereTi is the number of triangles centered at nodeiandWi=di(di−1)/2 (paths of length two centered ati). Thus, the average local clustering coefficient ofGis defined asC(G)= 1
N Í
i∈VCi.
•Fraction of closed triangles (global clustering coefficient) [39]: LetT(G)denote the number of triangles inGand letW(G) denote the number of wedges (two-star paths), then the global clustering coefficient (density of triangles inG) is defined asκ(G)=T(G)/W(G).
•Maximum k-core: A k-core ofGis a maximal subgraph of
Gsuch that for all vertices in the subgraph, the degree is greater or equal tok. The maximum k-core ofGis the largest k and denoted byK(G).
•Maximum clique (lower-bound): The maximum clique size is defined asω(G)=max{|P|: P is a clique inG}whereP is a clique inGsuch that every pair of vertices(u,w) ∈Pare connected by an edge forming a complete subgraph. In this work, we use a heuristic clique finder that has been shown to often find the largest such clique inG[46].
2.4
Models
GivenNtraining graphsxi,yi N
i=1
where eachxi ∈RDis aD -dimensional feature vector forGi andyi ∈ {1,2, . . . ,K}is the class label (category/domain) ofGi, we learn a multiclass classification modelf : x → y. This classification model is used to predict the category (domain) of a new arbitrary unknown networkG′ described only by aD-dimensional feature vectorx′. The category refers to the problem domain or area for real-world networks. For synthetic graphs a category refers to the specific graph model (i.e., synthetic graph generator) used to generate a given graph. In this work, we focus on learning a classification modelf using random forests (RF) [13],i.e., an ensemble of decision trees where each decision tree is learned using a randomly selected subset of features. We also considered Gaussian Naïve Bayes (GNB) [19], support vector machines (SVM) [16] and logistic regression (LR) [9]. Notably, these multiclass classification models all performed very similar to random forests and therefore were removed for brevity. Random forests are favored since they performed slightly better than the other models while also being based on decision trees which are simple, efficient, and easy to interpret.
The classification model was trained usingN=785 networks fromK=13 categories (See Figure1) which are characterized by
D=12 structural features. We also investigate a classification model that uses onlyD=4 features. For evaluation, we use leave one out cross validation (LOOCV) [19]. LOOCV progressively removes each data point, trains the model then attempts to classify the removed data-point. LOOCV was selected over the more standard k-fold validation due to the small number of networks available to us in some network domains.
3
RESULTS
Prediction results:To answer the question of whether the cate-gory of an unknown network can be accurately predicted, we learn a multiclass classification modelf using simple graph features and use it for prediction. The full classification results usingD =12 graph features are provided in Figure1, including precision and recall for each category of networks. Notably, we achieve 96.6% ac-curacy in classification using a random forest model. These results support several important findings. First, we find that standard classification algorithms are able to accurately predict the category (domain) of both real-world networks and synthetically generated graphs. Second, we observe that synthetically generated graphs from 5 different synthetic graph models are easily distinguishable from real-world networks as shown in Figure1. For instance, the synthetic graphs are distinct enough from their real-world coun-terparts that only seven other networks are classified as either BA, CL, ER, KPGM, or SW. Nevertheless, we are able to correctly pre-dict that a graph is a synthetic graph 100% of the time, but more importantly, we can even predict the specific graph model that it arises from with 100% accuracy across all 5 different synthetic graph models. In other words, the synthetically generated graphs generated by the different graph models are themselves easy to distinguish between. For example, the structure of KPGM graphs are fundamentally different from CL graphs. Furthermore, we are also able to correctly classify that an arbitrary graph is not only
syntheticor not, but also the specific graph model used to generate
it. This observation indicates that synthetic graphs derived from these graph models have low variance, and thus form tightly-knit clusters that are structurally distinct from other synthetic graphs as well as real-world networks. This result is surprising since syn-thetic graph generators are usually evaluated based on whether they preserve the properties of real-world networks (e.g., see [31]). Careful analysis of the mislabeled graphs in Figure1provides interesting network/category specific findings and suggestions. For example, 10 of the 36 brain networks are non-human, and all 6 graphs that are mislabeled in Figure1are non-human. This is strong evidence that either the human brain networks are truly distinct from the non-human brain networks, or the network discovery process is not sufficiently standardized for brain networks. Another interesting observation is that a visual inspection of the graphs mislabeled as retweet networks show surprising similarities to one another. This suggests that in addition to predicting the domain of arbitrary networks, classification models can also provide valuable insight into alternative research techniques for crossing disciplines. We now investigate the following question: What is the small-est most basic set of graph features that can be used to accurately
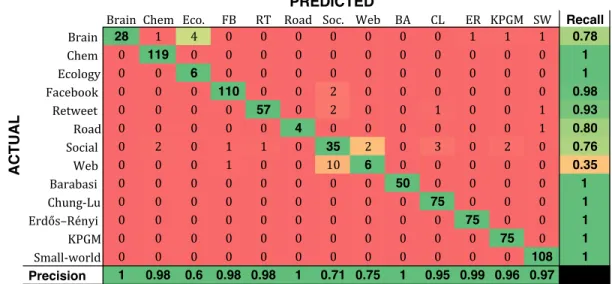
Brain Chem Eco. FB RT Road Soc. Web BA CL ER KPGM SW Recall Brain 28 1 4 0 0 0 0 0 0 0 1 1 1 0.78 Chem 0 119 0 0 0 0 0 0 0 0 0 0 0 1 Ecology 0 0 6 0 0 0 0 0 0 0 0 0 0 1 Facebook 0 0 0 110 0 0 2 0 0 0 0 0 0 0.98 Retweet 0 0 0 0 57 0 2 0 0 1 0 0 1 0.93 Road 0 0 0 0 0 4 0 0 0 0 0 0 1 0.80 Social 0 2 0 1 1 0 35 2 0 3 0 2 0 0.76 Web 0 0 0 1 0 0 10 6 0 0 0 0 0 0.35 Barabasi 0 0 0 0 0 0 0 0 50 0 0 0 0 1 Chung-Lu 0 0 0 0 0 0 0 0 0 75 0 0 0 1 Erdős–Rényi 0 0 0 0 0 0 0 0 0 0 75 0 0 1 KPGM 0 0 0 0 0 0 0 0 0 0 0 75 0 1 Small-world 0 0 0 0 0 0 0 0 0 0 0 0 108 1 Precision 1 0.98 0.6 0.98 0.98 1 0.71 0.75 1 0.95 0.99 0.96 0.97 PREDICTED ACTUAL
Figure 2: Classification results using only 4 features. The random forest classification model is learned using 4 simple and computationally efficient features. Despite using only 4 features, we are able to accurately predict with95.3%accuracy the category (domain) of arbitrary networks. Furthermore, the difference in classification performance compared to the previous model using 12 features is small,e.g.,96.5%accuracy is achieved with 12 features compared to95.3%accuracy using only 4 features.
predict the category (domain) of an arbitrary unknown network? The accuracy, recall and precision should be close to the previous model learned that uses the set of 12 features (Figure2). We learn a random forest model using only densityρ(G), average degree
davg, assortativityr(G), and maximum k-core numberK(G)as
fea-tures. Classification results using only these four simple features are provided in Figure2. The overall classification accuracy is 95.3%. Importantly, the results in Figure2indicate that a networks domain can be accurately predicted with only a few features that are all computationally efficient with a time complexity of at mostO(|E|). Notice the difference in accuracy, recall, and precision compared to Figure1is small. In this experiment, we removed the features that tend to correlate with the size of the network such as the maximum degree and total triangles. This provides additional evidence that different categories of networks from a variety of domains have distinct structural properties that can be used to learn a model to accurately distinguish between them. Observe that we are still able to correctly classify all the synthetic graphs that arise from the 5 different synthetic graph models. Furthermore, the classification recall for prediction of ecology networks actually improves using these 4 simple features.
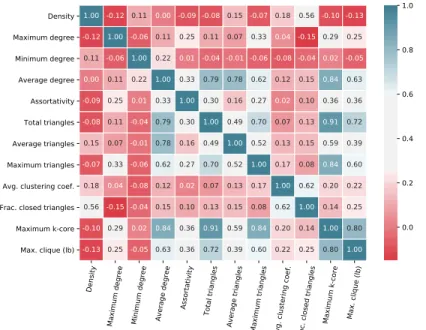
Feature analysis:To gain further understanding of the previous classification results, we analyze the possible correlations between the features and network categories below. To understand the potential correlations between the graph features, we measure the pairwise Pearson correlation between each pair of features
C = Φ⟨xi,xj⟩, ∀i,j whereCis aD×Dsymmetric correlation matrix,Φis a similarity function which in this case is Pearson cor-relation. The correlation matrix is shown in Figure3where 1 is a positive linear correlation, 0 is no correlation, and -1 is negative correlation. One important finding from Figure3is that many of
the features are either not correlated at all (i.e.,Ci jis close to 0) or weakly correlated.
There are a few notable exceptions including total triangles
T(G)and the maximum k-core number of a graphGdenoted by
K(G). Note thatK(G)provides an upper bound on the maximum clique. Meanwhile, the more triangles that exist in the graph, the more likely a larger clique is to form inG[45]. A triangle is also a 3-node clique, and thus larger cliques are obviously made up of a lot of smaller 3-node triangles. We also observe weaker correlation between a few other graph features. For instance, the maximum cliqueω(G) and maximum k-core numberK(G)are somewhat cor-related with the average degreedavgand average trianglesTavg. In
addition, the maximum k-core numberK(G)is somewhat corre-lated with the maximum number of trianglesTmax. This suggests
that these features contain potentially redundant information and are reasonable candidates for removal.
To understand the correlations between thenetwork categories using these simple graph features, we use a centroid feature vector ¯
xifor each network categoryi. More formally, letX=x1 x2 · · ·xN
i
be the graph feature matrix for network categoryi, and letNi de-note the number of networks in categoryi, then the centroid feature vector ¯xi for network categoryiis:
¯ xi = 1 Ni Ni Õ j xj = x1+x2+· · ·+xN i (5)
where ¯xiis aD-dimensional centroid feature vector for network categoryi. The above is repeated for each network category. Af-terwards, we measure pairwise Pearson correlation between each pair of centroid graph feature vectors for each network category
C = Φ⟨x¯i,¯xj⟩, ∀i,j whereCis aK×Ksymmetric correlation matrix andΦis the Pearson correlation function. The network
Densi ty Maxim um de gree Minim um de gree Avera ge de gree Asso rtativ ity Total trian gles Avera ge tr iangle s Maxim um tr iangle s Avg. cluste ring c oef. Frac. close d tria ngles Maxim um k-core Max. cliqu e (lb) Density Maximum degree Minimum degree Average degree Assortativity Total triangles Average triangles Maximum triangles Avg. clustering coef. Frac. closed triangles Maximum k-core Max. clique (lb) 1.00 -0.12 0.11 0.00 -0.09 -0.08 0.15 -0.07 0.18 0.56 -0.10 -0.13 -0.12 1.00 -0.06 0.11 0.25 0.11 0.07 0.33 0.04 -0.15 0.29 0.25 0.11 -0.06 1.00 0.22 0.01 -0.04 -0.01 -0.06 -0.08 -0.04 0.02 -0.05 0.00 0.11 0.22 1.00 0.33 0.79 0.78 0.62 0.12 0.15 0.84 0.63 -0.09 0.25 0.01 0.33 1.00 0.30 0.16 0.27 0.02 0.10 0.36 0.36 -0.08 0.11 -0.04 0.79 0.30 1.00 0.49 0.70 0.07 0.13 0.91 0.72 0.15 0.07 -0.01 0.78 0.16 0.49 1.00 0.52 0.13 0.15 0.59 0.39 -0.07 0.33 -0.06 0.62 0.27 0.70 0.52 1.00 0.17 0.08 0.84 0.60 0.18 0.04 -0.08 0.12 0.02 0.07 0.13 0.17 1.00 0.62 0.20 0.22 0.56 -0.15 -0.04 0.15 0.10 0.13 0.15 0.08 0.62 1.00 0.14 0.25 -0.10 0.29 0.02 0.84 0.36 0.91 0.59 0.84 0.20 0.14 1.00 0.80 -0.13 0.25 -0.05 0.63 0.36 0.72 0.39 0.60 0.22 0.25 0.80 1.00 0.0 0.2 0.4 0.6 0.8 1.0
Figure 3: Graph feature correlations. To understand the correlations between the graph features, we measure pairwise Pearson correlation between each pair of featuresC=Φ⟨xi,xj⟩, ∀i,jwhereCis aD×Dsymmetric correlation matrix andΦis the Pearson
correlation function.
category correlation matrix is provided in Figure4. There are a few interesting observations from Figure4. Notably, we see that social networks and web graphs appear strongly correlated, which provides additional evidence for this observation mentioned earlier. We also find that cheminformatics networks appear to be correlated with ecology networks when Pearson correlation is used, which is somewhat surprising. Finally, we also notice a strong negative correlation between retweet networks and road networks.
Brain Netw orks Chem inform atics Ecolo gy Ne twork s Road Netw orks Face book Netw orks Retw eet Ne twork s Socia l Netw orks Web G raphs Brain Networks Cheminformatics Ecology Networks Road Networks Facebook Networks Retweet Networks Social Networks Web Graphs 1.00 -0.52 -0.30 -0.25 -0.13 0.22 -0.56 -0.52 -0.52 1.00 0.80 -0.24 0.25 0.21 -0.21 -0.04 -0.30 0.80 1.00 -0.23 0.35 0.59 -0.16 -0.07 -0.25 -0.24 -0.23 1.00 0.30 -0.74 0.13 -0.04 -0.13 0.25 0.35 0.30 1.00 -0.02 0.11 0.20 0.22 0.21 0.59 -0.74 -0.02 1.00 0.01 0.10 -0.56 -0.21 -0.16 0.13 0.11 0.01 1.00 0.90 -0.52 -0.04 -0.07 -0.04 0.20 0.10 0.90 1.00 −0.6 −0.3 0.0 0.3 0.6 0.9
Figure 4: Network category correlations. To understand the potential structural similarities between the different net-work categories (domains), we derive a centroid feature vec-tor for each network category and measure pairwise Pear-son correlation.
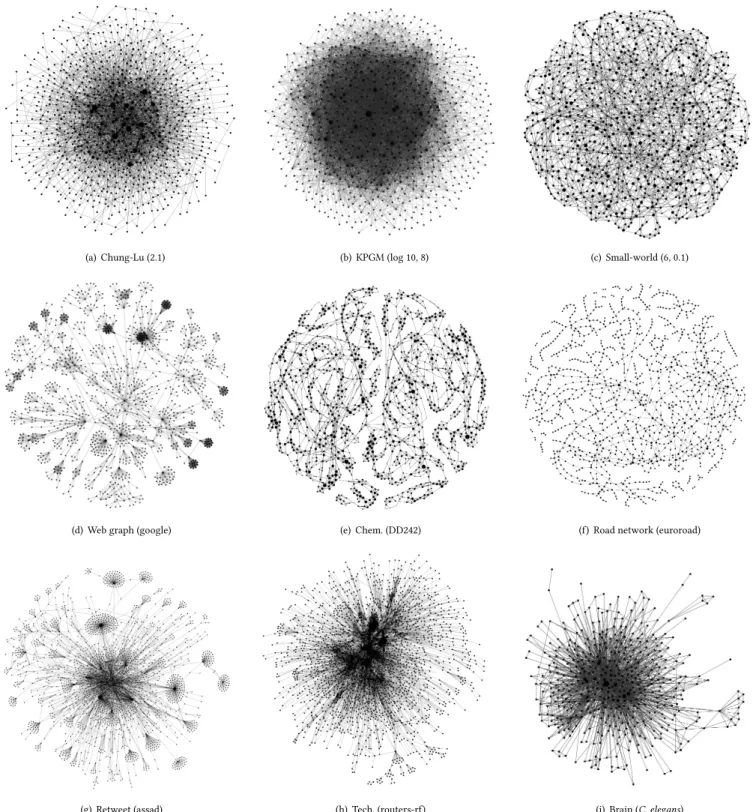
Visual comparison of networks:Figure5visually compares net-works from different domains and graph models using node-link visualizations. Obviously, the goal of any synthetic graph model is to generate networks that closely match the structure of real-world networks. In other words, they seek to generate realistic networks that preserve the known structural properties of networks observed in the real-world. We observe that synthetic graphs shown in Fig-ure5(a)-5(c)do not resemble any of the real-world networks in Figure5(d)-5(i)from six different domains. Most of these synthetic graph generators are able to generate graphs with realistic and expected degree distributions, but fail to capture other key struc-tural properties that are important in distinguishing the real-world networks. For instance, we observe in Figure5(d)that web graphs have many large cliques representing a tightly-knit communities of web pages while also containing large stars that representing important hub web pages that connect the web surfer to important web pages. Other important structural patterns can be observed in the other networks from different domains (Figure5).
4
RELATED WORK
Related research is categorized into four areas: (1) within-domain graph classification, (2) synthetic graph classification, (3) graph sim-ilarity and matching, and (4) graph feature learning and extraction methods.
Within-domain graph classification: Most previous work has focused on classification of graphs within a particular category (domain) such as molecular graphs [20,21,30,33,41,54]. Other examples include distinguishing between brain or breast cancer cells [32] or distinguishing between different social structures [51].
(a) Chung-Lu (2.1) (b) KPGM (log 10, 8) (c) Small-world (6, 0.1)
(d) Web graph (google) (e) Chem. (DD242) (f ) Road network (euroroad)
(g) Retweet (assad) (h) Tech. (routers-rf ) (i) Brain (C. elegans)
Figure 5: Comparing the structure of networks from different domains and network models visually using node-link diagrams. In (a)-(c), we visualize the structure of three synthetically generated networks from different graph models whereas (d)-(i) are from different domains. Notice road networks (f) typically have long chains (paths) with small maximum degrees, and that retweet networks (g) consist of mainly large stars while web graphs (d) have large stars and large cliques.
This previous work tries to classify graphs from the same cate-gory/domain into subcategories (or types). We call this problem the
within-domain graph classification problem. However, in this work
we focus on theacross-domain graph classification problemas well as predicting the underlying network model (generative process) used to generate a particular synthetic graph. Another key difference is that most research in this area has focused on developing more ac-curate and better algorithms for the within-domain graph classifica-tion problem. For instance, Gärtneret al.[21] proposed an approach based on graph kernels. There has been numerous other work fo-cused on deriving new graph kernels for within-domain graph classification [20,33,41,48,54]. More recently, Shervashidzeet al.[49] proposed more efficient graphlet kernels for within-domain graph classification.
Synthetic graph classification: Another related area of research deals with classification of synthetic graphs according to the syn-thetic generator that produced them [11]. However, most work in this area has simply used synthetic graphs as a way to evalu-ate/benchmark a proposed method. For instance, Bonneret al.[11] proposes a new approach called deep topology classification and evaluates the proposed method using synthetic graphs. Other work that used synthetic graphs for evaluation has mainly focused on parallel algorithms for comparing such graphs [12]. However, in this work we investigate whether we can classify synthetic graphs using standard classification models with simple graph features. In particular, we find that such graphs are trivial to classify and that synthetic graphs from a particular generator forms a tight cluster with extremely small variance, which makes these graphs trivial to classify correctly. This result is significant as it implies that using synthetic graphs for evaluation as done previously should be done with extreme caution. Moreover, this finding also highlights the limitations and problems of existing graph models and synthetic graph generation algorithms. In particular, one obvious problem is that the graphs generated from such models have extremely low variance and essentially all appear to be extremely similar. More importantly, the goal of synthetic graph models is to derive syn-thetic graphs that are very similar to real-world graphs (e.g., for use in simulations, algorithm benchmarking, etc.) and therefore the observations made in our work highlight the inability of these models for deriving graphs that appear similar to any category of real-world networks investigated.
Graph similarity & matching: Recent research has focused on measuring the similarity between graphs from the same do-main [1,22,42,44,56]. There has also been a lot of work on graph matching and network alignment [26,27,29,34,35]. Koutraet al.[28] proposed a fast graph alignment method for aligning large bipartite graphs. Other work has focused on fast and parallel algo-rithms for the matching problem [27] as well as parallel approxima-tion algorithms for network alignment [26]. There has also been a lot of work on graph matching using graphlet and network motif features [29,34,35]. More recently, Soundarajanet al.[50] reviewed many different graph similarity measures for comparing graphs. Other work by Aliet al.[7] has focused on sub-sampling techniques for network comparison whereas Onnelaet al.[40] presented a tax-onomy of networks based on community structures. However, all of this work focuses on fundamentally different problems. In contrast,
this paper investigates whether or not the domain (category) of an arbitrary network can be predicted accurately. Recent work by Ikehara [25] analyzed networks from different domains and found some to be difficult to distinguish based on structure alone. This observation is in contrast to our own work, which demonstrates that the domain of most networks can be accurately predicted with 96.6% accuracy. More importantly, that work mainly focused on un-derstanding andanalyzingthe differences between networks from different domains, while our goal is to study whether the domain (category) of a network can bepredictedusing a multiclass classifica-tion model with simple graph features. While Ikehara [25] analyzes networks usingcomplex graphlet features[3], our work shows that
simple graph featuresare sufficient topredictthe category of
net-works. Additionally, Ikehara [25] studies thebinary classification
problembetween 6 different network categories, whereas we focus
on the more important and challengingmulticlass classification
problembetween 13 different categories of networks. As an aside,
since Ikehara [25] focused on binary classification they had to care-fully handle the class imbalance problem, whereas in this work it is less of an issue since we focus on multiclass classification [8,53].2
Graph feature learning & extraction: There are also many methods for automatically learning a graph feature representa-tion [5,17,30,48]. Most methods are not inductive and explicitly assume that the graphs are from the same domain and the node identifiers used in the various graphs are consistent. More recently, inductive methods for learning graph feature representations have been proposed [47]. These methods allow the learned features to be transferred across networks and thus can be used for classifying graphs from different domains (which is the problem investigated in this work).
5
CONCLUSION
In this work, we investigated whether the domain or generative process of a complex network can be accurately predicted using only a handful of simple graph features. Our results indicate that networks drawn from different domains (and network models) are trivial to distinguish using only a few graph features. In particular, we achieve 96.6% accuracy using a simple random forest model to predict the domain and/or generative process governing the forma-tion of the network. The full classificaforma-tion results are provided in Figure1, including precision and recall for each category of net-works. We also achieved an accuracy of 95.3% when using a reduced feature vector of only 4 features, with similar details provided in Fig-ure2. This implies that real-world complex networks from various domains have distinct structural properties (acting as a signature) that allow us to predict with high accuracy the domain (category) of an arbitrary network. Furthermore, synthetic graphs are trivial to classify as the model can predict with near-certainty whether a
2
For instance, in binary classification, if the majority of points are of one class, then one can achieve a reasonable accuracy by simply predicting all points to be of the majority class. However, in multiclass classification, if we were to predict the majority class for each point, then we would achieve very poor accuracy since we predict the class (category) of around 800 graphs, and the largest class in our data consists of only about 100 points, and therefore we would achieve an accuracy of less than 20% if the classification model simply predicted all points as the majority class.
graph is synthetic or not but more importantly the network model used to generate the synthetic graph.
Extension of work:The results and findings in this work also have a variety of practical applications beyond expanding our un-derstanding of real-world complex networks and synthetic graph models. In particular, the models learned in this work to accurately predict the category (domain) of a network can be used in network data repositories (data archives) such as NetworkRepository [43]. For instance, suppose a user donates an arbitrary network, we can then use the multiclass classification models to recommend a cate-gory (domain) and possibly other metadata that was not provided by the user. In addition, we can use the results of this work to rec-ommend “structurally related networks” to users. For instance, if a user is analyzing a particular network using the interactive visual graph mining tools provided by NR [43], then we can automatically recommend other relevant graphs that are structurally similar to the network being analyzed by the user.
Furthermore, we are also currently using the key findings of this work to build a “graph search engine." The engine would allow users to search for graphs that are structurally similar to the graph of interest given as input by the user. In particular, given a graph
Gprovided as input by a user, we compute a few fast and efficient structural properties fromGdenoted byy. We then derive
r=K(y,xi), fori=1,2, . . . ,|G| (6) whereGis the set of graphs in our graph database (e.g., all graphs available at NR [43]);Kis a similarity function between the input graphGand each graphGi ∈ G; andr=r1 r2 · · ·
is a score vector. Eachriindicates how similarGis toGi ∈ G. Thus, we can simply sortrand return the top-kgraphs that closely resemble the input graphGprovided by the user.
ACKNOWLEDGMENTS
We thank all the reviewers for many helpful suggestions and feed-back. This research was supported by a National Science Foundation (NSF) REU grant.
REFERENCES
[1] B. Abrahao, S. Soundarajan, J. Hopcroft, and R. Kleinberg. On the separability of structural classes of communities. InProceedings of the 18th ACM SIGKDD
International Conference on Knowledge Discovery and Data Mining, pages 624–632. ACM, 2012.
[2] N. K. Ahmed, J. Neville, R. A. Rossi, and N. Duffield. Efficient graphlet counting for large networks. InInternational Conference on Data Mining, pages 1–10. IEEE, 2015.
[3] N. K. Ahmed, J. Neville, R. A. Rossi, N. Duffield, and T. L. Willke. Graphlet decom-position: Framework, algorithms, and applications.Knowledge and Information
Systems (KAIS), pages 1–32, 2016.
[4] N. K. Ahmed and R. A. Rossi. Interactive visual graph analytics on the web. In
International AAAI Conference on Web and Social Media (ICWSM), pages 566–569, 2015.
[5] N. K. Ahmed, R. A. Rossi, R. Zhou, J. B. Lee, X. Kong, T. L. Willke, and H. Eldardiry. Representation learning in large attributed graphs. InWiML NIPS, 2017. [6] R. Albert and A.-L. Barabási. Statistical mechanics of complex networks.Rev.
Mod. Phys, 74:47, 2002.
[7] W. Ali, A. E. Wegner, R. E. Gaunt, C. M. Deane, and G. Reinert. Comparison of large networks with sub-sampling strategies.Scientific reports, 6:28955, 2016. [8] M. Aly. Survey on multiclass classification methods.Neural Networks, 19:1–9,
2005.
[9] C. M. Bishop.Pattern recognition and machine learning. Springer, 2006. [10] S. Bonner, J. Brennan, I. Kureshi, G. Theodoropoulos, and A. McGough. Efficient
comparison of massive graphs through the use of graph fingerprints. InKDD
MLG Workshop, 2016.
[11] S. Bonner, J. Brennan, G. Theodoropoulos, I. Kureshi, and A. S. McGough. Deep topology classification: A new approach for massive graph classification. In
International Conference on BigData, pages 3290–3297. IEEE, 2016.
[12] S. Bonner, J. Brennan, G. Theodoropoulos, I. Kureshi, and A. S. McGough. GFP-X: A parallel approach to massive graph comparison using spark. InInternational
Conference on Big Data, pages 3298–3307. IEEE, 2016. [13] L. Breiman. Random forests.Machine Learning, 45(1):5–32, 2001.
[14] J. P. Canning, E. E. Ingram, S. Nowak-Wolff, A. M. Ortiz, N. K. Ahmed, R. A. Rossi, K. R. B. Schmitt, and S. Soundarajan. Network classification and categorization. InarXiv:1709.04481, September 2017.
[15] F. Chung and L. Lu. Connected components in random graphs with given expected degree sequences.Annals of combinatorics, 6(2):125–145, 2002. [16] C. Cortes and V. Vapnik. Support-vector networks.Machine Learning, 20(3):273–
297, 1995.
[17] D. K. Duvenaud, D. Maclaurin, J. Iparraguirre, R. Bombarell, T. Hirzel, A. Aspuru-Guzik, and R. P. Adams. Convolutional networks on graphs for learning molecular fingerprints. InAdvances in Neural Information Processing Systems, pages 2224– 2232, 2015.
[18] P. Erdős and A. Rényi. On the evolution of random graphs. Publ. Math. Inst.
Hungar. Acad. Sci, 5:17–61, 1960.
[19] J. Friedman, T. Hastie, and R. Tibshirani. The elements of statistical learning, volume 1. Springer series in statistics New York, 2001.
[20] T. Gärtner. A survey of kernels for structured data.SIGKDD Explorations, 5(1):49– 58, 2003.
[21] T. Gärtner, P. Flach, and S. Wrobel. On graph kernels: Hardness results and efficient alternatives.Learning Theory and Kernel Machines, pages 129–143, 2003. [22] T. E. Goldsmith and D. M. Davenport. Assessing structural similarity of graphs.
1990.
[23] Graph500. http://graph500.org/?page_id=12.
[24] T. Guo and X. Zhu.Understanding the roles of sub-graph features for graph classification: an empirical study perspective. InCIKM, pages 817–822. ACM, 2013.
[25] K. Ikehara. The Structure of Complex Networks across Domains. PhD thesis, University of Colorado at Boulder, 2016.
[26] A. M. Khan, D. F. Gleich, A. Pothen, and M. Halappanavar. A multithreaded algorithm for network alignment via approximate matching. InProceedings of
the International Conference on High Performance Computing, Networking, Storage and Analysis, page 64. IEEE Computer Society Press, 2012.
[27] G. Kollias, M. Sathe, O. Schenk, and A. Grama. Fast parallel algorithms for graph similarity and matching.Journal of Parallel and Distributed Computing, 74(5):2400–2410, 2014.
[28] D. Koutra, H. Tong, and D. Lubensky. Big-align: Fast bipartite graph alignment. InInternational Conference on Data Mining, pages 389–398. IEEE, 2013. [29] N. Kriege and P. Mutzel. Subgraph matching kernels for attributed graphs.arXiv
preprint arXiv:1206.6483, 2012.
[30] J. B. Lee, R. Rossi, and X. Kong. Deep graph attention model. InarXiv:1709.06075, 2017.
[31] J. Leskovec, D. Chakrabarti, J. Kleinberg, C. Faloutsos, and Z. Ghahramani. Kro-necker graphs: An approach to modeling networks. JMLR, 11(Feb):985–1042, 2010.
[32] G. Li, M. Semerci, B. Yener, and M. J. Zaki. Effective graph classification based on topological and label attributes.Statistical Analysis and Data Mining: The ASA
Data Science Journal, 5(4):265–283, 2012.
[33] P. Mahé, N. Ueda, T. Akutsu, J.-L. Perret, and J.-P. Vert. Extensions of marginalized graph kernels. InProceedings of the Twenty-First International Conference on
Machine Learning, page 70. ACM, 2004.
[34] N. Malod-Dognin and N. Pržulj.L-graal: Lagrangian graphlet-based network aligner.Bioinformatics, 31(13):2182–2189, 2015.
[35] T. Milenković, W. L. Ng, W. Hayes, and N. Pržulj. Optimal network alignment with graphlet degree vectors.Cancer informatics, 9:121, 2010.
[36] R. Milo, S. Shen-Orr, S. Itzkovitz, N. Kashtan, D. Chklovskii, and U. Alon. Network motifs: simple building blocks of complex networks.Science, 298(5594):824–827, 2002.
[37] M. Newman.Networks: an introduction. Oxford university press, 2010. [38] M. E. Newman. Assortative mixing in networks. Physical review letters,
89(20):208701, 2002.
[39] M. E. Newman, S. H. Strogatz, and D. J. Watts. Random graphs with arbitrary degree distributions and their applications.Physical review E, 64(2):026118, 2001. [40] J.-P. Onnela, D. J. Fenn, S. Reid, M. A. Porter, P. J. Mucha, M. D. Fricker, and N. S. Jones. Taxonomies of networks from community structure.Physical Review E, 86(3):036104, 2012.
[41] L. Ralaivola, S. J. Swamidass, H. Saigo, and P. Baldi. Graph kernels for chemical informatics.Neural networks, 18(8):1093–1110, 2005.
[42] J. W. Raymond, E. J. Gardiner, and P. Willett. Rascal: Calculation of graph similarity using maximum common edge subgraphs. The Computer Journal, 45(6):631–644, 2002.
[43] R. A. Rossi and N. K. Ahmed. The network data repository with interactive graph analytics and visualization. InProceedings of the Twenty-Ninth AAAI Conference
on Artificial Intelligence, 2015. 9
[44] R. A. Rossi and N. K. Ahmed. Role discovery in networks.IEEE Transactions on
Knowledge and Data Engineering, 27(4):1112–1131, 2015.
[45] R. A. Rossi, D. F. Gleich, and A. H. Gebremedhin. Parallel maximum clique algorithms with applications to network analysis.Journal on Scientific Computing
(SISC), 37(5):28, 2015.
[46] R. A. Rossi, D. F. Gleich, A. H. Gebremedhin, and M. M. A. Patwary. Fast maxi-mum clique algorithms for large graphs. InProceedings of the 23rd International
Conference on World Wide Web, pages 365–366. ACM, 2014.
[47] R. A. Rossi, R. Zhou, and N. K. Ahmed.Deep feature learning for graphs. In
arXiv:1704.08829, pages 1–11, 2017.
[48] N. Shervashidze, P. Schweitzer, E. J. v. Leeuwen, K. Mehlhorn, and K. M. Borg-wardt. Weisfeiler-lehman graph kernels.Journal of Machine Learning Research, 12(Sep):2539–2561, 2011.
[49] N. Shervashidze, S. Vishwanathan, T. Petri, K. Mehlhorn, and K. Borgwardt. Efficient graphlet kernels for large graph comparison. InArtificial Intelligence
and Statistics, pages 488–495, 2009.
[50] S. Soundarajan, T. Eliassi-Rad, and B. Gallagher. A guide to selecting a network similarity method. InSIAM International Conference on Data Mining, pages 1037–1045. SIAM, 2014.
[51] J. Ugander, L. Backstrom, and J. Kleinberg. Subgraph frequencies: Mapping the empirical and extremal geography of large graph collections. InProceedings of
the 22nd international conference on World Wide Web, pages 1307–1318. ACM, 2013.
[52] M. van Steen.Graph Theory and Complex Networks.Maarten van Steen, first edition, apr 2010.
[53] V. Vapnik.The nature of statistical learning theory. Springer science & business media, 2013.
[54] S. Vishwanathan, N. Schraudolph, R. Kondor, and K. Borgwardt. Graph kernels.
JMLR, 11:1201–1242, 2010.
[55] D. Watts and S. Strogatz. Collective dynamics of small-world networks.Nature, 393(6684):440–442, 1998.
[56] L. A. Zager and G. C. Verghese. Graph similarity scoring and matching.Applied
mathematics letters, 21(1):86–94, 2008.