Prof. Dr. J. Léon
Improving crop varieties of spring barley for drought and heat tolerance with AB-QTL-analysis
Inaugural-Dissertation zur
Erlangung des Grades Doktor der Agrarwissenschaften
(Dr. agr.)
der
Hohen Landwirtschaftlichen Fakultät
der Rheinischen Friedrich-Wilhelms-Universität Bonn
vorgelegt am 25.03.2004 von
Khalaf Ali Hamam Mohammed aus
ABSTRACT (IN DEUTSCH) II
Referent: Herr Prof. Dr. J. Léon
Korreferent: Herr Prof. Dr. M. Janssens Tag der mündlichen Prüfung: 27. 05.2004 Gedruckt bei:
Improving crop varieties of spring barley for drought and heat tolerance with AB-QTL-analysis
In the years 2002-2003, 323 BC2DH individuals of double haploid (DH) spring barley population
were genotyped with SSRs markers. The BC2DH lines were evaluated in greenhouse trials for
drought and heat tolerance. Altogether 13 parameters for the determination of drought tolerance and 12 parameters for the investigation of heat tolerance were examined. There were two treatments for the drought experiment, 50% field capacity (FC) level for drought stress and at 100% FC level for the control. We used two treatments for the heat experiment (normal climate and in greenhouse). The traits measured were: relative leaf water content, osmotic adjustment, heading date, number of spikes per plant, number of kernels per spike, number of leaves per main tiller, flag leaf area, first leaf area, second leaf area, carbon isotope discrimination (for the drought experiment), yield, biomass and harvest index. The traits were compared to determine the presence of alleles from the wild barley parent by means of the AB-QTL-analysis. The 97 mapped SSRs covered 1013 cM of the barley genome; the mean SSR density is equal to 11.1 cM. Polymorphic SSRs revealed 54 putative QTLs in two groups. The first had 20 putative QTLs for the drought experiment and the second 34 putative QTLs for the heat experiment. Altogether, 30 (55.5%) favorable allele effects of the Hsp alleles were detected for both drought and heat experiment. 14 (70.0%) favorable effects were detected for drought tolerance. These traits, osmotic adjustment, yield, biomass, relative leaf water content, carbon isotope discrimination, number of leaves per main tiller and flag leaf area were controlled by 7, 3, 3, 3, 2, 1 and 1 QTL respectively, in the drought experiment. Most of the favorable Hsp alleles were located on chromosomes 1H, 5H and 7H (2, 8 and 3 respectively). Under drought stress first leaf area was positively and strongly correlated with flag leaf area. Positive correlations were expressed by second leaf area with flag leaf area and first leaf area. Yield was positively correlated with harvest index, number of spikes per plant and number of kernels per spike. Biomass showed correlations with number of spikes per plant, number of leaves per main tiller, flag leaf area, first leaf area, second leaf area and yield. 16 (47.0%) favorable effects of the Hsp alleles were detected for heat tolerance. Flag leaf area, osmotic adjustment, yield, harvest index, biomass, first leaf area, relative leaf water content, number of spikes per plant and heading date were controlled by 8, 7, 4, 4, 3, 3, 2, 2 and 1 QTL respectively, in heat experiment. Most of the QTLs were located on chromosomes 3H and 4H (3, and 5 respectively). Correlations of heading date with osmotic adjustment, and number of leaves per main tiller were strongly positive. Strong positive correlations were expressed by second leaf area with flag leaf area and first leaf area. Yield was positively and strongly correlated with harvest index.
Verbesserung der Trockenheits- und Hitzetoleranz von Sommergersten-Linien mit Hilfe der AB-QTL-Analyse
Während eines Versuches in den Jahren 2002 und 2003 wurde eine Sommergersten- BC2DH- Population, die 323
BC2DH- Einzellinien umfasste, mit 97 polymorphen SSR-Markern genotypisiert. Parallel wurden die BC2
DH-Linien in Gewächshausversuchen auf ihre Trockenheits- und Hitzetoleranz hin phänotypisch untersucht. Hierzu wurden im Trockenstressversuch 13 Merkmale und im Hitzestressversuch 12 Merkmale erhoben. Im Trockenstressversuch wurden zwei Behandlungen unterschieden: (1) Boden mit 50% Feldkapazität (FC) (zur Erzeugung von Trockenstress), (2) Boden mit 100% Feldkapazität (FC). Auch im Hitzestressversuch gab es zwei unterschiedliche Behandlungen: (1) Normales Klima, (2) Gewächshausklima. Die Linien wurden auf folgende Merkmale phänotypisch untersucht: relativer Wassergehalt des Blattes, osmotischer Druck, Zeitpunkt des Ährenschiebens, Anzahl der Ähren pro Pflanze, Anzahl der Körner pro Ähre, Anzahl der Blätter pro Trieb, Blattflächenindex des Fahnenblattes, Blattflächenindex des ersten Blattes, Blattflächenindex des zweiten Blattes, Ertrag, Biomasse und Harvest Index. Im Trockenstressversuch wurde zusätzlich das Merkmal Karbonisotopunterscheidung erhoben. Die Merkmalsdaten wurden mit dem Vorhandensein der Allele des Wildgerstenelternteils mittels der AB-QTL-Analyse verglichen. Die 97 genotypisierten SSRs decken 1013 cM des Gerstengenoms ab, wobei die mittlere SSR-Dichte 11,1 cM betrug. Die Karte Scarlett*ISR42-8 enthält vier Lücken mit einem Markerabstand von mehr als 30 cM, wobei die Lücken auf den Chromosomen 3H, 5H und 6H lokalisiert sind. Ingesamt wurden 54 putative QTLs detektiert, wobei 20 putative QTLs im Trockenstressversuch und 34 putative QTLs im Hitzestressversuch gefunden wurden. Insgesamt wurden 30 (55,5%) vorteilhafte QTL-Effekte des Wildformallels (Hsp- Allel) in beiden Versuch ermittelt. Für Trockentoleranz wurden 14 (70,0%) vorteilhaften QTL-Effekte des Hsp- Allels festgestellt. Hierbei wurden für die Merkmale Ertrag, Biomasse und relativer Wassergehalt jeweils drei QTLs, für die Merkmale Anzahl der Blätter pro Trieb und Blattflächenindex des Fahnenblattes je ein QTL und für das Merkmal osmotischer Druck sieben QTLs gefunden. Für das Merkmal Karbonisotopunterscheidung wurden zwei QTLs lokalisiert. Die meisten der vorteilhaften QTLs waren auf den Chromosomen 1H, 5H und 7H lokalisiert (2, 8 bzw. 3 QTLs). Unter Trockenstress war der Blattflächenindex des ersten Blattes positiv mit dem Blattflächenindex des Fahnenblattes und dem Blattflächenindex des zweiten Blattes korreliert. Das Merkmal Ertrag zeigte positive Korrelationen mit dem Harvest Index, der Anzahl der Ähren pro Pflanze und der Anzahl der Körner pro Ähre. Die Biomasse korrelierte mit der Anzahl der Ähren pro Pflanze, der Anzahl der Blätter pro Trieb, dem Blattflächenindex des Fahnenblattes, dem Blattflächenindex des ersten Blattes, dem Blattflächenindex des zweiten Blattes und dem Ertrag. Für Hitzetoleranz wurden 16 (47,0%) vorteilhafte QTL-Effekte des Hsp- Allels ermittelt. Dabei wurden für die Merkmale Blattflächenindex des ersten Blattes, relativer Wassergehalt des Blattes und Anzahl der Ähren pro Pflanze jeweils zwei QTLs lokalisiert. Für den Harvest Index und die Biomasse wurden je drei QTLs gefunden, wohingegen für das Merkmal Zeitpunkt des Ährenschiebens nur ein QTL ermittelt wurde. Für die drei Merkmale Blattflächenindex des Fahnenblattes, osmotischer Druck und Ertrag wurden acht, sieben bzw. vier QTLs gefunden. Die meisten der vorteilhaften QTLs waren auf den Chromosomen 3H und 4H lokalisiert (je 3 QTLs). Eine Korrelation konnte zwischen dem Zeitpunkt des Ährenschiebens und den Merkmalen osmotischer Druck und Anzahl der Blätter pro Trieb gemessen werden. Positiv korreliert waren außerdem der Blattflächenindex des zweiten Blattes mit Blattflächenindex des Fahnenblattes und des ersten Blattes. Der Ertrag zeigte einen positiven Zusammenhang mit dem Harvest Index.
TABLE LISTING ... VI
1. INTRODUCTION... 1
2. REVIEW OF LITERATURE... 3
2.1 MORPHOLOGICAL DIFFERENCES BETWEEN CULTIVARS AND WILD BARLEY...4
2.2 ECONOMIC OF BARLEY CULTIVARS...6
2.3 BARLEY BREEDING...7
2.4 WHAT IS THE IMPORTANCE OF DROUGHT STRESS? ...7
2.5 WHY IS HEAT STRESS IMPORTANT?...9
2.6 OSMOTIC ADJUSTMENT...12
2.7 CARBON ISOTOPE DISCRIMINATION...13
2.8 SYSTEMATIC DECENCY OF THE BARLEY BC2DH LINES...15
2.9 DOUBLED HAPLOIDS POPULATION (BC2DH) ...15
2.10THE ROLE OF PLANT PHYSIOLOGY IN PLANT BREEDING FOR DROUGHT TOLERANCE...15
2.11USE OF BACKCROSS POPULATIONS FOR QTL ANALYSIS...16
2.12APPLICATION OF SIMPLE SEQUENCE REPEATS (SSRS) MARKER...16
2.13MAPPING QUANTITATIVE TRAIT LOCI...17
2.13.1QUANTITATIVE TRAITS...17
2.13.2METHOD OF QTL MAPPING...18
2.14METHOD OF QTL CALCULATION...19
2.15MARKER ASSISTED SELECTION...19
2.16ADVANCED BACKCROSS QUANTITATIVE TRAIT (AB-QTL) STRATEGY...21
3. MATERIALS AND METHODS ... 23
3.1.1PLANT MATERIAL...24
3.1 MEASUREMENT OF PHENOTYPIC DATA...25
3.1.1 EXPERIMENTAL EVALUATION OF THURINGIA,SCARLETT,HARRY AND APEX BARLEY GENOTYPES FOR DROUGHT TOLERANCE...25
3.1.2 EXPERIMENTAL EVALUATION OF 323BC2DH LINES FOR DROUGHT TOLERANCE...25
3.1.3 EXPERIMENTAL EVALUATION OF FOUR BARLEY GENOTYPES FOR HEAT TOLERANCE...26
3.1.4 HEAT EXPERIMENT FOR 323BC2DH LINES...27
3.1.5 FERTILIZATION...27
3.1.6 DATA COLLECTION AND SAMPLE HARVESTING...28
3.2.1 EXTRACTION OF BARLEY DNA ...30
3.2.2 AGAROSE GEL ELECTROPHORESIS PROCEDURE...30
3.2.3 SSR-MARKER ANALYSIS...32
3.2.4 GEL ELECTROPHORESIS...34
3.2.5 SILVER STAINING FOR DNA VISUALIZATION...34
3.3 STATISTICAL ANALYSIS OF DATA...35
3.4 DETECTION OF PUTATIVE QTLS...35
4. RESULT... 37
4.1 DROUGHT TOLERANCE...37
MORPHOLOGICAL CHARACTERS...37
4.1.1 EVALUATION OF FOUR BARLEY GENOTYPES...37
4.1.2 DROUGHT RESULT FOR PARENTS SCARLETT AND ISR42-8...46
4.1.3 DROUGHT RESULTS FOR BC2DH LINES (AB-DH LINES SCARLETT*ISR42-8 POPULATION) ...50
4.1.4 IDENTIFICATION OF MICROSATELLITE MARKERS IN THE SCARLETT BACKCROSS POPULATION....59
4.1.5 DETECTION OF QTLS FOR DROUGHT TOLERANCE. ...61
4.2 HEAT RESULTS...68
4.2.1 EVALUATION OF FOUR BARLEY GENOTYPES...68
4.2.2 HEAT RESULTS FOR POPULATION PARENTS SCARLETT AND ISR42-8...75
4.2.3 HEAT RESULT FOR BC2DH LINES (SCARLETT*ISR42-8 POPULATION)...80
4.2.4 QTL DETECTION FOR HEAT EXPERIMENT...87
5. DISCUSSION ... 94
5.1 MORPHOLOGICAL TRAITS...95
5.1.1 EVALUATION OF FOUR BARLEY GENOTYPES FOR DROUGHT TOLERANCE...98
5.1.2 DROUGHT RESULTS FOR BC2DH LINES...99
5.1.3 EVALUATION OF FOUR BARLEY GENOTYPES FOR HEAT TOLERANCE...99
5.1.4 HEAT RESULTS FOR BC2DH LINES...102
5.2 DISCUSSION OF QTL ANALYSIS...103
5.2.1 DISCUSSION THE AB-QTL-ANALYSIS IN THE BC2DH POPULATION...103
5.2.2 AB-QTLANALYSIS IN BARLEY...103
6. SUMMARY ... 121
7. REFERENCES... 127
Table Listing
Table 1: Pedigree description of European spring barley cultivars and Wild barley ... 24
Table 2: Drought treatment for parents and BC2DH lines ... 26
Table 3: Temperature treatment in and outside the green house ... 26
Table 4: Treatment of BC2DH lines for heat stress... 27
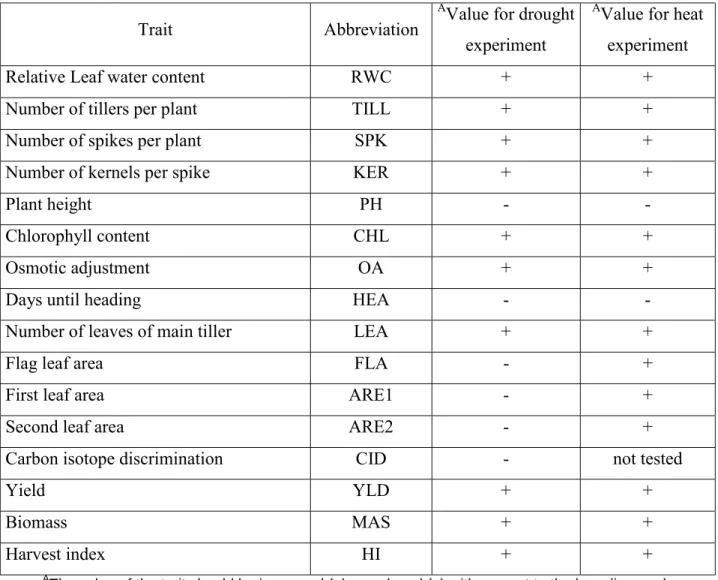
Table 5: Traits abbreviation for studied drought and heat stress parameters... 28
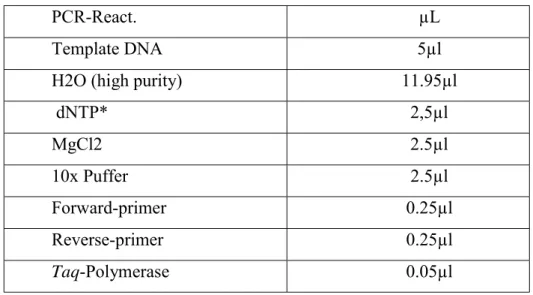
Table 6: Reactants for Polymerize chain reaction (PCR) for SSR markers... 33
Table 7: Procedure for Polymerize chain reaction... 33
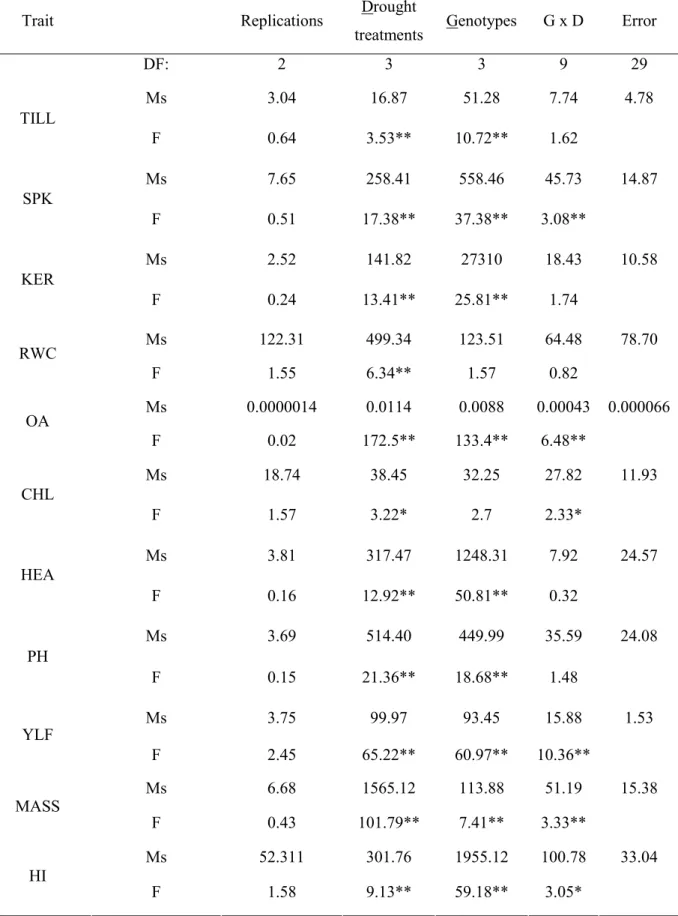
Table 8: Analysis of variance for drought treatment in Thuringia, Scarlett, Harry, and Apex genotypes ... 38
Table 9: Means of traits for Thuringia, Scarlett, Harry, and Apex genotypes with Ryan-Gabriel-Welsch Multiple Range Test in drought experiment ... 45
Table 10: Mean value of traits of heat treatments with Ryan-Gabriel-Welsch Multiple Range Test for drought experiment ... 45
Table 11: Analysis of variance of Scarlett and ISR42-8 for drought tolerance... 48
Table 12: T test (LSD) for average mean values of parents Scarlett and ISR42-8 for 13 quantitative traits. ... 49
Table 13: Mean value of traits for drought treatments with Student-Newman-Keuls Test (SNK) Test in drought experiment... 50
Table 14: Analysis of variance of traits of BC2DH lines, years and drought treatments in drought experiment ... 51
Table 15: Correlation coefficient among 13 quantitative traits for BC2DH lines-Scarlett*42-8 population ... 53
Table 16: Correlation coefficient among 13 traits for BC2DH lines Scarlett*42-8 population under drought stress ... 57
Table 17: Number of markers and genome coverage putative QTLs for drought and heat tolerance61 Table 18 : List of 20 putative QTLs detected from the BC2DH cross Scarlett x ISR42-8A for ... 64
Table 19: Analysis of variance traits for Thuringia, Scarlett, Harry, and Apex genotypes for heat experiment. ... 69
Table 20: Mean value of traits for Thuringia, Scarlett, Harry, and Apex genotypes with Ryan-Gabriel-Welsch Multiple Range Test for heat experiment... 74
Table 21: Mean value of traits of heat treatments with Ryan-Gabriel-Welsch Multiple Range Test for heat experiment. ... 75
Table 22: Analysis of variance of traits for population parents (Scarlett and ISR42-8) for heat tolerance... 77
Table 23: T Tests (LSD) for parents (Scarlett and ISR42-8) for heat experiment... 78
Table 24: T Tests (LSD) between mean values of heat treatments for 12 quantitative traits... 79
Table 25: Analysis of variance in traits for BC2DH for heat tolerance. ... 80
Table 27: Pearson correlation coefficients for 12 traits for heat treatments and BC2DH lines1... 85
Table 28: List of 34 putative QTLs detected from the BC2DH cross Scarlett x ISR42-8A for heat
experiment. ... 89 Table 29: List of 14 favorable QTL alleles detected from the BC2DH cross Scarlett x ISR42-8A for
drought tolerance ... 105 Table 30: List of 16 favorable QTL alleles detected from the BC2DH cross Scarlett x ISR42-8A for
heat experiment... 106
Figure Listing
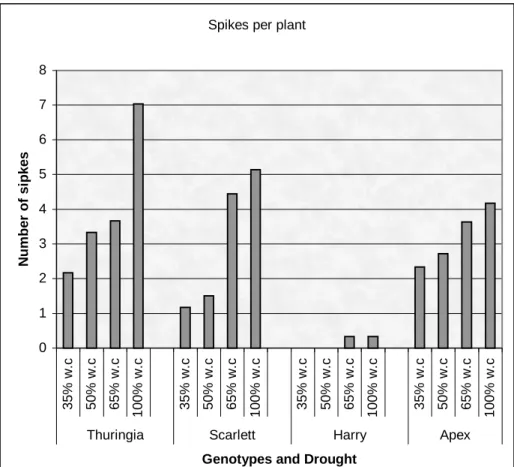
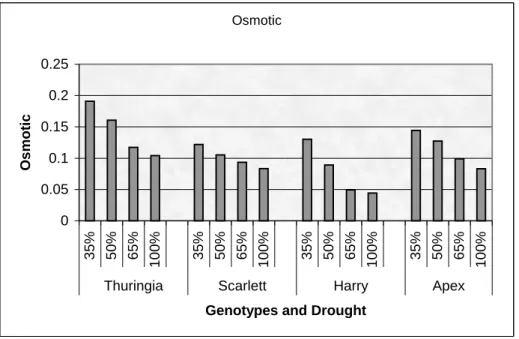
Figure 1: Effect of drought on the number of spikes per plant of Thuringia, Scarlett, Harry, and Apex genotypes... 39 Figure 2: Osmotic adjustment of Thuringia, Scarlett, Harry, and Apex genotypes for drought
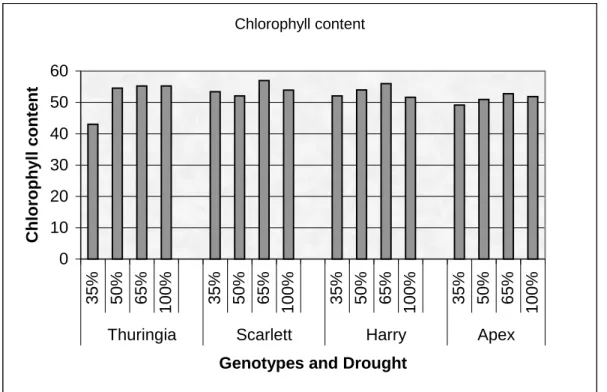
experiment. ... 40 Figure 3: Chlorophyll content of Thuringia, Scarlett, Harry, and Apex genotypes for drought
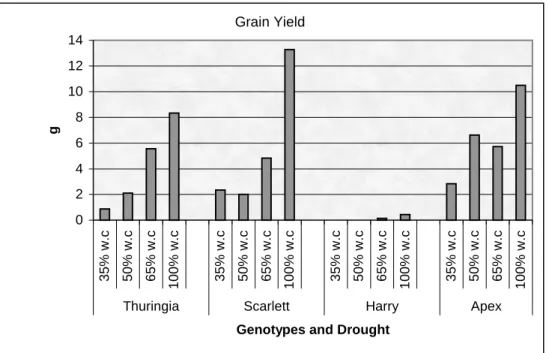
experiment. ... 41 Figure 4: Yield of Thuringia, Scarlett, Harry, and Apex genotypes for drought experiment... 42 Figure 5: Biomass of Thuringia, Scarlett, Harry, and Apex genotypes for drought experiment... 43 Figure 6: Harvest index of Thuringia, Scarlett, Harry, and Apex genotypes for drought experiment.44 Figure 7: Linkage map of spring barley (Scarlett*ISR42-8... Figure 8: Linkage map of QTL in spring barley (Scarlett*ISR42-8) for drought tolerance... Figure 9: Relative leaf water content of Thuringia, Scarlett, Harry, and Apex genotypes for heat
experiment. ... 70 Figure 10: Osmotic adjustment of Thuringia, Scarlett, Harry, and Apex genotypes for heat
experiment. ... 71 Figure 11: Days until heading of Thuringia, Scarlett, Harry, and Apex genotypes for heat
experiment. ... Figure 12: Plant height of Thuringia, Scarlett, Harry, and Apex genotypes for the heat experiment.73 Figure 13: Linkage map of spring barley for heat tolerance (Scarlett*ISR42-8) ...
1. Introduction
Drought and heat represent a major problem for agriculture in arid and semiarid areas. By classical plant breeding supported by new biotechnological methods, new varieties, which are sufficient for the special growth requirements in hot and dry regions, can be bred. These drought and heat-tolerant varieties can produce increased yields, not only in semiarid zones, but also in temperate areas with temporary drought and heat occurrence. In semiarid areas, water unavailability is frequently happened. Molecular breeding methods can enable the cultivation of drought-tolerant varieties, with water saving capacity. The presence of drought and heat resistant varieties in Third World countries reduces frequent harvest failures and eliminates the need of grain import. These varieties represent an important thus economic advantage for countries of semiarid zones.
Using the AB-QTL analysis strategy as devised by Tanksley and Nelson (1996), favorable alleles from wild barley can be transferred for the improvement of heat and drought tolerance in barley cultivars. Among four German barley cultivars, 12 traits for heat and drought tolerance are examined in order to determine traits, which show significant deviations for drought and heat stressed plants.
Recurrent backcrossing was made between a wild barley parent (ISR 42-8) from Middle East and the German cultivar Scarlett as the recurrent parent. The idea seems reliable to identify the QTLs from highly tolerant wild relatives and simultaneous by to intrigues those alleles into elite cultivars.
The population of 323 BC2DH lines was genotyped with 97 SSR-markers. Altogether 13 traits
for the determination of drought tolerance and 12 traits for heat tolerance were examined over two years. In a statistical analysis, the genotypic and the phenotypic data were correlated to detect and localize alleles from the wild barley, which have an influence on the expression of the examined quantitative traits. Subsequently, lines were compared with QTL alleles of the wild barley and with QTL alleles from the barley cultivar, in order to discover favorable alleles from the wild barley.
Drought is the major cause of crop yield reduction in the world today. Breeding crops with improved drought tolerance is one approach to alleviate this problem. However, progress towards this goal has been slow because of the complexity of the trait and its quantitative inheritance. Barley is an excellent crop for studies on both the inheritance and physiology of this trait.
In an experiment during (2002 - 2003), spring barley double haploid (BC2DH) populations
were developed. The population including 323 individuals was genotyped with 97 polymorphic markers. The BC2DH lines were evaluated in greenhouse trials for drought and heat traits. At the
end of the two-year experiment, the phenotypic and genotypic data were statistically analyzed. At the experiment, favorable alleles of wild species from the AB-QTL analysis were detected, for the important trait related to tolerance for drought and heat.
Aims of the study
The major objective of this research work was to improve the level of drought and heat tolerance in barley BC2DH lines to be stable for production in drought prone environments of the
Mediterranean region. Application of the AB-QTL strategy in barley is important for improvement of drought and heat tolerance in barley. This could be achieved through identification and simultaneous transfer of the exotic QTL alleles, which have the potential to improve yield-related traits.
The specific aims were:
•To study the QTL effects of Hsp alleles for marker*drought treatments interaction in BC2DH lines.
•To study the QTL effects of Hsp alleles for marker*heat treatments interaction in BC2DH lines.
•To find favorable Hsp alleles associated with the improvement of drought and heat related traits for use in marker-assisted-selection in barley breeding.
2. Review of Literature
Most of drought and heat traits in crops are quantitative in nature. They are controlled by polygenes, displaying interactions among genes and with drought treatments as well as, heat treatments. These make their genetic inheritance complicated and difficult to be understood. The procedures for finding and locating the quantitative trait loci (QTL) and analyzing their magnitude of genetic effects and interactions with drought treatments as well as, heat treatments, are called QTL. This bridges the gap between continuous phenotypic variation and the inherited mechanisms by dissecting genetic variation into individual loci (Phillipa 1998). QTL finding might open up new possibilities for marker based selection in plant breeding. Basically, the procedures of QTL finding involve construction of linkage map and searching for a relationship between drought treatments, heat treatments and markers (Zhao 2002).
Background: Access to and control of water resources are becoming the most important. Today 450 million people are subjected to severe water shortage and in 2025; this number may be about 2.7 billion (or 1/3 of the world population). Some are advocating an increase of farm water use by 15 to 20% for sustaining food security and alleviating rural poverty. Environmentalists claim, however, that water resources should drop by 10% in the coming 25 years to be able to protect natural water resources (in rivers, lakes and wetlands). There are distinct options for managing water resources. Irrigation was the traditional approach for dealing with water shortages but now as water resources are scarce other solutions are sought. For example, plant breeders are working in the development of crops better adapted to drought-prone environments or in plants with increase water-use efficiency. Research suggests that relatively high productivity may be accomplished even in unfavorable environments if selection for adaptation to these environments occurs in targeted crops. Nevertheless, selection for tolerance in stress environments often leads to low yielding genotypes when grown in non-stress environments (Ortizet al 2001).
Many observers have pointed out the dangers of future food shortages and famine due to impending global water shortages. Already, one-third of the world’s population faces water shortages, and this proportion is expected to rise to two-thirds by the year 2025 report by (Annan, 2000). Competition between urban and rural areas, for water increased the demand for water due to rising living standards. In addition, changes in annual precipitation and rainfall patterns as a result of environmental change indicate that water demand and supply are in the process of a major change.
In the past, when water was insufficient for agricultural production, irrigation systems based on the construction of dams and canals had been put in place. However, the number of areas where new irrigation infrastructure is economically viable is becoming limited. Concerns have also increased about the negative impacts on the environment. New approaches are especially needed for water-limited semi-arid and arid environments, as well as in other environments with unreliable rainfall and uncertain water availability for agriculture.
For these reasons, the development of drought-resistant and stress-tolerant crops coupled with small-scale but effective technologies to make efficient use of limited water resources on a regional basis are needed. Ecological approaches, breeding, and transgenic improvements can provide crop resources to boast the resource-efficient technologies. These technologies include farm and watershed-based water collection and storage, improved agronomic practices that use soil water more efficiently, and water-saving crop production techniques. Such technologies are adapted to both the environmental conditions and the production practices of farmers in the area for which they are developed. The development of such technologies and establishment of stable and sustainable agricultural production systems, and ultimately living environments, are essential to maintain a world environment in balance.
2.1 Morphological differences between cultivars and wild barley
Taxonomy and origin: Cultivated barley, Hordeum vulgare L., belongs to the tribe Triticeae in the grass family, Poaceae. The Poaceae is the largest family of monocotyledonous plants. The Hordeum L. comprises 32 species (Bothmer et al. 1991). It has been suggested that H. vulgare, together with H. bulbosum L., should be separated into a genus of its own, but this view has not been widely accepted (Bothmer 1992). The progenitor of barley is considered to be a subspecies of cultivated barley: H. vulgare ssp. spontaneum (C. Koch) Tell. Both cultivated and wild barley have winter and summer annual forms. Barley can be divided into two-rowed and six-rowed types according to spike morphology; intermediate types also exist. In two-rowed barley the lateral spikelets are female sterile, while in six-rowed barley allspikelets are fertile (Briggs 1978).
The most widely accepted hypothesis on the origin of cultivated barley defines the Fertile Crescent as its center of origin (Harlan 1976), but a hypothesis of multicentric origin has also been proposed (Molina-Cano et al. 1999). Data from cpDNA analysis suggests that barley has been taken into cultivation more than once, but that only very few domestication events have occurred (Zohary 1969, Neale et al. 1988)
Barley is a diploid (2n = 14) and predominantly self-pollinated crop. Consequently, its variation is structured in true breeding lines. Hundreds of modern varieties and thousands of land races are known. All cultivars have non-brittle ears, the spike stay intact after ripening and are harvested and threshed by humans. This is in sharp contrast with wild barleys, in which ears always brittle. Non-brittleness in cultivated barley is governed by a mutation in either one of two tightly linked `brittle´ genes (Bt1, Bt2). The brittle wild-type allele in each locus is dominant, whereas, the
non-brittle alleles are recessive. Many cultivars are homozygous for both recessive mutations. Others carry only one mutation (Takahashi 1964, 1972). The Non-brittle mutation survived only under domestication.
Wild ancestry: The wild ancestor of the cultivated barley is well known. The crop shows close affinities to a group of wild and weedy barley forms which are traditionally grouped in Hordeum spontaneous C. Koch, but which are, in fact, the wild race or subspecies of the cultivated crop. The correct name for this wild is therefore H. vulgare L. ssp. spontaneum (C. Koch), Tell. These are annual, brittle, two- rowed, diploid (2n = 14), predominantly self-pollinated barley forms and the only wild Hordeum stock that is cross compatible and fully interceptive with the cultivated barley, vulgare x spontaneum hybrids show normal chromosome pairing in meiosis. Also morphologically, the similarity between wild spontaneous and cultivated two-rowed distichal varieties is rather striking. They differ mainly in their modes of seed dispersal. Spontaneous ears are brittle and maturity disarticulates into individual arrow-like triplets. These are highly specialized devices, which ensure the survival of the plant under wild conditions. Under cultivation this specialization broke down and non-brittle mutants were automatically selected for in the man-made system of sowing, reaping and threshing (Harlan and Zohary 1966; Zohary 1969).
The close genetic affinities between the cultivated crop and wild spontaneum barleys are indicated also by spontaneous hybridizations that occur sporadically when wild and cultivated forms grow side by side. Some of such hybridization products, combining brittle ears and fertile lateral spikelets, were in the past erroneously regarded as genuinely wild types and even given a specific rank (H. agriocrithon Åberg). Extensive isozyme, seed storage proteins, and DNA tests have already been carried out in barley (Nevo 1992). The results confirm the close relationships between the wild and cultivated entities grouped in the H. vulgare complex. They also clearly show that genetic diversity in spontaneum wild population is much wider than that present in the cultivated gene pool.
Hordeum vulgare ssp. spontaneum is spread over the East-Mediterranean basin and West Asia, penetrating as far as Turkmenia, Afghanistan, Ladakh, and Tibet. Wild barley occupies primary habitats and man-made habitats. Its center lies of origin in the ´fertile crescent´, starting
from Israel and Jordan in the Southwest, stretching North towards South Turkey and bending southeast Iraqi of Kurdistan and Southwest Iran. In this area, wild spontaneum barley is continuously and massively distributed. It constitutes an important annual component of open herbaceous formations, and it is particularly common in the summer-dry deciduous oak park-forest, East, North, and West of the Syrian Desert and the Euphrates basin, and on the slopes facing the Jordan Rift Valley. From here, H. vulgare ssp. spontaneum spills over the drier steppes and semi-desert.
In the Near Eastern countries, wild barley also occupies a whole array of secondary habitats, i.e. opened-up Mediterranean marquis, abandoned fields, and roadsides. It also infests cereal cultivation and fruit tree plantations (Harlan and Zohary 1966). Further was west, in the Aegean region, the Mediterranean shore of Egypt and Cyrenaica and further East in Northeast Iran, Central Asia and Afghanistan. Wild spontaneum barley rarely builds large stands and seems to be completely restricted to segetal habitats, ruins, or to sites which have been drastically churned by human activity. In general, wild barley does not tolerate extreme cold and it is only occasionally found above 1500 m. It is almost completely absent from the elevated continental plateaux of Turkey and Iran. On the other hand, it is somewhat more drought resistant than the wild wheat and penetrates relatively deep into the warm steppes and deserts, Zohary and Hopf, (1993)
2.2 Economic of Barley cultivars
Cultivated barley, Hordeum vulgare L., is one of the main cereals of the belt of Mediterranean agriculture and a founder crop of old world Neolithic food production. All over the area barley is a universal companion of wheat, but in comparison with the latter it is regarded as an inferior staple and the poor people’s bread. But barley is used to drier conditions, poorer soils and some salinity. Because of these qualities, it has been the principal grain produced in numerous areas and an important element of the human diet. Barley is also the main cereal used for beer fermentation in the old world. The preparation of this beverage seems to be a very old tradition (Darby et al. 1977; Hopf 1976; Samuel 1996.) The crop was, and still is an important feed supplement for domestic animals.
The annual world production of barley amounts to 10,927,970 tones (FAO, 2002). After maize, rice and wheat, barley ranks as the fourth most important crop in the world.
The average barley yield in Germany progressed in the last 20 years from 43 dt/ha to approx. 59 dt/ha. In 2000, approx 12 million tons of barley was harvested, with 9 million tons used as a feed. A tenth of the barley world production, mainly summer barley, is used for production of malt for beer
and whisky. The smallest a proportion serves directly for human nutrition in the form of barley (Zacharias 2001).
2.3 Barley breeding
Breeding new barley varieties is based on creating new allele combinations and subsequent testing and selection of the desirable phenotypes during the selfing generations. Heritable variation is created mainly by controlled crosses between adapted high yielding cultivars and breeding lines. Although variety breeding is based on elite germplasm, specific traits may be introgressed from wild barley and landraces in backcrossing programs (Nevo 1992). Spontaneum mutations, as well as mutations induced by radiation or chemical treatments, have also been used (Briggs 1978). Recently, genetic diversity has been added to the tools for creating new variation in barley (Ritala et al. 1994, Wan and Lemaux 1994). The early generations following crossing are highly heterozygous, making reliable selection difficult until an acceptable level of homozygosity is reached. A short cut to homozygosity can be achieved in barley by producing doubled haploid lines either from immature pollen grains by anther or microspore culture, or through interspecific crosses between barley and H. bulbosum with subsequent chromosome elimination (Pickering and Devaux 1992). Both methods are used in commercial barley breeding programs and several doubled haploid varieties have been released.
2.4 What is the importance of drought stress?
Barley crop is considered important cereal crop not only in Germany and Egypt but also all over world. As barley is feeding mankind, there is an increasing interest in barley world-wide. Barley is the important crop in Germany and Egypt covering nearly 1,970,335 and 33,007 ha, produced 10927970 and 100797 tones, respectively (F.A.O statistic production year book 2002). Barley production in Egypt can be increased by extending the presently cultivated land to places with areatic water availability in winter or season fluctuation in rainfall such as North and west Egypt. All over the world, heat and water are clearly among the most important factors affecting plant survival and function. Plant growth and yield are directly controlled by water supply. So, water deficit and changes in the environmental conditions may reduce growth and impair metabolic processes (Hsiao, 1973). Root growth is an important component of the adaptation of rice to drought-prone environments (Price et al. 1997). The response of plant to stresses depends on it is genetic potential to adaptation to duration and intensity of drought and heat. Heat or drought resistance in crops could be attributed to either avoiding or tolerating drought. Avoiding drought could be achieved by reducing water loss and /or maintaining water uptake. Tolerance to drought
could be attained through a mechanism that enhances plant ability to withstand low water potential, (Clarke, et al. 1984). Crop plant adapt to drought by either avoiding or tolerating cell dehydration (Turner, 1986). Drought avoidance involved rapid morphological development, leaf rolling, leaf shading, reduced leaf area, and increased stomata and cuticular resistance (Morgan, 1984; Turner, 1986). Plants tolerate drought by maintaining sufficient cell turgor. Lowering of the osmotic potential of cells by accumulating solutes was considered due to osmotic adjustment if the build-up compounds were not merely the result of tissue dehydration (Bray 1993). Osmotic adjustment enable water uptake to continue under increasing drought in many crop species and, in some cases, it was associated with maintenance of growth and stable yield under drought conditions (Gunasekera and Berkowitz, 1992). Drought and high temperature usually occur simultaneously, but their effects on plant development are often studied separately. The level of the other stress might alter crop responses to one stress. For instance, high temperature might interact with osmotic adjustment in plants in several ways; it might interact with osmotic adjustment directly by increasing the rate of evaporation (Gates, 1968) or by interfering with the production and utilization of solutes involved in osmotic adjustment (Li et al. 1993). Effects that are would alter production of solutes for osmotic adjustment to drought.
Previous studies on heat and drought stresses in crops demonstrated that crop genotypes reacted differently either to high temperature or to drought. In several crops, such as spring wheat (Mustafa et al. 1996) and faba bean (link et al. 1999); significant relationships between some morphological and physiological characteristics and drought stress have been reported. Thus, morphological and physiological studies of barley genotypes may be used in the breeding program. Reports indicate that drought could significantly increase sugar beet leaf diffusive resistance and thus decrease leaf photosynthesis (Clover et al. 1999). It was reported that differences in stomatal diffusive resistance might be seen between genotypes of some crops such as maize and durum wheat (Ray and Sinclair, 1997; Clarke and Clarke, 1996). Drought and heat tolerance tests that were developed for sorghum were adapted to and evaluated in field grown wheat (Blum and Ebercon 1981). In rice, the occurrence of drought at the booting stage is the most damaging event to grain yield because it drastically increases sterility (Kobata et al. 1994).
Genotypic differences in proline accumulation have been reported for various different plants such as barley, sorghum and rice (Blum and Ebercon 1976). Although Hanson et al. (1977) reported that plant proline accumulating potential should not be utilized as a positive index in screening drought resistance cereals. Physiological response was for barley genotypes to drought stress in order to determine if certain physiological characteristics can be used as a screening tool to select drought
resistance genotypes. The final yield was more reduced when drought was imposed at pollination and flowering stages than vegetative or pod filling stages (Pimentel et al. 1999). An only limited view of the genotypic variability of the underground organs; in addition, knowledge was deficits in the relations with the yield formation (Schwarz et al. 1989). Genotypic differences in root traits may be responsible for differences in yield especially under unfavorable growing conditions (Schwarz et al. 1991).
2.5 Why is heat stress important?
High temperature is a major stress factor limiting crop productivity (Fokar et al 1998).Breeding efforts by a number of national wheat breeding programs has resulted in the release of germplasm adapted to warm growing environments, such as in Egypt and Sudan (AbdElShafi and Ageeb, 1994), India (Tandon, 1994), and Uruguay (Pedretti and Kohli, 1991). Photo-assimilation is more likely to be yield limiting under heat stress than in temperate environments, especially as stress typically intensifies during grain filling, when demand for assimilates is greatest. This is borne out by the observation that under stress, total aboveground biomass typically shows a stronger association with yield than with partitioning, harvest index. The situation is usually reversed under temperate conditions. Hence traits affecting radiation use efficiency (such as ground cover, stay green, and photosynthetic rate) could be expected to be important under heat stress. Although early ground cover seems to be important in an agronomic context (Badaruddin et al. 1999), variation in this trait among genotypes does not seem to be associated with heat tolerance. Physiological evidence indicates that loss of chlorophyll during grain filling is associated with reduced yield in the field (Reynolds et al. 1994). High temperature stress (>35°C) during the grain filling period has the potential to modify grain quality (Blumenthal et al. 1995).
Respiration costs are higher as temperature increases, leading eventually to carbon starvation because assimilation cannot keep pace with respiratory losses (Levitt, 1980). However this apparently wasteful process would seem unavoidable, at least in current germplasm, as evidenced by positive associations observed between dark respiration at high temperatures and heat tolerance of sorghum lines (Gerik and Eastin, 1985). On the other hand, high rates of dark respiration in grains may be severely detrimental to yield (Wardlaw et al. 1980).
Heat shock proteins are synthesized at very high rates under high temperature stress and are thought to have a protective role under stress; nevertheless, their role in determining genetic differences in heat tolerance has not been established. Chlorophyll fluorescence may be a more promising screening trait, given that associations between heat tolerance and lower fluorescence signals have been reported in a number of crops (Moffat et al. 1990).
When growth resources are limited by heat stress, the size of plant organs such as leaves, tillers, and spikes are reduced (Fischer, 1984). The apparent sensitivity of metabolic processes to heat stress in the field (Reynolds et al. 1998), coupled with the reduced length of life cycle at high temperature (Midmore et al. 1984), explains why grain yield is strongly associated with total plant biomass in hot environments. These interactions make crop management practices critical to sustaining wheat yields in warm environments.
Heat stress reduced both the grain growth duration and the grain growth rate (Viswanathan and Renu 2001). In many parts of the Asian subcontinent, crop damage due to heat stress under late planting conditions has become an important factor limiting wheat yields as a result of the rice-wheat cropping system, (Aslam et al. 1989). A growing demand for food due to global warming will in the future push crops further into heat stress environments.
Heat stress reduces grain weight and quality (Ciaffi et al. 1995). It reduces the grain growth duration (Ishag and Mohamed 1996) and grain growth rate (Tashiro and Wardlaw 1990). Starch synthesis is highly sensitive to high temperature stress due to the susceptibility of the soluble starch synthesis in developing kernels of wheat (Denyer et al. 1994). Protein synthesis is less heat sensitive than starch accumulation (Bhullar and Jenner 1985). However, even short periods of very high temperature (35-40 °C) during development can have a negative effect on grain quality (Ciaffi et al. 1995). The steady expansion of the environmental range encompassed by temperate cereals since their domestication 5,000-100,000 years ago has meant that both temperature extremes and water availability have become important factors limiting the production of these cereals in many parts of the world. An added complication in the projected rise in both global mean temperature and frequency of periods of very high temperature (heat shock), as part of the greenhouse climate change, which may further increase the pressure of heat stress in many temperate cereal growing regions (Conroy et al. 1994)
High temperature late in the development of the crop are a feature of many of the wheat growing areas in US and maximum day temperatures above 32°C during the last 15 days of kernel filling, is associated with reduced quality. Thompson (1975) made the observation that the importance of high temperature during kernel filling was reinforced by series of time-of-planting. High temperature during grain filling can considerably reduce yield. At high temperature, photosynthesis declined (Paulsen, 1994), dark respiration and photorespiration increased (Lawlor, 1979). Heat stress caused a reduction in mean yield of the random inbred line population by 47% as compared with normal winter growing conditions (non-stress) (Blum et al. 2001). The cause for death after lethal heat shock is not well understood. A shift from low to intermediate temperature causes the induction of heat-shock proteins in most organisms (Davidson et al. 1996). Although, the
importance of temperatures greater than 32°C, coverage was also given to altered performance due to warming in the moderate temperature range from of 15-32°C during grain filling, recognizing that these two heat ranges may produce distinct reactions (Wardlaw and Wrigley 1994). The heat-shock responses of barley (Hordeum vulgare L. cv Himalaya) aleurone layers incubated with or without gibberellic acid (GA3) were compared. Sodium dodecyl sulfate-polyacrylamide gel electrophoresis revealed that heat shock blocked the synthesis and secretion of secretaryproteins from GA3-treated layers but not untreated layers. Heat shock modestly increased the degree of fatty acid saturation inuntreated aleuronic layers. The same trend was noted in fatty acidsisolated from ER membranes purified by continuous sucrose densitycentrifugation. Increased fatty acid saturation may helpsustain ER membrane function in heat-shocked aleuronic layers incubated inthe absence of GA3 (Grindstaff et al. 1996). Cells must survive challenges from the environment with regard to heat, UV radiation and heavy metals as well as tolerate the endogenous generation of reactive oxygen intermediates during respiration (Raitt et al 2000). Activation of heat shock factor binding and inducible heat shock protein expression enables cells to resist various stress forms (Schett et al. 1999). However, there were no major differences between heat-tolerant variants and non-tolerant variants in the time or temperature required to induce the heat shock response (Park et al. 1996).
Evidence suggests that the small chloroplast heat-shock protein is involved in plant thermo tolerance but its site of action is unknown. Functional disruption of this heat-shock protein using anti-heat-shock protein antibodies or addition of purified heat-shock protein to chloroplasts indicated that (a) this heat-shock protein protects thermolabile photosystem II and, consequently, whole-chain electron transport during heat stress; and (b) this heat-shock protein completely accounted for heat acclimation of electron transportin pre-stressed plants. Therefore, this heat-shock protein is a major adaptationto acute heat stress in plants (Heckathorn et al 1998). There is increasing evidence for considerable interlinking between the responses to heat stress and oxidative stress (Panchuk et al. 2002). Grain sterility and specific forms of morphological and cellular damage depend on the stage of development of grain at the time of transfer (Tashiro and Wardlaw 1990). Temperature (27/22°C) (50% shade) during spike development can reduce the response of the developing grain to high temperature (30/25°C) following anthesis (Wardlaw 1994 and Wardlaw et al. 1995). Temperature stress during kernel development affects maize grain growth and yield stability (Cheikh and Jones 1994)
Short periods of high temperature have been shown to reduce grain weight and baking quality in wheat, but little is known about their effects on barley. The high temperature (maximum 40°C for 6 h day-1) and drought treatments were maintained for 5 or 10 days. Drought reduced
individual grain weight much more (ca 20%) than high temperature (ca 5%) (Savin and Nicolas 1996)
2.6 Osmotic adjustment
Drought is an important abiotic factor affecting the yield and yield stability of food cereals of the Mediterranean basin. This stress acts simultaneously on many traits, leading to a decrease in yield. Drought tolerance could therefore, be studied by identifying the traits which have a significant impact on yield, and genetic factors controlling them (Teulat et al 2001). Tolerance to drought stress is difficult to characterize and quantify, and there has been relatively little progress in improving drought tolerance in cereals. Among the many physiological characteristics proposed as drought tolerance traits, osmotic adjustment is one of the few that has been associated with increased yield under drought stress (Morgen et al. 1986). Measurement made at full turgor may allow this distinction, osmotic adjustment depending only on the amount of solute molecules. Osmotic adjustment is defined as the difference between the osmotic potential at maximal turgor (Wilson et al 1979) of the stressed and the unstressed plants. The evaluation of osmotic adjustment requires a comparison between well-watered plants and plants under a defined water stress. However, the definition of well-watered plants also differs according to authors (Basnayake et al. 1993). The degree of osmotic adjustment increased as the soil water content decreased (Kuang et al. 1990).
Barley could serve as a simple genetic model as it is known to be well adapted to several abiotic stresses, especially to water deficit (Ceccarelli 1987). The maintenance of relative water content and a high osmotic adjustment are known to contribute to increase yield and yield stability under drought in cereals (Clarke and McCiag 1982). Osmotic adjustment is defined as a decrease of osmotic potential within cells, due to an active solute accumulation after water-potential reduction in response to water stress (Blum, 1988). Osmotic adjustment could arise from an increase in the amount of solutes by active solute accumulation or a decrease in the water content on a dry weight basis (Wilson et al. 1980). The decrease in osmotic potential leads to maintenance of cell turgor, and, more generally, turgor-dependent processes, suggesting that osmotic adjustment is a good physiological trait to be considered in breeding for drought tolerance. The solutes, which accumulate during osmotic adjustment, include inorganic cations, organic acids, free amino acids and carbohydrates (Turner and Jones 1980). The main solutes accumulated during osmotic adjustment in barley are water-soluble carbohydrates (Lewicki 1993).
Plants resort to many adaptive strategies in response to abiotic environmental stresses such as high salt, dehydration, cold, heat, and excessive osmotic pressure. These adaptive mechanisms include changes in morphological and developmental patterns as well as physiological and biochemical processes (McCue and Hanson, 1990). Among them, the accumulation of compatible solutes according to the metabolic responses has drawn much attention. Some stress-responsive genes encoding proteins for compatible solute synthesis have been cloned and expressed in transgenic plants (Bartels and Nelson, 1994). The compatible solutes may be classified into two categories: one is nitrogen-containing compounds such as proline and other amino acids, quaternary ammonium compounds and polyamines, and the other is hydroxy compounds, such as sucrose, polyhydric alcohols, and oligosaccharides (McCue and Hanson, 1990). Significant differences existed between wild desert barley and cultivated barley in resistance to a uniform root water deficit. These differences appeared to be primarily related to their differing genetic abilities of osmotic adjustment under drought conditions. The findings suggest that further genetic mapping and marker-assisted transfer of the osmotic-adjustment genes in the wild progenitor could improve resistance of cultivated barley grown in water-limited environments (Lu et al. 1999). The accumulation of solutes varies with the variation in adverse conditions and plant species, or even plant varieties. In general, a plant cell suspension culture is considered a relatively homogeneous population of cells. Much research has used cultured cells as a model system to study the cellular responses under various abiotic stresses, even to distinguish the difference between the short-term response and long-term adaptation involving physiological characters.
2.7 Carbon isotope discrimination
There are two naturally occurring stable isotopes of carbon 12C and 13C. Most of the carbon is
12C (98.9%), with 1.1% being 13C. This isotope is unevenly distributed among and within different
compounds, and this isotopic distribution can reveal information about the physical, chemical, and metabolic processes involved in carbon transformation. The overall abundance of 13C relative to 12C in plant tissue is commonly less than in the carbon of atmospheric carbon dioxide. This indicates that carbon isotope discrimination occurs in the incorporation of CO2 into plant biomass. Because
the isotopes are stable, the information inherent in the ratio of abundances of carbon isotope discrimination, presented by convention as 13C/ 12C, is invariant as long as carbon is not lost (Farquhar et al. 1989). Theoretical and empirical studies have demonstrated that carbon isotope discrimination is highly correlated with plant water use efficiency. Carbon isotope discrimination provides an integrated measure of water-use efficiency, samples are easily collected, and processed,
and large numbers of samples may be collected from diverse environments. Moreover, in woody plants, carbon isotope discrimination can be determined on annual ring samples, providing a historical report of plant responses to environmental conditions (Cregg and Zhang 2001). In several crops including cereals, carbon isotope discrimination (CID) has been associated with drought tolerance in terms of water-use efficiency and yield stability in drought-prone environments (Teulat et al. 2002).
The Mediterranean basin is one of the regions where drought leads to substantial yield reductions (Loss and Siddique 1994). Drought tolerance and yield stability is therefore an important aim for breeders in these regions. As an alternative, a multitude of morph-physiological characters have been suggested as indicators for increasing grain yield under drought conditions. Amongst these, transpiration efficiency (TE: the ratio of dry matter produced to water transpired) is considered as an important drought-adaptive trait in cereals. Carbon isotope discrimination (CID) provides an integrated measurement of TE of C3 crop species (Farquhar and Richards 1984). During photosynthesis, plants discriminate against the heavy isotope of carbon (13C). And, as a result, in several C3 species including wheat and barley, CID is positive correlated with the ratio of internal leaf CO2 concentration to ambient CO2 concentration (Ci/Ca) and negatively correlated
with TE (Farquhar and Richards 1984; Johnson and Bassett 1991). Thus, a high Ci/Ca leads to a higher and a lower TE (Farquhar and Richards 1984). The major advantage of using CID in selection is its high habitability, which is primarily due to small genotype x environment interactions in dryland areas (Richards et al. 1999; Merah et al. 2001b). CID has been found to be positive correlated with grain yield in cereals within and across contrasting environments (Acevedo 1993; Araus et al. 1997; Voltas et al. 1998; Merah et al. 2001a, b; Teulat et al. 2001b). Although the accession which part of the plant to use for CID measurements is still being debated, for cereals grown under Mediterranean conditions, the grain is considered most appropriate (Voltas et al. 1998; Merah et al. 2001b). Measuring CID by mass spectrometry remains expensive. As a result, a number of alternative criteria for CID have been suggested including stomatal conductance (Rebetzke et al. 2001), leaf structural traits such as dry weight per unit leaf area (Araus et al. 1997; Merah et al. 2001a) and as content (Araus et al. 1997; Voltas et al. 1998; Merah et al. 2001a). Overall these have been shown to be less-effective measures. CID is therefore a good example of a trait, which could be efficiently, tracked by molecular markers through the identification of quantitative trait loci (QTLs). Markers diagnostic of individual QTLs represent an important surrogate for physiological trait measurements (Price and Courtois 1999), and may ultimately improve selection efficiency through marker-assisted breeding.
There is currently limited insight into the genetic control of TE and CID. Matin et al. (1989) found that 70% of the genetic variation for CID in populations derived from a cultivated and a wild tomato was associated with three RFLP loci, mapped on three different chromosomes. In soybean, several QTLs for CID were identified under favorable plant growth conditions (Mian et al. 1996). Surprisingly, the identification of QTLs involved in CID variation under drought conditions is undocumented in cereals.
2.8 Systematic decency of the barley BC2DH lines
Doubled haploid 323 lines of a backcross population between wild barley (ISR42-8) from the Middle East and German barley cultivars (Scarlett) were examined for their tolerance to drought and heat. The German Scarlettt cultivar is a variety with high yield good quality characteristics was crossed with a wild barley accession from the Middle East. The resulting backcross population with Scarlettt as recurrent parent carries average 87, 5% of the barley cultivars genotype and 12.5% of the wild barley genotype. Since the wild barley originates from a semiarid area.
2.9 Doubled haploids population (BC2DH)
Doubled haploids are commonly used in many plant species in recent years, which are amenable to anther or microspore culture (usually from F1 plants), followed by chromosome doubling. Because the plant has two identical homologues, the amount of recombination information is exactly equivalent to a backcross. However, BC2DH individuals are completely
homozygous, and can be self-pollinated to produce large numbers of progenies, which are all genetically identical. This permit replicated testing of phenotypes, and also facilitates distribution of identical BC2DH populations to many different researchers. Thus, a BC2DH population can also be
called a permanent population. Major drawbacks of BC2DH populations are firstly, it is impossible
to estimate effects and types of epistasis; secondly, the rates of pollen or microspores successfully turned into BC2DH plants vary between genotypes, which may cause segregation distortion and
false linkage between some marker loci (Zhao 2002).
2.10 The role of plant physiology in plant breeding for drought tolerance
Plant mechanisms that enable plants to become better adapted to water-scarce environments are widely, but most of them are not yet well understood. Among the most important are root architecture, leaf morphology, physiological characters such as osmotic adjustment or proline accumulation, partitioning of total biomass (as determined by dry matter or harvest index), timing for plant development (e.g. earliness), or others associated to the plant reproductive biology. Some
of these characteristics are specific while others are common for many species. Some reports indicate a significant association between crop tolerance to heat and respective adaptation to drought-prone environments in the warm tropics (Ortiz et al. 2001).
2.11 Use of backcross populations for QTL analysis
The reason for the production of a DH population for a QTL analysis is to induce the recombination of genes and alleles in the descendants to those created from variability. The alleles are distributing in equal parts to the two homozygosis class genotypes.
A DH population specified so far is however not suitable for the identification of positive alleles from wild forms with the goal to increase and improve of quantitative characteristics. After two recurrent of backcrossing of a wild species with an elite variety, the wild form portion of the entire genome is on the average decreased to12, 5% the restriction of the wild alleles genome portion in each individual line of the backcross population quantitative traits like increased yield or improve quality can be better seized, since unwanted wild alleles and epistatic effects are reduced. The idea is based on the fact that favorable QTL alleles of the wild form barley can be identified and transferred in elite barleys to stabilize the drought and heat tolerance. First successful experiments on applications of the QTL analysis were reported on tomato (Tanksley et al. 1996; Fulton et al. 1997a, 2000; Bernacchi et al. 1998), rice (Xiao et al. 1996, 1998), barley (Pillen et al. 2003; 2004) and wheat (Huang 2003). In, a self-pollinating diploid crop likes barley, variation evolved primarily by mutation and selection. Since the middle of the last century more or less pure lines in the form of land-races have been collected and crossed (Horvath et al. 2001).
2.12 Application of simple sequence repeats (SSRs) marker
Barley is one of the most important crop species in the world and has been subject to considerable genetic study. It is a diploid (2n = 2x = 14) largely self-pollinating species with a large genome of 5.3 x 10⁹bp/1C (Bennett and Smith 1976). The development of SSR markers for barley has followed a common pattern with the first few derived from sequences held in public databases (Saghai-Maroof et al. 1994; Becker and Heun 1995). This has been followed by screening small insert genomic libraries for SSRs motifs (Struss and Plieske 1998). The limited progress indicates that SSR isolation and characterization from plants is not trivial, and that effective strategies need to be devised which increase the efficiency of the SSR discovery and development phase (Ostrander et al. 1992; Edwards et al. 1996).
The ubiquity of SSRs in eukaryotic genomes and their usefulness as genetic markers is well established. In mammalian systems, SSRs are the primary assay for detecting molecular
polymorphism and well-developed SSR linkage maps are available for a number of species (Sverdlov et al. 1998). A high level of SSR in formativeness has also been revealed for plant species (Milbourne et al. 1997) and this has prompted the initiation of SSR discovery programmers for all major crops (Milbourne et al. 1998). However, there exist a number of limitations associated with SSR discovery and application in plants, including a lack of DNA sequence information in databases, a perceived low abundance of SSRs, differences in the most common types of repeats and the problem of rapid forward and back mutation rates making assumptions of 'allelic identity' based on repeat number difficult to confirm.
In humans, it has been estimated that, on average, one SSR occurs every 6 kb (Beckmann and Weber 1992). Dinucleotide repeats are most frequent, with CA/GT repeats estimated to occur every 30 to 60 kb (Stallings et al. 1991). In plants, analysis of DNA sequence database entries for all possible motifs has revealed a frequency of one SSR every 29kb (Lagercrantz et al. 1993) to one every 50kb (Morgante and Olivieri 1993). AT/TA repeats comprise the majority of the database-derived plant SSRs. Because of the relatively low number of plant DNA sequences and the bias towards coding regions, SSR frequency has also been assessed by oligonucleotide hybridization. Such analyses have suggested figures of one SSR every 80 kb in rice (Panaud et al. 1996) and one every 65 kb in pine (Echt and Maymarquardt 1997). Generally lower estimates have been obtained in studies using only dinucleotide repeats (Roeder et al. 1995) with CA/GT and CT/GA repeats approximately an order of magnitude less frequent in plants than in animals (i.e. one every 250 - 750kbp).
To overcome this problem of abundance, plant geneticists have suggested screening large numbers of clones (Roeder et al. 1995) or develop selective SSR enrichment techniques (Edwards et al. 1996; Milbourne et al. 1998). These were generally successful and resulted in the development of significant collections of SSRs (Roeder et al. 1998).
2.13 Mapping quantitative trait loci 2.13.1 Quantitative traits
The Advanced Backcross Quantitative Trait Locus (AB-QTL) strategy (Tanksley and Nelson 1996) was proposed as a new molecular breeding method based on QTL mapping, that can integrate the processes of QTL analysis and variety development while exploiting the full potential of genetic variation available in unadapted germplasm for the improvement of quantitative traits. This study intends to apply the AB-QTL strategy, to the simultaneous detection and introgression of favorable barley wild species genes of quantitative traits.
Characters exhibiting continuous variation are termed quantitative traits. Continuous variation is caused by two factors: simultaneous segregation of many genes affecting the trait and/or
environment influencing the expression of the trait (Falconer and Mackay 1996). In crop plants most traits of economical importance, including yield, heading date, height and many quality traits, are quantitative by inherited. The unknown genes affecting these traits are commonly referred to as quantitative trait loci (QTL). Biometrical approaches have traditionally been used for studying quantitative traits and the statistical quantitative genetic model assuming essentially infinitely many genes with tiny effects works well for many applied purposes, such as plant breeding. The details of the genetic basis of quantitative traits however remained unclear until genetic maps based on DNA markers were marked.
2.13.2 Method of QTL mapping
Association of morphological markers with quantitative traits in plants was observed early on (Sax 1923) and the first steps towards mapping of QTLs or polygenes were taken based on the scarce markers available (Thoday 1961). Currently, complete genetically maps exist for many crop species and algorithms have been developed for QTL mapping in a wide range of pedigrees and experimental designs including F2, backcross, recombinant inbred, doubled haploid and many other designs (Paterson 1995). All share the basic principle of testing association between marker genotypes and quantitative phenotypes.
The simplest methods were based on single marker analysis, where the difference between the phenotypic means of the marker classes are compared using F-statistics, t-tests, linear regression or nonparametric tests (Sax 1923, Edwards et al. 1987, Soller and Brody 1976). A major shortcoming of single marker analysis is that it cannot distinguish between tight linkage to a QTL with small effect and loose linkage to a QTL with large effect (Lander and Botstein 1989).
The significance thresholds used for reclaiming a QTL are of major importance. Because QTL mapping involves many analyses of independent genetic markers throughout the genome, there are many opportunities for false-positive results. The appropriate threshold for controlling the type I error rate depends on the size of the genome and on the density of markers genotyped: a LOD threshold of 2.4 was considered adequate in simple interval mapping (SIM) for a genome of 1100 cM covered with markers every 20 cM (Lander and Botstein 1989). This threshold was deduced from an assumed distribution for the test statistics, but the true distribution may deviate from the assumed distribution due to random distribution of the markers on the map (Tinker and Mather 1995a). Alternate methods are based on resembling: permutation involves shuffling the phenotypes so that the effects of the parameters are lost and the distribution of test statistics under the null hypothesis can be derived from repeated permutations (Churchill and Doerge 1994).
The power of finding a QTL can be increased by decreasing the variation caused by the environment as well as by the background genome. Environmental variation can be decreased by repeated phenotype measurements or by using progeny testing for phenotype measures (Lander and Botstein 1989). The power of QTL detection also depends on the type and numbers of progeny studied. Based on computer simulation studies, progeny sizes from a few hundreds to a thousand have been suggested to detect QTLs of minor effect. In practical barley studies, doubled haploid population of 100-200 lines have been used frequently for mapping purposes. The density of the marker map is not as important as the progeny size: a map with 50 cM marker spacing is adequate for detection of QTLs. A denser map helps to locate the QTLs more precisely (Darvasi et al. 1993). Recent advances in QTL mapping procedures include analysis of QTL x environment interaction (Tinker and Mather 1995a, b, Jansen et al. 1995, Korol et al. 1998), a nonparametric approach to map QTLs (Kruglyak and Lander 1995), Bayesian mapping of QTLs (Satagopan et al. 1996, Sillanpaeae and Arjas 1998) and methods for differentiating pleiotropy from close linkage (Lebreton et al. 1998).
2.14 Method of QTL calculation
The basic principle of using genetic markers to study quantitative trait loci (QTL) is well established (Sax 1923, Lander and Botstein1989; Jansen 1993; Zeng1994). Sax (1923) first used pattern and pigment markers in beans by investigating the segregation ratio of F2 progeny of different crosses. Thoday (1961) proposed the idea of using two markers to bracket a region for detecting QTL. The basic idea of Sax and Thoday for detecting the association of a QTL with a marker rests on the comparisonsof trait means of different marker (chromosomal segment) classes. These methods, such as t-test and simple and multiple regressions,directly analyze markers.
A further AB-QTL study, which used L. hirsutum as the donor species, revealed 25 favorable wild species QTL alleles out of 121 detected QTLs (Bernacchi et al. 1998a) Again, the authors detected wild species alleles which increased yield by 15 %. The most recent AB-QTL study in tomato was published by (Fulton et al. 2000). In rice yield QTL effect on chromosome 1 was validated in a second cross using the same Oryza rufipogon donor accession (Moncada et al. 2001).
2.15 Marker assisted selection
In breeding autogamous species lines are developed from crossing schemes including two parents. In a backcross programmer a few traits would be transferred from a donor to a recipient. In line
development, however, good characteristics from all parents should be combined in a single line (Weber and Wricke 1994). Information on mapped QTLs can be used to design mating that maximize the probability of pyramiding most, if not all, favorable QTL alleles in a single genotype (Dudley 1993). For traits with significant interactions between QTLs emphasis should be placed on identification of the best multi-locus allelic combinations instead of simply collecting many alleles with positive effects (Zhu et al. 1999).
The relative efficacies of marker assisted selection and traditional selection for improving quantitative traits have been considered in several simulation studies, as reviewed by Lee (1995), the efficiency of marker assisted selection is enhanced and may be more efficient than traditional selection under the following circumstances: 1) the trait under selection has low heritability; 2) a tight linkage is parent between the trait an the marker (<5cM); 3) in earlier generations of selection prior to fixation of alleles at or near marker loci; 4) large sample sizes for mapping and selecting QTL are used to improve estimates of QTL alleles. Markers very closely linked to the target genes or even located in the gene can greatly enhance the use of marker-assisted selection in advanced generations, where the linkage disequilibrium becomes smaller. The accurate chromosomal locations of QTLs, as well as the magnitude of QTL effects, should be verified prior to their use in an applied breeding program. In barley, the effect of four yield QTLs was verified using a set of BC2DH lines different from the lines used for mapping (Romagosa et al. 1999). In that study,
selections based on marker genotypes, or combined information from markers and phenotype, were at least as efficient as phenotypic selection alone, but qualitative QTL x E interactions decreased the efficiency of marker-assisted selection for some of the QTLs. In the same barley lines, effects of only one of the two major QTL regions for several malting quality traits were verified, the effects of the other region were lost probably due to inaccurate location of the QTL (Han et al. 1997).
Simultaneous selection for multiple traits complicates the use of marker-assisted selection in breeding. Information on several markers needs to be combined when selection is made. One method is to determine the marker genotype of each line being tested and sum the significant additive effects of each marker locus to an index value (Dudley 1997). A large number of plants have to be scored in order to find the desired marker combination in the progeny, which may render the selection procedure costly (Graner 1996).