Supporting Information for
Mapping Single Cell-Substrate Interactions by
Surface Plasmon Resonance Microscopy
Wei Wang†, Shaopeng Wang†, Qiang Liu‡, Jie Wu‡ and Nongjian Tao* † § †Center for Bioelectronics and Biosensors, Biodesign Institute, Arizona State University, Tempe, AZ 85287, USA
‡Division of Neurology, Barrow Neurological Institute, St. Joseph's Hospital and Medical Center, Phoenix, AZ 85013, USA
§Department of Electrical Engineering, Arizona State University, Tempe, AZ 85287, USA
*Corresponding authors: [email protected]
This PDF file includes: Location of regions of interests Calibration on SPR bulk effect Seven-layer SPR model SPRM video
Table S1
Figures S1, S2 and S3
Other Supporting Online Materials:
Movie S1 (SPRM video during a hypertonic stimulation).
1. Location of regions of interests.
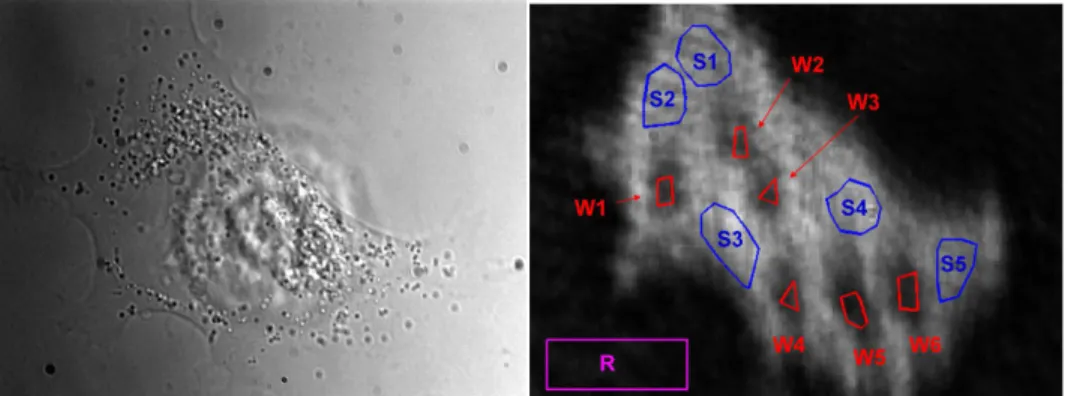
12 regions of interest (ROI) were selected to perform quantitative analysis. For the conciseness of the SPRM image, only rough locations are shown in Fig. 1b. The bright field image of the studied cell (left panel) as well as the detailed locations of these 12 ROIs (right panel) are displayed in Fig. S1.
Figure S1. Specific locations of each ROI region.
2. Calibration on SPR bulk effect
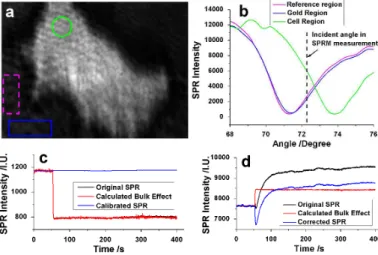
Replacing the isotonic solution by the hypertonic solution led to a change in the bulk refractive index, which changed the SPR intensity in both the cell and surrounding regions (Fig. S2a). This unwanted bulk refractive index effect could be corrected by subtracting out the intensity changes due to the bulk refractive index change, which can be evaluated from the SPR signal on surrounding regions without cell coverage. This requires one to calibrate the SPR sensitivity by measuring the intensity while scanning the angle of incident light (Fig. S2b). After taking into account the local variation in the SPR sensitivity, the bulk refractive index effect was corrected (see Fig. S2c for correction of gold regions). Two regions from the surrounding area without cell coverage were selected. The ‘reference region’ (pink one) served as the reference signal. The ‘gold region’ (blue one) served as a validation signal to prove the feasibility of such correction method. Note that the SPR signal would change oppositely when the refractive index of bulk solution changes at the incident angle we selected, because such incident angle was located in the opposite direction of the minimal SPR angle. We also applied this correction procedure to the cell regions, as
shown in Fig. S2d, where the blue curve is the bulk refractive index corrected signal, reflecting the SPR response from the cellular movements discussed in the main text.
We note that the mannitol molecules were efficiently accessible to the space between the bottom cell membrane and the substrate through its static diffusion inside the gap space. The diffusion coefficient (D) of mannitol molecules in water at room temperature is 0.5×10⁻⁹ cm2·s-1. (Raymond Chang, Physical chemistry for the chemical and biological sciences, 2000, page 881.) According to the diffusion equation, l= D t , it takes mannitol molecules about 1.8 seconds to diffuse a distance of 30 µm, which is the average radius of the SHEP cells herein. In other words, the mannitol molecules could efficiently reach to the space between the cell and the substrate and lead to an osmotic effect as well as a bulk effect in SPR.
Fig. S2. Bulk refractive index correction. (a) The locations of three regions-of-interest including a reference region (pink box), a gold region (blue box) and a cell region (green circle). (b) The SPR angle scan curves of the three regions. SPR angle in cell region is about 2.5 degree larger than that in gold region because of the higher refractive index of cell. (c) Bulk refractive index-corrected SPR intensity in gold region (blue box) by taking pink region as a reference. (d) Bulk refractive index-corrected SPR intensity in cell region (green circle) by taking pink region as a reference.
3. Seven-layer SPR model
A seven-layer SPR model was established to calculate SPR angle in order to evaluate the cell-substrate distance and the cytoplasm refractive index. An open-source
software Winspall (http://www.mpip-mainz.mpg.de/knoll/soft/) was used to simulate the SPR angle with parameters listed in Table S1 for each of the seven layers.
Table S1. Parameters in a seven-layer SPR model
Layer Thickness (nm) Refractive index
n k Lens 0* 1.51361 0 Chromium 2 3.06769 3.36054 Gold 47 0.16146 3.64199 Collagen 1.1** 1.500 0 ECF solution 66*** 1.334 0 Cell membrane 5 1.470 0 Cytoplasm 0* 1.360 0
* Zero means infinite thickness for the first and the last layer according to the software definition.
** The collagen thickness is calculated from the experimental SPR angle shift caused by collagen modification. *** The ECF solution thickness, i.e., cell-substrate distance is calculated from the initial SPR angle in cell region.
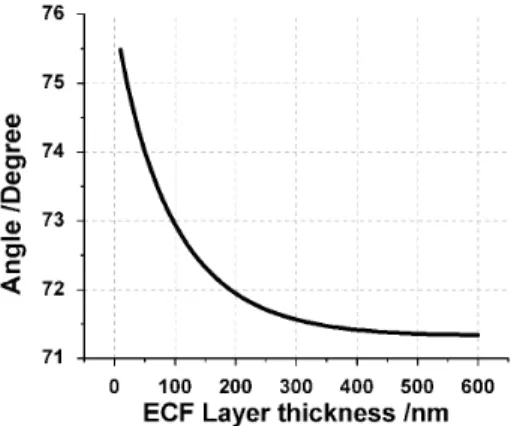
Using this model, a quantitative relation between ECF layer thickness and SPR angle was obtained, which is shown in Fig. S3. From the relation, we determined the cell-substrate distance, i.e., the thickness of ECF solution, from experimentally measured SPR intensity and intensity vs. angle curve, as discussed in the manuscript.
Fig. S3. Relation between ECF layer thickness and SPR angle determined from the seven-layer model.
4. SPRM video
SPRM videos were recorded to provide more informative presentation of the cell responses to the changes in the extracellular osmotic pressure. Movie S1 shows such a SPRM video of a cell during the stimulation of hypertonic solution (ECF + 50mM mannitol).
Movies S2 shows SPRM videos of another cell during the stimulation of hypertonic solutions, in order to demonstrate the generality of the present approach.