To Gamify or Not? The Development of a
Gamified Data Collection Instrument for
User Self-Reported Data
Full Paper
Tamilla Mavlanova Triantoro
University of Connecticut
[email protected]
Ram Gopal
University of Connecticut
[email protected]
Raquel Benbunan-Fich
Baruch College. City University of New York
[email protected]
Abstract
In this paper we discuss a gamified data collection instrument that is designed to indirectly collect user personality traits data. Specifically, we provide an integrated view of how the individual’s personality data can be obtained via gamified systems and discuss the influence of gamified systems on user enjoyment and data quality. With a sample of 226 individuals, we examined two research questions. First, we explored how personality characteristics can be obtained via gamified survey systems. Second, we investigated how gamified systems affect user enjoyment and focused attention as opposed to traditional online surveys. Our results suggest that gamified systems have the potential to capture user data and at the same time provide a higher level of enjoyment for users. This study paves the way for future research investigating whether gamification is an appropriate tool to improve the quality of user self-reported data.
Keywords
Data Quality, Online Surveys, Gamification, Big Five Personality Traits, Human Resources
Introduction
The big data and analytics revolution are predicated on the availability and access to complete and reliable data. With the growing data capturing capabilities, a larger number of businesses collect data about users of their services and conduct analytics to enhance service offerings and the company bottom-line. User self-reported data can influence important business decisions, including marketing campaigns, job offers and consumer product development. The need to get high quality user self-reported data therefore has practical significance for the design and improvement of existing data collection instruments. However, these efforts are often hampered by significant information asymmetry between businesses and users as essential data are not always revealed by users. There are a number of reasons for this growing asymmetry. Privacy concerns may lead users to conceal or submit false information. In addition, improper framing, lack of incentives, and motivation lead users to reveal less than fully.
There is a need to build information systems that are capable of capturing data in a less intrusive way. Our main contention in this research is that properly designed gamified systems can improve the existing ways of user data collection. We propose that gamification, or the use of gaming mechanics in non-gaming contexts, will improve the quality of data, while providing more enjoyment for respondents. In doing so, three questions have surfaced. First, if user self-reported data can be obtained via gamified survey systems. Second, if gamified systems provide more enjoyment than traditional surveys do. Third, if gamification is an appropriate tool to improve user data quality.
In this paper, we address the first two questions by building a gamified system that is capable of capturing user personality data based on the Big Five personality traits: agreeableness, conscientiousness, extraversion, neuroticism and openness to experience (McCrae and John 1992). The Big Five is considered the most widely accepted taxonomy of personality traits in psychology research (Almlund et al. 2011). Recently, the Big Five personality taxonomy received theoretical and empirical attention in the job performance and career success literature (Fang et al. 2015, Judge and Zapata 2015). To test the effect of gamified systems, we evaluate the gamified data collection instrument in the context of human resources and hiring. The results of this research are relevant in the area of human resources, as the theories of personality suggest that people perform better when their specific behavioral tendencies match their job characteristics (Barrick et al. 2001, Ng et al. 2005).
By suggesting an alternative approach to user data collection via a newly developed gamified system and validating measures of personality obtained via the system, we contribute to both research and practice. As an initial step, we develop a system that is capable of user data capture. This lays the foundation for future research to examine the influence of gamification in other areas of user data collection and its effect on data quality. In particular, we contribute to research by explaining how gamified systems can be designed to capture user data, and how the quality of data can be validated. We empirically demonstrate that gamified systems are able to capture user personality data and provide more enjoyment for users.
User Data and Gamification
User preferences data affect business decisions, marketing campaigns, online offers, product development and many other areas. The traditional way of obtaining user data is via surveys. The surveys have certain advantages as they are relatively cheap, can be administered online and produce structured data that are easy to analyze (Schmidt 1997). At the same time data collectors face the challenges of low response rates, low completeness rates and low accuracy. Lacking motivation, users may not respond to a call for a survey, and even if they do, they may submit surveys with missing or inaccurate data. Inaccurate data can be a result of a common scale bias, an acquiescence bias, an extreme responding bias or a social desirability bias. The common method bias occurs when two or more constructs are measured using the same method, for example Likert scales, that can lead to covariation produced by the same scale format (Podsakoff et al. 2013). The acquiescence bias occurs when respondents agree or disagree with everything that appears in the survey, by answering “Yes” or “No” to all questions (Podsakoff et al. 2003). The extreme responding bias occurs when respondents select a high or low number on a Likert scale and use it throughout the questionnaire. For example, a user can answer 7 on a 7-item Likert scale for all questions even for the reversed ones. Such answers are rarely useful as they do not represent actual opinions of users. The social desirability bias occurs when respondents want to project a more favorable image of themselves to others (Fisher 1993). This bias usually happens when people are asked questions about widely accepted norms of behavior. In these situations, people tend to over report what is accepted as a good behavior, and under report what is accepted as a bad behavior.
We believe that gamifying surveys, by adding game elements to a traditional survey, may provide a more enjoyable environment for respondents and mitigate survey related biases. Gamification is the adoption of games beyond entertainment and is based on the usage of games in our daily lives. The term gamification gained recognition around 2010 when it started being widely used both by academics and practitioners (Werbach and Hunter 2012). Some of the common definitions of gamification are the use of game design principles in non-gaming activities to improve user experience and engagement (Deterding et al. 2011), a process of enhancing services by motivational affordances to influence gameful experience and further behavioral outcomes (Hamari et al. 2014), and the creation of games for non-entertainment purposes and the transformation of existing systems into games (Seaborn and Fels, 2015).
Gamified systems are not always game-like but employ the same system of motivation as games do (Werbach and Hunter 2012). Unlike games, gamification is the use of a combination of game elements instead of developing a full-blown computer game (Schobel et al. 2016). Common game elements used in gamification are badges, scores, trophies, rankings, reputation points, group tasks, goals and avatars (Blohm and Leimeister 2013). Blohm and Leimeister (2013) classified gamification elements based on three groups: game mechanics, game dynamics, and game motives. Game mechanics is the use of game elements for designing a gamified system. Game dynamics describe the effect of mechanics on user
experience such as competition or collaboration. Game motives refer to internal driving forces that encourage people to play the game.
Based on the definitions described above, for the purpose of this research, we define gamification as using a combination of game mechanics in a non-game context for designing a gamified survey system that is capable of motivating users to provide self-reported data while improving the users’ enjoyment.
According to Werbach and Hunter (2012) there are three kinds of activities for which gamification can be particularly useful. They include creative work, mundane tasks and behavior change. Answering lengthy surveys can be uninspiring and repetitive task, thus gamification may positively affect the respondents’ motivation. While motivated customers make purchases more often and motivated employees are more productive (Werbach and Hunter 2012), we believe that motivated survey respondents will provide data of better quality because they will be more engaged in the process. Table 1 shows how the existing survey issues can be mitigated by the use of gamification.
Traditional Online Surveys Gamified Solution Outcome
Lack of incentives Enjoyment, intrinsic motivation Response rates will be higher
Missing Data Game design and progression Completeness will be higher
Acquiescence bias, Extreme responding Common method bias
Game design and progression Accuracy will be higher Social desirability bias People may act more naturally
while playing the game Accuracy will be higher
Table 1. The Advantages of a Gamified Solution
The goal of the study is to create a gamified system that improves data collection both for data collectors and respondents. We envision that survey respondents will be more motivated to complete gamified surveys because of their increased motivation and enjoyment. Data collectors, at the same time, will be able to collect data of better quality characterized with higher response rates, higher completeness and higher quality.
The first step in this line of research is to create a gamified survey instrument that is capable of collecting user data in a more enjoyable way for respondents. For this purpose, we created an instrument that is able to collect user personality data based on the widely accepted framework of the Big Five personality traits. The Big Five, a well-established methodology, was used to evaluate user personality and served as a benchmark for our gamified solution. The gamified solution was tested in the area of human resources with a purpose to evaluate the respondents’ personality traits prior to hiring.
Integrating Personality and Gamified Systems
“Personality is all of the attributes, qualities and characteristics that distinguish the behavior, thoughts, and feelings of individuals” (Saucier and Srivastava 2015, p. 283). Personality research suggests that performance at work may be improved if employees possess certain behavioral tendencies or personality traits (Barrick et al. 2001). When people find jobs that fit their personality they perform their jobs better and enjoy more success and satisfaction during their lifetime (Judge et al. 1999). Specific measures of individual personalities, such as Big Five relate to job performance and career success (Fang et al. 2015). The Big Five personality dimensions present a taxonomy of personality traits. These dimensions are derived from the analyses of natural language terms that people use to describe themselves (John and Srivastava 1995). Big Five is considered the most widely accepted taxonomy of personality traits in psychology research (Almlund et al. 2011). In addition, the Big Five taxonomy has received theoretical and empirical support in the literature related to job performance and how personality traits relate to occupations (Fang et al. 2015, Judge and Zapata 2015, Ones et al. 2007). Big Five was used in predicting
career mobility and career success (Gattiker and Larwood 1998, Seibert and Kraimer 2001), leadership (Judge et al. 2002(1)), job satisfaction (Judge et al. 2002(2), job instability (Wille et al. 2010), and upward job changes (Nies and Zacher, 2015).
The Big Five is a five factor structure that is typically labeled as Agreeableness, Conscientiousness, Extraversion, Neuroticism and Openness to Experience (John and Srivastava 1999). The Big Five factors are usually viewed in a continuum. A person who is high in one dimension, for example extraversion, typically scores lower in introversion which is another dimension of this factor.
Agreeableness epitomizes helpful, compliant, generous, kind and cooperative behavior (McCrae and John
1992). People who score high in agreeableness are generally easy going and sympathetic to others. People who score low in agreeableness are argumentative, stubborn, hostile and antagonistic. Agreeable people are prone to develop positive relations with others (Barrick et al. 2002) and show empathy towards other people (Nettle 2006). Agreeable people are more likely to form friendships (Selfhout et al. 2010). At the workplace, agreeable people may value interests of others more than their own (Wille et al. 2010), and may follow rather than lead (Boudreau et al. 2001). Agreeableness is also less positively related to job performance in competitive contexts (Judge and Zapata 2015).
Conscientiousness signifies individuals who are highly organized, dutiful, persistent, methodical and
determined (McCrae and John 1992). People who score low on this factor are often careless. Conscientious people are habitually chosen as work partners because of their competency and tendency to be hardworking. Prior research concluded that Conscientiousness shows a consistent relationship with job performance criteria for such occupational groups as professionals, police, managers, sales and skilled/semi-skilled jobs (Barrick and Mount 1991), and for conventional jobs such as accounting and farming (Gottfredson et al. 1993). Conscientious employees are found to stay on their current jobs due to sense of responsibility and higher dependability (Ng et al. 2007), and are less likely to seek novel job opportunities, namely because of risk aversion and cautiousness (Nies and Zacher 2015).
Extraversion refers to personality traits that reflect how outgoing, active, gregarious, assertive and
energetic the person is (McCrae and John 1992). Extraverts are sensitive to rewards and social attention and participate in various social activities (Ashton et al. 2002). Extraverts’ behavior may suggest a larger network of friends (Fang et al. 2015), however extraverts were found to fail to attract friends over time (Selfhout et al. 2010), and their perceived status was found to have a tendency to decline over time (Bendersky and Shah 2013). The opposite of extraversion is introversion that is expressed in a more reserved and self-contained behavior. People who are extraverts prefer public activities, participate in team activities and enthusiastically communicate with other people. Extraversion is a valid predictor for occupations that involve social interactions such as managers and sales (Barrick and Mount 1991), teaching or business management (Ackerman and Heggestad 1997), and leadership roles in multiple settings (Judge, et al. 2002). Extraverts change jobs frequently (Wille et al. 2010), and are not shy of initiating changes at the workplace if they are not satisfied with their job experiences (Judge et al. 2002(1)). Extraversion has positive relationship with performance in jobs that require social skills (Judge and Zapata 2015).
Neuroticism denotes the dimension of emotional stability. Neurotic people are unstable, insecure and
easily irritable (McCrae and John 1992). They exhibit frequent mood swings, can be difficult to deal with, and are often upset about their daily routine. Opposite of this dimension is emotion stability. People with a higher emotion stability are calm and may be effective leaders (Judge et al. 2002 (1)). Neurotic people often express negative emotions and are likely to be avoided (Fang et al. 2015). Neurotic employees may have low self-esteem and thus look for positive environment elsewhere, consequently, neuroticism is a good predictor for job changes (Feldman and Ng 2007).
Openness to Experience is associated with individuals who are interested in new things, are liberal,
intellectual, open-minded and imaginative (McCrae and John 1992). People with high openness have diverse interests and express tiredness from social experiences with conventional people (McCrae 1996), and thus, may have limited number of friends (Fang et al. 2015 (check)). At the same time, open people are considered more exciting conversational partners (Kashdan et al. 2011), and may be sought after for friendship (Fang et al. 2015). Those who score low in openness tend to be more conforming, conventional and conservative. Openness to Experience is positively related to upward job changes into managerial and professional positions (Nies and Zacher 2015), but also related to greater job instability (Wille et al. 2010).
Employees with high openness to experience prefer jobs with higher job status (Ng et al. 2005), and perform particularly well in situations that require innovative approach and creativity (Judge and Zapata 2015).
Empirical evidence also supports the view that combinations of personality traits influence professional choices and success. For example, higher levels of openness to experience and extraversion were found valid predictors for the training proficiency across all occupations (Barrick and Mount 1991). Lower levels of agreeableness, neuroticism and openness to experience predicted self-selection into the military after high school (Jackson et al. 2012). Conscientiousness and openness were found more important for jobs that require independent thinking, whereas, extraversion, neuroticism and agreeableness increased job performance in jobs that require dealing with unpleasant people (Judge and Zapata 2015).
Methodology
To test our research questions, we created a gamified system that is capable of capturing the Big Five personality traits. The game was built in HTML and contained 15 steps that guided a player through a series of tasks to complete the challenge. The players were offered to complete the challenge either alone or together with other hypothetical players, and answer a series of aptitude questions. The design and overall look of the game were informed by the analysis of existing text-based games.
The gameplay included a story driven adventure with a puzzle. A player took a role of a new hire and had to progress through several steps in order to contribute to the team score. The players did not know what their challenge was going to be and had to discover the game on their own. The structure of the game resembled solution games (Fullerton 2008) in which a player should solve a problem faster or more accurately than a competition. Examples of solution games are graphic adventures, textual adventures and games that have puzzle qualities. The game narrative adopted for this study is a combination of textual adventure and problem-solving.
Following the Blohm and Leimester (2013) classification, the game developed for this study contained the following mechanics, dynamics and motives:
1. Game Mechanics – goal, progression, points system, time pressure. Schobel et al. (2016) found
that four game elements are an ideal combination to provide a sufficient gamified experience. 2. Game Dynamics – competition and collaboration. Players had to compete against another team
and collaborate with their team to get more points.
3. Game Motives – intellectual curiosity, cognitive stimulation, achievement. Players were not
instructed of the content of the game, and had to discover the challenges on their own as the game progressed. The game contained an intellectual challenge that included a set of aptitude questions based on (Carter 2007).
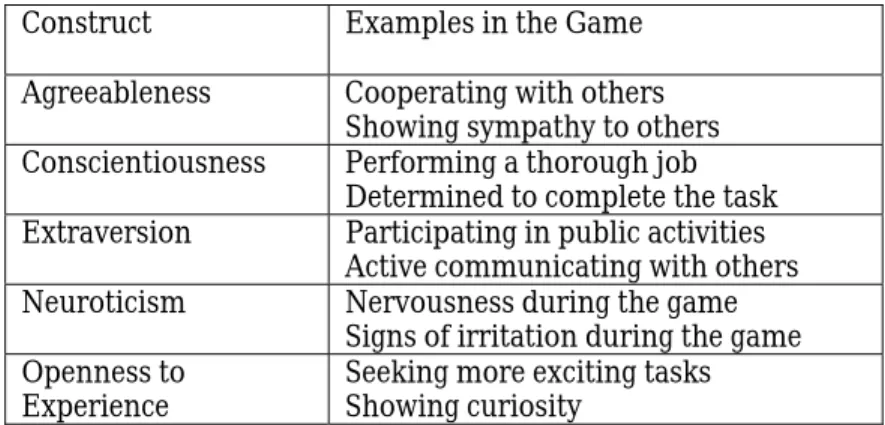
In order to establish a common task context, all participants were given a scenario according to which they had to complete a challenge to help their hypothetical team to win. To complete the task, participants were asked to make a selection whether to work alone or in a group, went through a series of personality related questions and then completed the challenge which included five aptitude questions. Agreeableness was tested by the willingness of participants to assist and cooperate with others in the game. Openness was evaluated by testing the participants’ curiosity and desire to get involved in more interesting challenges. Extraversion was assessed by the willingness of participants to communicate with others. Conscientiousness was evaluated by the readiness of participants to do a thorough job on the tasks in the game, and neuroticism was evaluated by the level of irritation or unhappiness during the game. The steps corresponded to the Big Five personality constructs (see Table 2). At the end of the game, participants were redirected to an online questionnaire developed in Qualtrics, which contained demographic questions, a Big Five survey (John and Srivastava 1999), and the engagement scale consisting of enjoyment and focused attention (O’Brien and Toms, 2010). To reduce the concern for common method variance (Podsakoff et al. 2013) several items were measured with reverse scales.
Construct Examples in the Game Agreeableness Cooperating with others
Showing sympathy to others Conscientiousness Performing a thorough job
Determined to complete the task Extraversion Participating in public activities
Active communicating with others Neuroticism Nervousness during the game
Signs of irritation during the game Openness to
Experience Seeking more exciting tasksShowing curiosity
Table 2. The Big Five Constructs
Fullerton (2008) suggests that to ensure a true game experience, a fundamental rule of gaming, a conflict, should exist in the game. The conflict can be in a form of competition or dilemma and the outcome of the game should be uncertain. The uncertainty of the game lies in an unequal outcome as games are not designed to provide the same outcome for everyone in order to have winners and losers. To satisfy this, our game had a progressive scenario with a set of choices on each screen of the game. The challenge part of the game included a timer and a scoring mechanism. The game and instructions were pilot tested and refined prior to their administration for this study.
Results
Participants were recruited from a large urban college in the Northeast of the U.S., and were randomly assigned to one of the two established conditions. The first condition was a game, followed by the survey, whereas the second condition had the survey first, followed by the game. The experimental treatment was administered online, including the instructions on how to proceed, to avoid experimenter effects and to ensure that all participants received the same information.
The sample consisted of 226 subjects with 121 and 105 subjects in conditions 1 and 2 respectively. There were 111 male and 115 female respondents. No systematic differences in gender were detected in the two conditions (chi-square 0.0232, p-value 0.879). The majority of the respondents were between 18-24 years old.
To compare the personality data collected by the survey and by the game, survey indexes and game scores were computed. For the survey items, confirmatory factor analysis was performed and the highest loading items in each factor with a cutoff of .60 were averaged to create indexes for each dimension. For the game questions, a composite score was created for each of the dimensions.
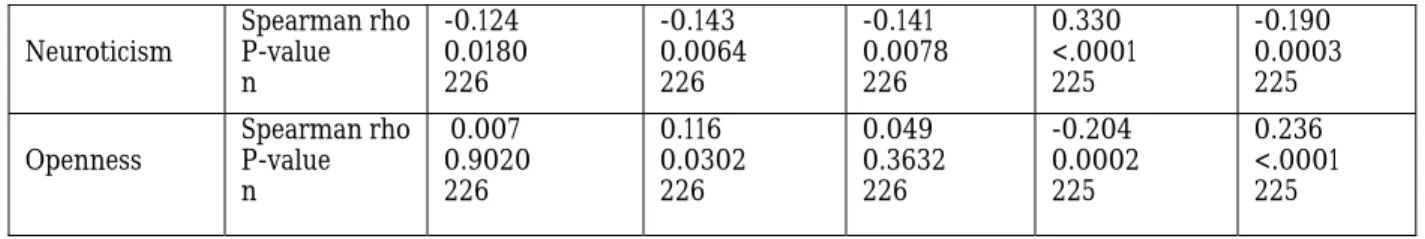
To ensure that a gamified solution is capable of capturing user data, we performed a series of tests in which the survey served as a benchmark. The results of a correlation analysis confirmed that data in both survey and the game are in the same direction and significant for all personality dimensions except conscientiousness (Table 3).
Survey Game
Coefficient
Agreeableness Conscientiousness Extraversion Neuroticism Openness Agreeableness Spearman rho P-value n 0.130 0.0145 226 -0.046 0.3770 226 -0.199 0.0002 226 -0.120 0.0259 225 -0.194 0.0002 225 Conscientious ness Spearman rho P-value n 0.014 0.7835 226 -0.007 0.8912 226 0.050 0.3524 226 -0.081 0.1356 225 0.0177 0.7370 225 Extraversion Spearman rho P-value n 0.115 0.0294 226 0.016 0.7626 226 0.157 0.0032 226 -0.104 0.0499 225 0.032 0.5401 225
Neuroticism Spearman rho P-value n -0.124 0.0180 226 -0.143 0.0064 226 -0.141 0.0078 226 0.330 <.0001 225 -0.190 0.0003 225 Openness Spearman rho P-value n 0.007 0.9020 226 0.116 0.0302 226 0.049 0.3632 226 -0.204 0.0002 225 0.236 <.0001 225 Table 3. Correlation Analysis
Then, we split the results, both in the survey and in the game, into low and high scores on each dimension to find out if respondents who scored low or high in the game on any of the dimensions, had the same score on corresponding dimensions in the survey. The survey data was collected via 5-item Likert scale questions. To perform the split into low and high scores, we used a median split for each construct. The game data was collected via binary responses with three questions per construct, the minimum number per dimension in the game was 0 and the maximum number was 3. The polarity of the composite scores was used to rank participants as high (scores of 2 or 3) or low (scores of 0 or 1) in each personality dimension. The game classification and the survey indexes were then compared via a non-parametric ANOVA analysis. The results are shown in Table 4.
For Agreeableness, participants who scored lowest in the game questions also obtained lower values in the corresponding index (2.92 vs. 3.17, Kruskall-Wallis test = 4.03, p<.05). Similar patterns are observed for extroversion, neuroticism and openness, where the Kruskall-Wallis statistics are significant at p<.001). In contrast, the results for conscientiousness are not significant. The means of the two groups (low and high game scorers) are very close to each other (2.71 vs. 2.76, respectively).
Constructs N Survey Index Mean (st.dev.) Game Frequency Split Index Means
Comparison Kruskal-Wallis non-parametric Anova n=0 n=1 Index Mean 0 Index Mean 1 Agreeableness 226 3.06 (0.77) 101 125 2.92 3.17 4.03*(p=0.045) Conscientiousness 226 2.75 (0.83) 60 166 2.71 2.76 0.11 p=0.73 (n.s.) Extroversion 226 2.46 (0.85) 83 143 3.33 3.58 8.04**p=0.004 Neuroticism 226 2.54 (0.84) 120 106 2.28 2.83 25.93***(p<0.0001) Openness 226 3.68 (0.67) 55 171 3.32 3.80 16.87***(p<0.0001)
Table 4. The Comparison of the Game Scores and Survey Indexes
Lastly, we compared individual scores in the game and the survey by calculating a percent agreement between survey results and game results for each individual participant. The game captures on average more than 60% of personality dimensions. (See Table 5).
Agreeableness Conscientiousness Extraversion Neuroticism Openness
Match 60% 56% 59% 67% 64%
No Match 40% 44% 41% 33% 36%
Total 100% 100% 100% 100% 100%
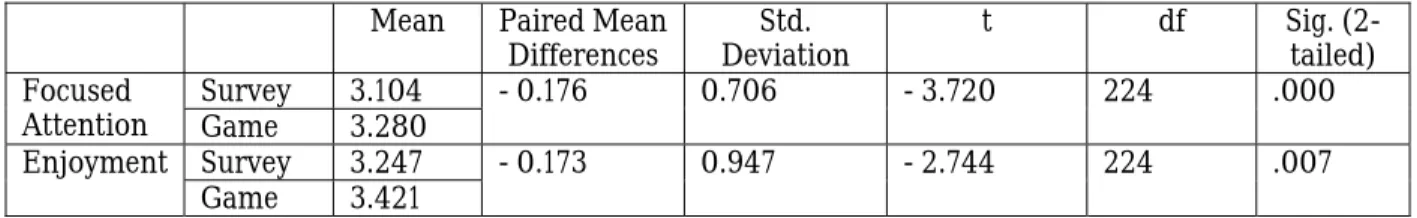
Further, to ensure that the game provided more enjoyable experience for respondents, we evaluated the focused attention and enjoyment of respondents by conducting a paired t-test. Focused attention and enjoyment were measured based on the engagement scale (O’Brien and Toms, 2010) and consisted of three five-item Likert scale questions per construct. We found that both attention and enjoyment are higher in the gamified condition (See Table 6).
Mean Paired Mean
Differences Deviation Std. t df Sig. (2-tailed) Focused
Attention Survey 3.104 - Game 3.280 0.176 0.706 - 3.720 224 .000
Enjoyment Survey 3.247 - 0.173 0.947 - 2.744 224 .007
Game 3.421
Table 6. The Comparison of Focused Attention and Enjoyment
Discussion
The aim of this study is to compare the feasibility of collecting self-reported data via a gamified survey with traditional online survey instruments. The results show that our gamified system is indeed capable of gathering valid data while improving users’ attention and enjoyment. A comparison of game scores vis-à-vis the survey results shows an average of 60% match between the game answers and the survey responses, and the relation is significant in all, but one, of the five personality dimensions. The game design will be refined to improve the correspondence between the game questions and the survey items. These findings provide positive evidence to address the two questions motivating this research. First, the significant correlation results, and percent agreement, show that valid user self-reported data can indeed be obtained via gamified survey systems (RQ1). Second, the statistical comparisons between game and survey on enjoyment and attention show that gamified systems provide a more engaging environment than traditional surveys do (RQ2).
These results have limited generalizability due to the nature of the IT artifact and the participant population. We custom-designed a novel gamified system that proved to be fun and enjoyable for participants. Other gamified systems with alternative designs may yield different results. Similarly, our subject population (college age students) may be particularly inclined to play games and prefer gamified environments, compared to older participants.
We have shown that gamified system can work in capturing big five personality traits. Further refinements to the game system are clearly needed to more fully and accurately measure these constructs. In addition, our results indicate that the user involvement and engagement are enhanced when the data collection is gamified. We can then logically infer that a gamified system naturally leads to higher quality of collected data. However, a robust empirical study is needed to demonstrate if and to what extent the data quality improves. To design such a study, a setting where the ‘ground truth’ is known is needed to measure data quality. We are currently working along these lines.
Contributions and Conclusions
The contribution of this research is the development of a new data collection instrument that captures personality traits and measures the personality less intrusively. While developing the instrument, we created an effective game design narrative that increases focused attention and enjoyment of survey respondents
This paper discusses the first step in the development of gamified surveys for user data collection based on the Big Five personality traits. The significant results in all but one personality dimension provide evidence of the game potential to collect valid personality data.
These findings pave the way for future research. The further steps will be refining the gamified solution and testing it with different populations. After the game design is refined, data quality will be tested.
REFERENCES
Ackerman, Phillip L. and Heggestad, Eric D. 1997. "Intelligence, Personality, and Interests: Evidence for Overlapping Traits." Psychological Bulletin (121:2) pp. 219-245.
Almlund, M., Duckworth, A. L., Heckman, J. J., and Kautz, T. D. 2011. “Personality psychology and economics”. National Bureau of Economic Research.
Ashton, M.C., Lee, K. and Paunonen, S.V., 2002. “What is the central feature of extraversion? Social attention versus reward sensitivity”. Journal of personality and social psychology, (83:1), pp.245.
Barrick, M. R., and Mount, M. K. 1991. “The Big-Five personality dimensions and job performance: A meta-analysis,” Personnel Psychology, (44:1) pp. 1-26.
Barrick, M.R., Mount, M.K. and Judge, T.A., 2001. “Personality and performance at the beginning of the new millennium: What do we know and where do we go next?.” International Journal of Selection
and assessment, (9:1‐2), pp.9-30.
Bendersky, C. and Shah, N.P., 2013. “The downfall of extraverts and rise of neurotics: The dynamic process of status allocation in task groups,” Academy of Management Journal, (56:2), pp.387-406.
Blohm, I., and Leimeister, J.M., 2013. “Gamification: Design of IT-Based Enhancing Services for Motivational Support and Behavioral Change,” Business Information Systems Engineering (5:4), pp. 275–278.
Boudreau, J.W., Boswell, W.R. and Judge, T.A., 2001. “Effects of personality on executive career success in the United States and Europe,” Journal of vocational behavior, (58:1), pp.53-81.
Carter, P., 2007. IQ and psychometric tests: Assess your personality, aptitude and intelligence. Kogan Page Publishers.
Deterding, S., 2012. “Gamification: designing for motivation,” interactions, (19:4), pp.14-17.
Fang, R., Landis, B., Zhang, Z., Anderson, M. H., Shaw, J. D., and Kilduff, M. 2015. “Integrating personality and social networks: A meta-analysis of personality, network position, and work outcomes in organizations,” Organization Science, (26:4), pp.1243-1260.
Feldman, D.C. and Ng, T.W., 2007. “Careers: Mobility, embeddedness, and success,” Journal of management, (33:3), pp.350-377.
Fisher, R.J., 1993. “Social desirability bias and the validity of indirect questioning,” Journal of consumer
research, (20:2), pp.303-315.
Fullerton, T., 2014. Game design workshop: a playcentric approach to creating innovative games. CRC press.
Gattiker, U.E. and Larwood, L., 1988. “Predictors for managers' career mobility, success, and satisfaction,” Human relations, (41:8), pp.569-591.
Gottfredson, G.D., Jones, E.M. and Holland, J.L., 1993. “Personality and vocational interests: The relation of Holland's six interest dimensions to five robust dimensions of personality,” Journal of Counseling Psychology, (40:4), pp.518.
Hamari, J., Koivisto, J., and Sarsa, H. 2014. “Does Gamification Work?: A Literature Review of Empirical Studies on Gamification,” Hawaii International Conference on System Science , pp. 3025–3034.
Jackson, J.J., Thoemmes, F., Jonkmann, K., Lüdtke, O. and Trautwein, U., 2012. “Military training and personality trait development: Does the military make the man, or does the man make the military?” Psychological Science, (23:3), pp.270-277.
John, O.P. and Srivastava, S., 1999. The Big Five trait taxonomy: History, measurement, and theoretical perspectives. Handbook of personality: Theory and research, 2(1999), pp.102-138.
Judge, T.A., Bono, J.E., Ilies, R. and Gerhardt, M.W., 2002. “Personality and leadership: a qualitative and quantitative review,” Journal of applied psychology, 87(4), p.765.
Judge T.A., Heller D., and Mount M.K. 2002. “Five-factor model of personality and job satisfaction: a meta-analysis,” Journal of Applied Psychology, 87, 530–541.
Judge, T.A. and Zapata, C.P. 2015. The person–situation debate revisited: Effect of situation strength and trait activation on the validity of the Big Five personality traits in predicting job performance.
Academy of Management Journal, (58:4), pp.1149-1179.
Kashdan, T.B., McKnight, P.E., Fincham, F.D. and Rose, P., 2011. “When curiosity breeds intimacy: Taking advantage of intimacy opportunities and transforming boring conversations,” Journal of personality, (79:6), pp.1369-1402.
McCrae, R. R., and John, O. P. 1992. “An introduction to the five‐factor model and its applications,”
Journal of personality, (60:2), 175-215.
Nettle, D., 2006. “The evolution of personality variation in humans and other animals,” American
Psychologist, (61:6), p.622.
Ng, T.W., Eby, L.T., Sorensen, K.L. and Feldman, D.C., 2005. “Predictors of objective and subjective career success: A meta‐analysis,” Personnel psychology, (58:2), pp.367-408.
Ng, T.W., Sorensen, K.L., Eby, L.T. and Feldman, D.C., 2007. “Determinants of job mobility: A theoretical integration and extension,” Journal of Occupational and Organizational Psychology, (80:3), pp.363-386.
Nieß, C., and Zacher, H. 2015. “Openness to experience as a predictor and outcome of upward job changes into managerial and professional positions”. PloS one, 10(6)
O'Brien, H. L., and Toms, E. G. 2010. “The development and evaluation of a survey to measure user engagement. Journal of the American Society for Information Science and Technology,” (61:1), pp. 50-69.
Ones, D.S., Dilchert, S., Viswesvaran, C. and Judge, T.A., 2007. “In support of personality assessment in organizational settings,” Personnel psychology, (60:4), pp.995-1027.
Podsakoff, P.M., MacKenzie, S.B., Lee, J.Y. and Podsakoff, N.P., 2003. “Common method biases in behavioral research: a critical review of the literature and recommended remedies,” Journal of
applied psychology, (88:5), p.879.
Podsakoff, N.P., Whiting, S.W., Welsh, D.T. and Mai, K.M., 2013. “Surveying for “artifacts”: The susceptibility of the OCB–performance evaluation relationship to common rater, item, and measurement context effects,” Journal of Applied Psychology, (98:5), p.863.
Seaborn, K. and Fels, D.I., 2015. “Gamification in theory and action: A survey,” International Journal of Human-Computer Studies, 74, pp.14-31.
Seibert, S.E. and Kraimer, M.L., 2001. “The five-factor model of personality and career success,” Journal of vocational behavior, (58:1), pp.1-21.
Selfhout, M., Burk, W., Branje, S., Denissen, J., Van Aken, M. and Meeus, W., 2010. “Emerging late adolescent friendship networks and Big Five personality traits: A social network approach,” Journal of personality, (78:2), pp.509-538.
Schmidt, W.C., 1997. “World-Wide Web survey research: Benefits, potential problems, and solutions,” Behavior Research Methods, Instruments, & Computers, (29:2), pp.274-279.
Schöbel, S., Söllner, M., and Leimeister, J. M. 2016. The Agony of Choice–Analyzing User Preferences regarding Gamification Elements in Learning Management Systems. International Conference for Information Systems, Dublin, Ireland.
Werbach, K. and Hunter, D., 2012. For the win: How game thinking can revolutionize your business. Wharton Digital Press.
Wille, B., De Fruyt, F. and Feys, M., 2010. “Vocational interests and Big Five traits as predictors of job instability,” Journal of Vocational Behavior, (76:3), pp.547-558.