STUDY TO EVALUATE THE PERFORMANCE DEVELOPMENT OF BRAZILIAN FRANCHISE SEGMENTS
Alvaro Luiz Neuenfeldt Júnior Federal University of Santa Maria, UFSM – Brazil E-mail: [email protected] Julio Cezar Mairesse Siluk Federal University of Santa Maria, UFSM – Brazil E-mail: [email protected] Marlon Soliman Federal University of Santa Maria, UFSM – Brazil E-mail: [email protected] Kelen Franciane Scheroldt Marques Federal University of Santa Maria, UFSM – Brazil E-mail: [email protected] Submission: 08/10/2013 Revision: 30/10/2013 Accept: 08/11/2013
ABSTRACT
The gradual development of the control systems and management of information about the organizations environment through measurement systems made, in this day and age, the reflection of reality. For the Brazilian franchise system this relationship is not different, evidenced by the variation of more than three times the amount raised in comparison to gross revenues achieved since from 2012 until 2001 in Brazil. Given this scenario of growth, this article has for primary objective to propose a performance development system for a segment of existing franchises in Brazil, through the elaboration of indicators related to external factors considered business critical success factors, based on financial and non-financial data made available publicly by the Brazilian Franchising Association (ABF). As a result, five performance indicators were developed for the system in question, in addition to the application of this model in a specific thread within the franchise system for the purpose of analyzing the information obtained
and testing the reliability of the parameters used, identifying both that the model is reliable in accordance with the criteria established.
Keywords: competitiveness; franchise segments; management; performance development; production engineering.
1. INTRODUCTION
Currently, the competition to keep and expand new markets makes management and systematic control of data regarding the business becomes a highly necessary task, where the assessment of the position in which the company is, in relation to the market, one of the correct paths to be followed to convert diffuse and independent data in accurate information, in order to demonstrate the real behavior of the system in which it is inserted (KAPLAN; NORTON, 2008; PORTER, 2009; PARMENTER, 2010; MEDEIROS; ROIBEIRO, 2013).
In this context, the franchises can be regarded as a form of commercial business that encompasses, among several factors, the production and distribution of consumer goods, established under contracts signed between two parties: the franchisor, responsible for the brand and the franchisee, which signals with the use of the trademarks (AAKER, 2004; RIBAS, 2006; MAURO, 2006; SILVA; AZEVEDO, 2012).
Along with the growing competitiveness between organizations observed since the last century, the interest in studies about the dynamics that involves organizations is present in academic subjects, expanding to the franchise market and, in particular, to the development of the franchise system in Brazil and its economic importance, being directly linked to entrepreneurial studies in the relationship between franchisees and franchisors, characterized, mainly, through the relationship between mortality rates of business, where franchises have a 20% smaller rate in relation to new ventures that does not have this kind of support (LACOMBE; HEILBORN, 2003; ABF, 2012).
In this sense, the main objective of this article is to demonstrate the application of a model to performance development of an existing franchise segment in Brazil, through the elaboration of indicators related to the external critical success factors considered as the most relevant for franchise system , including the verification of the
results obtained for each branch of activity, in order to identify potential points of improvements, evaluating the behavior of the results as the proposed calculations.
The reader must be warned that this research does not intend to advise, recommend, or link any information regarding the particular situation of any of the companies studied. Instead, it seeks to highlight the plight of the companies jointly, as the proposal found in the study.
In order to meet the characteristics of the system, the methodology involves the applied research, using as the basis the intuitive method, starting from the observation of the characteristics of the particular case in relation to a segment of franchises until checkout. Since this model is based on experimentation, it was possible to use statistical techniques to verify its confiability, in order to control the variables used, featuring as a quantitative analysis, thus avoiding the production of disturbed effects unrelated to reality investigated (GIL, 2010; MINAYO, 2010).
To the performance development system, it was proposed the use of the methodology known as Key Performance Indicators (KPI) in conjunction with the indicators standardization method presented by PerformancePoint Server software (2007), widely spread for the conversion of different scales in common standardized metrics, enabling the development of general classifications, in order to compare the values established for the research purpose.
In addition, the technical procedures used were based on the monographic method, and the primary data was collected through semi-structured public information of the organizations studied, available at the official franchise guide 2012 prepared by the Brazilian Franchising Association (ABF), plus the use of references and reviewing documents with scientific basis to support and clarify the problem discussed in descriptive form.
2. THEORICAL REFERENCES
The performance evaluation is a process inherent in human nature, where interaction and action between the various members of one or more groups are analyzed according to the optics and the goal of the individual evaluators (NEELY, 2005; KAPLAN; NORTON, 2008; PARMENTER, 2010).
This way, after the evaluation of the available systems consistent to the scenario to model and to develop performance indicators, we opted to use the KPI as parameters of the model, to be able to define financial and non-financial metrics to express the evaluation of the Critical Success Factors (CSF) of an organization or project, in order to obtain quantitative results on certain activity for a given period of time (OLSON; SLATER, 2002; PARMENTER, 2010; PERRAZZA; RODRIGUES, 2010; PAVLOV; BOURNE, 2011).
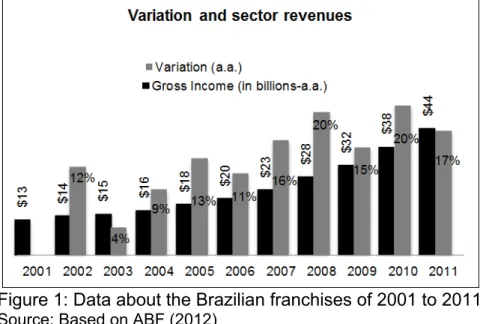
In Brazil, the franchises that belong to the category called regulator of the ABF reached in 2011 an annual revenues of $ 44 billion, equivalent to about 2.14% national Gross Profit, through a network with more than 2,000 companies distributed in a total of approximately 93,000 franchised units throughout the country, generating a total of 838,000 jobs directly (ABF, 2012).
Due to the success achieved with the expansion in recent years, the industry has been undergoing a process of activities expansion, resulting in an average gross growth of 16% per year since 2005 and more than 200% considering the difference from 2001 to 2011, according to the description mated in Figure 1.
Figure 1: Data about the Brazilian franchises of 2001 to 2011
Source: Based on ABF (2012)
Some points have fundamental importance for the notorious growth of franchises, like: safety in relation to the investment made against financial crisis and opportunities economic recessions, increase in the number of people living in urban areas, and lack of services and products that meets the demand required by the population (CRETELLA, 2003; WINDSPERGER; DANT, 2006; LAVIERI, 2008).
Because of this expansionist characteristic, the franchise management is considered an innovative organization form that has radically modified the vision of the small and medium enterprises, characterized by the structure of networked collaboration, thus to other aspects of its organizational architecture, requiring business management and technological forms more evolved than traditional enterprises (RODRÍGUEZ et al., 2005; GRUNHAGEN; MITTELSTAEDT, 2005).
3. PROPOSED MODEL
The steps of the modeling follow the definition of indicators, through hierarchical levels, where the central strategy for the proposal has been defined as the study of the current context of Brazilian franchises, by determining the level at which each segment of franchising held their activities, taking for reference the year 2012.
Thus, the determination of objective indicator (KPIs) was performed through of
the various formatting categories belonging to the franchises group, following the parameters and guidelines set out and the way in which these interact with each other, using Equation (1) below described:
∑
. (1)
Where c ∈ 1, 2, … , is the number of existing branches in the analysis and
KPIram is the set of indicators found for each organization (KPIemp) belonging to categories of franchise segment in question, in accordance with the Equation (2), for
f ∈ 1, 2, … , represents the number of companies that are listed according to each branch.
∑
, (2)
The determination of the target (Ts) for the KPIs obeys the criteria where
performance is considered satisfactory, according to a parameterized value between
a maximum ( ) and minimum ( ) of scores that this indicator can
achieve, involved by defining variables of expected behavior for the studied context δ
(in relation to ) and γ (in relation to ), where the higher the value of δ
and the smaller the value of γ, less demanding is the model proposed, according the
1 ↔ . (3)
The definition of indicators that make up the KPIemp is held as the strategic
objective for organizational best practices, that leads to obtain superior performance, enabling an enterprise to look the way that the others companies of the same class (or similar) get their results, taking into consideration that the franchise systems can be analyzed contextualized with the operating results and characteristics of the strategies applied, through non-confidential data made available to general public (HAPONAVA; AL-JIBOURI; 2009; SILVA; AZEVEDO, 2012).
The strategy on the franchisor part should be directly linked to the input factors to market, as well as stabilization of attraction and differentiation factors aimed at the protection of the quality of the products or services offered (ROTHAERMEL et al., 2006). It is also considered the status of the relationship between the franchisor and franchisees, even empirically, in order to develop the effective management of information incorporated in the system, focusing on activities and indicators able to achieve good results for both, focused on generating a sense of unity and mutual cooperation between the two parts (CORONA, 2009).
The economic basis of franchises are directly linked to possible operating profit or losses that the company may represent for the stakeholders, being a major factor for potential generations of opportunity (CASTROGIOVANNI et al., 2006). Thus, to make the decision to invest or not, it is necessary to take into account the market value of the franchise, which is the present value in relation to receivables future values discounted in the cash flow, considering the investment, expenditure and revenue over the all periods, in order to apply the criteria for the investment analysis (RAUCH et al., 2009).
This way, the strategic study of these two dynamics serves as the basis for determining the situation of a franchise over their direct and indirect competitors. To this end, in addition to the references already cited, literary works such as Shane and Maw-Der (1999), Dant and Kaufmann (2003), Lafontaine and Shaw (2005), Mauro (2006) and Silva and Azevedo (2012) have been used as the basis to support the definition of performance indicators developed for the measuring system, as shown
in Table 1 below.
Table 1: Indicators used for the study of franchises
Indicator (Basis) Characterization KPId Measurement Unity
Size of franchise system
(non-financial)
The customer demand is directly related to the spanning conditions of franchises, as its branch of activity and the products/services sold, to facilitate access of customers and increase the mark exposure.
KPI1 Absolute
Brand excelence (non-financial)
For this case, it is related to three basic criteria for the measurement of excellence: (i) the awards by a recognized organization in the franchise system; (ii) the growth rate of the franchise since its opening; and (iii) the services offered by the franchisor in relation to franchisee, through the definition of thirteen aspects of support, based on the works of Windsperger and Dant (2006) and ABF (2012).
KPI2 Absolute
Investment reliability (financial)
By definition, known as the portion of the remuneration of the capital invested, the measurement of profitability to acquire a franchise for the franchisee is critical to guide towards choosing the best alternative among several financial options available on the market.
KPI3 Currency (Dollar)
Financial strength (financial)
The monthly gross revenues reflects the conditions of products sales and services, with focus on quantity or value added through marketing, being the indicator that best fits the potential of generating financial gains by the franchisor with the use of the mark.
KPI4 Absolute
Financial obligations with taxes (financial)
In order to appreciate the balance in the relationship between the franchisor and the franchisee, the projection of remuneration rates can be performed according to the type of franchise, where are considered the costs related to the development of the strategic plan and the franchising system until the economic balance point.
KPI5 Percentage
The conclusion about the use of this number of indicators is assumed in order to clearly express the facts about the franchise system, including the factors set as more relevant to its evaluation. As described previously, the evaluation of the
KPIemp depends on the relationship between the five indicators defined, but cannot perform the direct comparison of these, because each one has an unique unit of measurement according its metrics, being required to normalize each of them to the same default unit of measurement, in this case the percentage (%). To this end, the
Briefly, the first step, called raw score ( ), refers to the comparation of the actual values obtained with the targets set by the company that, posteriorly, will
undergo the F tracks intervals, characterized qualitatively according to the reality
studied, which are composed by a lower limit ( ) and a higher limit ( ). So, the
is inserted in any of these tracks, according to its performance. The next step
comprehends the determination of the limit factor ( ) characteristic of each track,
calculated in proportion to the difference between the lower and upper limits of these, regardless of the performance in the raw score.
Meanwhile, the converted score ( ) is calculated by the relation of the
distance between the raw score ( ) with the limits of the track F where it is
located. Finally, this value is adjusted in relation to the lower limit value ( ) of the
track considered of minor importance, in order to determine the amount of
adjustments necessary to standardize the raw scores, yielding in the end the
normalized value of the indicators, as shown by Equation (4):
(4)
After this data processing, occurs the verification of the performance level of each branch and, consequently, of the sector chosen for the study, based on the evaluation of each companies, according to the Equation (5), being now possible to
perform the calculation for KPIs proposed previously by Equation 1, to get the final
value to be compared with the proposed target in Ts, generating the possibility of
obtaining conclusions regarding the application of the model.
∑
(5)
Aiming to better understand the behavior of the indicators in relation to the context and possible changes that may influence the profile of results, it was proposed the verification of the variables used, to demonstrate the level of reliability of the model, in way to check the level of significance of the variation found in the
values. This was obtained by the sensibility analysis of trend curves ( ) for
each of them, considering the coefficient of determination R²=0,99 for all, because
the returned value fits the tendency line over the curve determined by the results satisfactorily.
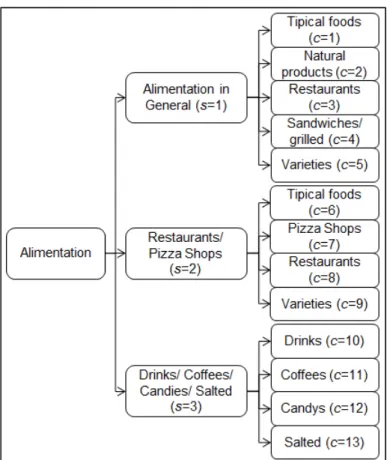
To test the modeling, it is proposed the application for franchises associated with the category Alimentation, because these besides having a high rating in relation to annual gross sales of franchises in Brazil (second with 22% of the market), have the highest growth rate, for the same criterion, found since 2010 (104%) (ABF, 2012). Thus, in order to find similar companies in the same group, the ABF separated the
category into three distinct segments: Alimentation in General (s=1),
Restaurants/Pizza Shops (s=2) and Drinks/Coffees/Candies/Salted (s=3), following
the flow described by the Figure 2.
Figure 2: Segments and branches contained in the category Alimentation The calculation is proposed from the prior definition by the researchers, where the limits and ranges of the five tracks were developed to standardize the
performance level, according to the relation: Unsatisfactory (F=1): 0%;
30%; Reasonable (F=2): 31%; 50%; Moderate (F=3): 51%;
75%; Satisfactory (F=4): 76%; 90%; and Very satisfactory: (F=5):
91%; 100%.
It is possible to verify that five tracks were scaled, in which the raw score may
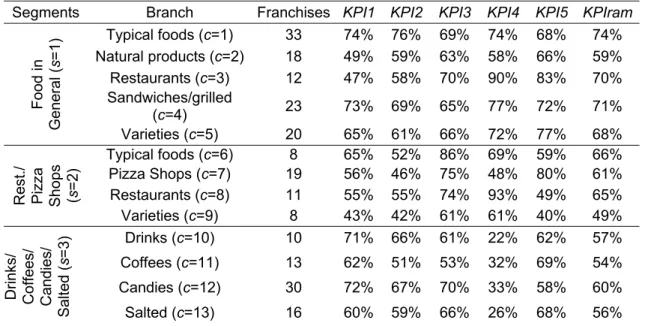
total for each branch, as shown in Table 2, for Ts=70%.
Table 2: Obtained results for each branch
Segments Branch Franchises KPI1 KPI2 KPI3 KPI4 KPI5 KPIram
Food in Gene ral ( s =1 ) Typical foods (c=1) 33 74% 76% 69% 74% 68% 74% Natural products (c=2) 18 49% 59% 63% 58% 66% 59% Restaurants (c=3) 12 47% 58% 70% 90% 83% 70% Sandwiches/grilled (c=4) 23 73% 69% 65% 77% 72% 71% Varieties (c=5) 20 65% 61% 66% 72% 77% 68% Res t./ P izza Shops (s=2
) Typical foods (Pizza Shops (cc=7) =6) 19 8 65%56% 52% 86% 69% 59% 46% 75% 48% 80% 66% 61%
Restaurants (c=8) 11 55% 55% 74% 93% 49% 65% Varieties (c=9) 8 43% 42% 61% 61% 40% 49% Drin ks / Coffees / Can die s/ Salted ( s =3 ) Drinks (c=10) 10 71% 66% 61% 22% 62% 57% Coffees (c=11) 13 62% 51% 53% 32% 69% 54% Candies (c=12) 30 72% 67% 70% 33% 58% 60% Salted (c=13) 16 60% 59% 66% 26% 68% 56%
For foods in general ( 1), the branch of Typical Foods Specialized is the
one with the best overall result, especially standing out in the set of indicators based
on non-financial ( 1 74% e 2 76%) , keeping in addition a good average
score in relation to economics (70.33%), only behind the branch of Restaurants
(81.00%). As key-points to getting results is possible to mention the high number of
open networks in the country (1,874 networks), mainly due to the characteristics of marketing are in agreement with those found in shopping malls, a consequence of the characteristics of products and business formats of the branch.
Another important point is the number of awards won by the Seal of Excellence awarded by ABF, where approximately 50% of companies in the branch are stamped, 15% higher than the rate found for the second place (Sandwiches/grilled). Regarding the branch Restaurant, according to the previous description, it is worth the emphasis on financial indicators, results mainly due to the superior relationship found between the average monthly billing offered by franchise, on average $ 10,715.36 higher than the second place, besides offering high returns over the invested capital, with averages leverages by companies of 17.33 times the amount invested for a period of check equal to 60 months.
For the branch of Varieties, it is worth noting that this has the best franchise placed at the end of the classification, which contributed to the overall result achieved
1 65% and 2 61%. What made it difficult to obtain a more significant result was the wide variety of formats of the companies involved in this group, where the results of three companies located among the ten worst placed influenced to not achieving a more expressive result.
Potentially, the negative highlight of the study was for the Natural Products Branch, which obtained an overall score of 59%, due to the worst economic results
found ( 3 63%, 4 58% and 5 66%), fact derived from the low
expectation of average gross revenues per franchise ($ 36,527.78), 37% lower than that observed for the second worst result, in addition to a standard average investment 15% lower than the highest, making the relationship between revenues and investment negative in 22%, counting the gap between the financial support required and the projected returns.
Finally, the segment achieved a result of 69%, where together with the
branches of Typical Foods Specialized ( 72%) and Sandwiches/Grilled
( 71% were the only ones who achieved results above the target set,
being possible to assert that most of the companies located in these branches are characterized by the same behavior profile in the franchisor-franchisee relationship, so as to be further consolidated because they have higher levels both in the series of economic indicators as in the non-economic.
Regarding the classification of franchises individually, although this is not the focus of the work, it was found that 55 of 106 franchises analyzed (52% of total) were above the mark of 70% set as the minimal ideal, with emphasis again to the branch of Typical Foods Specialized, because among the fifteen best companies ranked, nine belong to this group, justifying the good placement obtained in overall result.
For the category Restaurants/Pizza Shops, it was found that the Typical foods reached the best result with 66% of the total possible, highlighting in the first place in
two of the five indicators, 1 65% and 3 86%, which the second is
established by an average profitability among its eight franchises of $ 24,27, 20% higher than the second best (Pizza shops: $ 20,23).
Moreover, the rest of its KPIs (KPI2, KPI4 and KPI5) are located in second
the average rate between the gross billing and the necessary investments equivalent to 3.54 on a scale maximum of five points.
In third place is located the Pizza Shops, from the good results determined by
economic indicators above the target 5 80% and 3 75%, favored by the
good relationship between the fees charged and the estimated revenue possible to be obtained with the franchise (27%), six percentage points higher than the second best (Typical foods). Finally, the branch Varieties is found in the last place, where
only the KPI4=61% does not represent the worst results established for this segment,
thus proving its disadvantaged situation both in economic and non-economic, in
order to require a highereffort of managers to improve the situation encountered.
In general, Restaurants/Pizza shop ( 2) reached a score of 60%, where 15
of the 46 franchises (33%) had results equivalent or superior to 70%, being six of them located in the branch Pizza Shops and five in Typical foods. In particular the verification of branches, it can be stated that, although some good values stipulated in both factors, none of these has reached the target pre-established of 70%, making it a warning signal to the need for improvements in respect the companies within this segment.
For the third segment (Drinks/Coffees/Candies/Salted) the Candy branch, with 60%, it is ranked as the most successful on. This fact is determined basically by the good results obtained from the non-financial (70%) and financial (53%) indicators, due to the predominance of their scores in relation to four of the five proposed, a fact
that is not observed only for KPI5 (58%) because of the relative ratio of monthly fees
is 4% higher when compared to the second worst (Drink branch).
Thus, as key points for the success of this business group, it has the highest absolute number of open networks in the country (2,355 networks), mainly due to the products featured as marketing of chocolates, which typically have large sales in Brazilian Shopping Centers.
Then, the Drink branch took the second place with 57% of total score, due
mainly to non-financial indicators ( 1 71% and 2 66%), in which factors
such as the average of total open networks by franchise (124), 58% higher than the second best placed (with an average of 79 companies), in addition to registering a
for others branches, being these two characteristics enablers of strong market presence of this brands towards consumers. For the third major branch with a score that reached 56%, the Salt, it was observed results within the average for both natures of the proposed indicators.
Finally, the branch called as Coffees has been ranked in the last place, with only 54% of the value reached, although in relation to other groups it obtained a high
value for KPI5 (69%), mainly on the relationship between investment and gross sales
benefits possible to be conquered.
In general, through the calculation proposed by Equation (1) and to a target set as 70%, it was possible to identify that Drinks/Coffees/Candies/Salted achieved a segment result of 57%, 13% lower than the stipulated as the minimum for consolidation, in which similarly none of its four branches exceeded the performance
expectations calculated in Ts.
The result found in KPI4 for all groups receives a special highlight. With an average value equal to 29%, it represents a poor relationship for the estimates of gross financial returns (overall average of $ 23,000.00/month per franchise), fact that should be carefully observed at the moment of formatting each business plan, especially when these values are compared to the proposed investment for its opening (overall average of $ 130,000.00), in order to offer an additional attractive to their current or prospective investors.
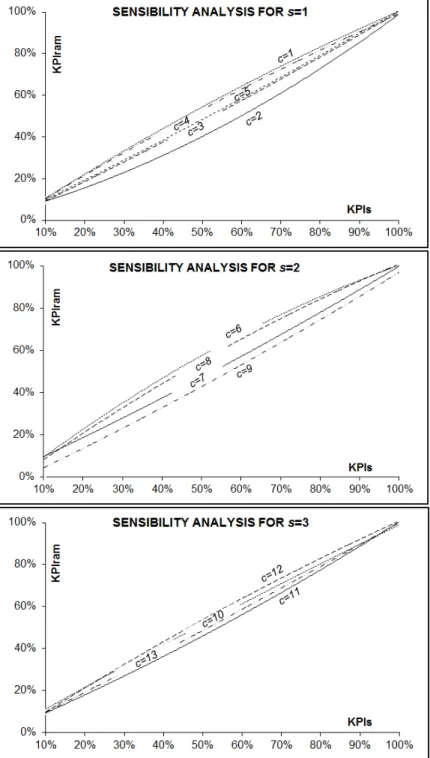
To verify the model confiability, it was proposed the use of the technique known as sensitivity analysis, which makes possible to check the behavior of the
model in response to changes in the Ts values, being able to observe the final
seeding behavior. The focus in this case is directly linked to the results of each one of the five branches belonging to segments studied, according to Figure 3.
Figure 3: Results of sensitivity analysis for the segments under study
It was found that the largest differences are in the ranges located at the extremes of the three graphs (on average below 13% and above 90%), being possible to consider this variation as acceptable, because of the greatest variation found is below 3%, not influencing substantially the reliability of the proposed model. For the range contained between 13% and 90%, it was not observed significant changes in the relative positions to the system, being consistent to state that the
each, respecting the behavior characteristics of the curves, taking into account the profile of the branches analyzed.
5. CONCLUSIONS
According to the proposal of demonstrating the application of a model to the performance development of an existing franchise segment in Brazil, it is possible to affirm that the results enabled the verification of the company’s growth towards direct and indirect competitors, as well as the detailed analysis of how each branch, in relation to the context, contributes positively or negatively to the segment result as a whole. Therefore, this work, in accordance with provisions in the proposal initially, contemplated the basic methodology and factors able to the meet initial demand of analysis the situation of the franchises within the context in which they are inserted.
As a key concern for the development of model, it became the reflection of the indicators to the reality found to the situation of each of the companies involved, from the perspective based on financial and non-financial issues, in order to serve as concrete standard and feasible to attend the interests of the model.
Thus, it was diagnosed as a limitation of the model the lack of contextualization of the indicators in relation to the deployment behavior at a specific demographic region and its regional quirks like geography, seasonality, culture and social relations, especially to potential consumers, because the model treat only the direct relationship existent between the franchisor and the franchisee, in order to consider these data type only in intrinsic way.
For further studies, it is hoped the development of measurement models based on other methodologies such as data envelopment analysis and multi-criteria schools to support decision-making, expanding the horizon of knowledge through this kind of verification.
REFERENCES
AAKER, D. A. (2004). Leveraging the corporate brand. California Management
Review, v. 46, n. 3, p. 6–18.
ABF (2012). Associação Brasileira de Franquias. Anuário de franquias. Guia oficial de marcas associadas, v. 14, p. 160-200.
CASTROGIOVANNI, G. J.; COMBS, J. G.; JUSTIS, R. T. (2006). Resource Scarcity and Agency Theory Predictions Concerning the Continued Use of Franchising in Multi-Outlet Networks. Journal of Small Business Management, v. 44, p. 27–44.
CORONA, C. (2009). Dynamic performance measurement with intangible assets. Review of Accounting Studies, v. 14, n. 2/3, pp. 314-348.
CRETELLA, J. (2003). Manual jurídico do franchising, 1 ed. São Paulo: Editora
Atlas.
DANT, R. P.; KAUFMANN, P. J. (2003). Structural and Strategic Dynamics in Franchising. Journal of Retailing, p.79, n. 2, p. 63-75.
GIL, A. C. (2010). Estudo de casos: Fundamentação científica, subsídios para
coleta e tratamento de dados. São Paulo: Atlas.
GRUNHAGEN, M.; MITTELSTAEDT, R. A. (2005). Entrepreneurs or investors: do
multi-unit franchisees have different philosophical orientations. Journal of Small
Business Management, v. 43, p. 207–225.
HAPONAVA, T.; AL-JIBOURI, S. (2009). Identifying key performance indicators for
use in control of pre project stage process in construction. International Journal of
Productivity and Performance Management, v. 58, p. 160–173.
KAPLAN, R. S.; NORTON, D. P. (2008). A Execução Premium. Rio de Janeiro:
Campus.
LACOMBE, F. J. M.; HEILBORN, G. L. J. (2003). Administração: princípios e
tendências. São Paulo: Saraiva.
LAFONTAINE, F.; SHAW, K. L. (2005). Targeting Managerial Control: Evidence from Franchising. RAND Journal of Economics, v. 36, n. 1, p. 131-150.
LAVIERI, C. A. (2008). Sistemas de avaliação de desempenho aplicados em
redes de franquias. Dissertation (Master in Production Engineering). São Paulo: USP.
MAURO, P. C. (2006). Guia do franqueador: como fazer sua empresa crescer
com o franchising, 9 Ed. São Paulo: Editora Nobel.
MEDEIROS, J. F.; RIBEIRO, J. L. D. (2013). Market success factors of sustainable
products. Independent Journal of Management & Production, v. 4, n. 1, p.
188-207.
NEELY, A. (2005). The evolution of performance measurement research:
developments in the last decade and a research agenda for the next. International
Journal of Operations & Production Management, v. 25, p. 1264-1277.
MINAYO, M.C.S. Pesquisa Social: teoria, método e criatividade. 29 ed.
Petrópolis: Vozes, 2010.
OLSON, E. M.; SLATER, S. F. (2002). The balanced scorecard, competitive strategy and performance. Business Horizons, v. 45, p. 11-17.
PARMENTER, D. (2010). Key Performance Indicators (KPI): Developing,
Implementing, and Using Winning KPIs, 2 ed. Wiley: Hoboken.
PAVLOV, A.; BOURNE, M. (2011). Explaining the effects of performance
measurement on performance: An organizational routines perspective. International
Journal of Operations & Production Management, v. 31, p. 101 – 122.
PERAZZA, L.; RODRIGUES, P. C. C. (2010). Analysis of performance evaluation
model through the balanced scorecard in a footwear industry. Independent Journal
of Management & Production, v. 1, n. 1, p. 24-36.
PERFORMANCEPOINT SERVER (2007). Microsoft Office. Redmond: Versão 1.0. PORTER, M.E. (2009). Competition. Rio de Janeiro: Elsevier.
RAUCH, A.; WILKLUND, J.; LUMPKIN, G. T.; FRESE, M. (2009). Entrepreneurial orientation and business performance: an assessment of past research and suggestions for the future. Entrepreneurship. Theory & Practice, v. 33, p. 761–787.
RODRÍGUEZ, N. G.; PÉREZ, M. J.; GUTIÉRREZ, J. A. T. (2005). Dependence as a moderator in the relationship between franchisors and franchisees: the case of services franchises. Journal of Marketing Channels, v. 13, p. 3–27.
ROTHAERMEL, F.T.; HITT, M.A.; JOBE, L.A. (2006) Balancing vertical integration and strategic outsourcing: effects on product portfolio, product success, and firm performance. Strategic Management Journal, v. 27, pp. 1933–1956.
SHANE, S.; MAW-DER, F. (1999). New Firm Survival: Institutional Explanations for New Franchisor Mortality. Management Science, v. 45, n. 2, p. 142-159.
SILVA, V. L. S.; AZEVEDO, P. F. (2012). Teoria e prática do franchising, 1 ed. São Paulo: Atlas.
VÁZQUEZ, L. (2005). Up-front Franchise Fees and Ongoing Variable Payments as Substitutes: An Agency Perspective. Review of Industrial Organization, v. 26, n. 4, p. 445-460.
WINDSPERGER, J.; DANT, R. (2006). Contractibility and Ownership Redirection in Franchising: A Property Rights View. Journal of Retailing, v. 82, p. 259 – 272.