A Knowledge-Based Cohesion Metric for Object-Oriented Software
CARA STEIN1 LETHA ETZKORN2 SAMPSON GHOLSTON3 PHILLIP FARRINGTON3 JULIE FORTUNE3 1 Edinboro University of PaDepartment of Mathematics and Computer Science 215 Meadville St., Edinboro, PA 16412 USA
2,3 University of Alabama in Huntsville
Huntsville, AL 35899
2
Computer Science Department [email protected]
3Industrial and Systems Engineering Management Department
(gholston, paf, fortunej)@ise.uah.edu
Abstract. This paper presents Percentage of Shared Ideas (PSI), a metric for measuring the semantic cohesion of a class in object-oriented software. PSI uses information in a knowledge base to quantify the cohesiveness of a class’s task in the problem domain, allowing a clearer view of cohesion than code syntax provides. Furthermore, this metric is independent of code structure and could be calculated before implementation, providing clues to design flaws earlier in the software development cycle, when changes are less expensive.
In this paper, we define the PSI metric, provide theoretical and empirical validation, and compare PSI to well-known cohesion metrics.
Keywords: object-oriented software, software metric, cohesion, semantic metric, knowledge-based systems
(Received January 27, 2006 / Accepted May 15, 2006)
1. Introduction
Metrics can help software developers and managers assess the quality of software and pinpoint trouble areas in their systems. For instance, a metric may indicate that a class lacks cohesion. A cohesive class is one in which all of the members are closely related, focused on a single task. A class that lacks cohesion is poorly designed, and therefore is more likely to be error-prone [24]. If metrics are used to quickly and automatically find out which classes in a software system lack cohesion, the programming team can take steps to check those classes and improve them before the software has
entered the integration and testing stages. Since changes are less expensive the earlier in the development lifecycle they are made [24], this can save the project considerable time and money.
Most software metrics are based on code syntax, quantifying the complexity or cohesion of an implementation by performing calculations based on counting code structures. In contrast, semantic metrics, introduced by [16], quantify the meaning within a
domain of the task being performed. To collect semantic
metrics, first a program understanding system [2][22][14] performs understanding; in that way the
operation of the software, or what the software does, is represented in a general knowledge-based format. In our semMet tool, a mature program understanding engine (the PATRicia system [12][13][14][15]) performs NL-based understanding on comments and identifiers, and thus provides a problem domain level understanding of the software.
The structure of the code itself is not considered for semantic metrics, so it is not necessary for a system to be implemented in order to calculate semantic metrics. To illustrate this point, consider the following code sample provided by [27]: if (balance < withdrawal) { bounce = true; } else { bounce = false; }
Compare that code sample with the following: bounce = (balance < withdrawal) ? true : false;
Traditional metrics such as lines of code produce different values for these two code samples, even though they do exactly the same thing. In contrast, semantic metrics would flag the concepts of balance, withdrawal, and bounce in the banking domain for both samples, regardless of the implementation details.
Semantic metrics are especially useful for measuring cohesion, which is hard to capture based on program syntax, according [3].
However, before we can use any metric, we must
make sure it is a valid measure of the attribute of interest. Many of the metrics that have been defined have never been adequately validated theoretically or empirically, making their use questionable. [17] found that many metrics are invalid or poorly defined. They suggested that any new metrics be valid and unambiguous. This paper addresses these points.
Others have also studied existing metrics and concluded that metrics must be valid and well defined, and too many existing metrics fail in at least one of these areas. [3] analyzed 13 cohesion metrics and 30 coupling metrics [4] from ten different sources. [3] found problems with all of these metrics except those proposed by [5]. These studies point to a clear need for valid, well-defined metrics.
This paper defines and analyzes PSI (percentage of shared ideas), a knowledge-based semantic cohesion metric. We validate PSI theoretically and empirically, and we compare its performance to six variations on a well-known cohesion metric, Chidamber and Kemerer’s LCOM [8][9].
2. Description of the PSI Metric
To avoid the distortions due to programmer style or programming language that may affect syntactic metrics, [16] proposed a suite of semantic metrics. We have created a tool called semMet to compute semantic metrics from the source code of software systems.
SemMet incorporates Etzkorn’s PATRicia (Program Analysis Tool for Reuse) system, a mature program understanding engine [12][13][14][15]. Program understanding approaches can be divided into three categories: algorithmic, transformational, and knowledge-based. From there, knowledge-based approaches can be divided into three categories: graph-parsing, heuristic, and using informal tokens. Informal token program understanding approaches include the DESIRE system, developed by [2] and the PATRicia system developed by [12][13]. The PATRicia system is a knowledge-based approach that incorporates a hybrid of heuristics and informal token use [14]. The PATRicia system (and semMet by extension) performs natural language processing on identifiers and comments from code in order to match these words with keywords and concepts in a knowledge base [12]. The PATRicia system program understanding engine was originally applied to identifying reusable components in object-oriented software [13]; the main purpose of semMet is to calculate semantic metrics to assess the quality of software from source code or design specifications.
SemMet currently consists of two parts: the source code interface and the main processing module. A design specification interface will also be added to facilitate the calculation of semantic metrics from design specifications. The source code interface performs the following steps:
• Retrieve the inheritance hierarchy and each class’s attribute variables and member functions.
• Extract all comments at both class and function levels.
• Use natural language processing to try to determine the part of speech for each identifier. For example, the function name “getBalance” would become get (verb) and balance (noun).
• Perform sentence-level natural language processing on comments to determine the part of speech of each word. This task can be accomplished with a high degree of accuracy because comments have their own sublanguage of the English language [12].
The main processing module performs the following steps:
• Process all words (from comments and identifiers of source code or from prose descriptions in design specifications) through a knowledge base of concepts and keywords of the domain of the system.
• Count concepts and keywords related to each class and each method of each class.
• Use class- and function-level concept and keyword information to calculate metrics.
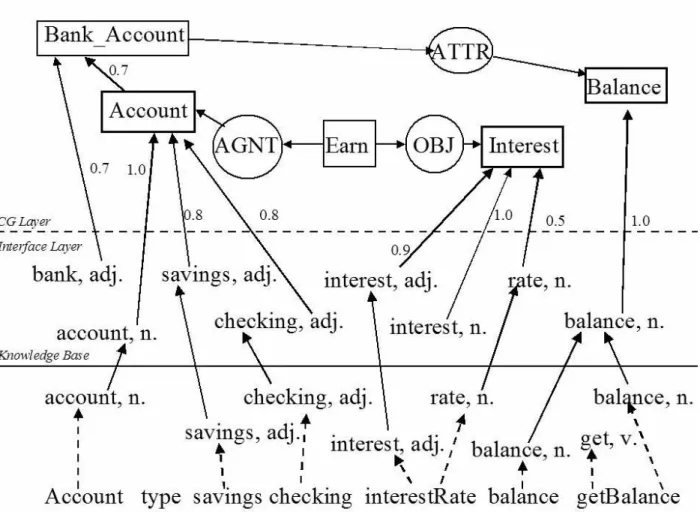
The knowledge base used by the semMet system uses the same structure as the knowledge base in the PATRicia system [12][14][15]. This structure consists of two layers: a layer of keywords tagged with part of speech information, and a layer of conceptual graphs [14][15]. Conceptual graphs are a knowledge representation format that can be used to show ideas and the relationships among them [26]. In semMet, conceptual graphs are used to represent the relationships among the ideas in the knowledge base. Conceptual graphs are made up of concepts, which represent entities, attributes, states, and events; and conceptual relations, which show how concepts are interconnected [26]. For instance, to show “the mouse moves the scrollbar, which is part of the window,” we might make a conceptual graph such as the one in Figure 1. This conceptual graph is read as follows: the scrollbar is part of a window, the state of the scrollbar is moving, and the agent of the scrollbar’s moving is the mouse.
Conceptual graphs make up one layer of the knowledge base of the semMet system. The other layer is an interface layer of weighted keywords, which have been tagged with parts of speech. Inference occurs from the interface layer to the conceptual graph layer, and further inference can occur between concepts in the conceptual graph layer.
To calculate semantic metrics using the semMet system, a knowledge base with this structure is created for the domain in which a piece of software is written. The words appearing in the identifiers and comments of a piece of code are compared to concepts and keywords in the knowledge base. Whenever a word from the code matches a keyword in the knowledge base, that keyword is associated with the class or member function. Furthermore, inference is performed from the keyword layer in the knowledge base to the conceptual graph layer. If a class or member function contains keywords which trigger a concept in the conceptual graph layer of the knowledge base, that concept is also associated with the class or member function. As in the PATRicia system, semMet’s knowledge base and inference engine are implemented in the CLIPS expert system shell [12]. Once the appropriate concepts and keywords from the knowledge base have been associated with each class
and member function, semantic metrics are calculated based on this information.
To illustrate this, consider the abbreviated bank account class definition given in Figure 2. In this example, the identifiers Account, balance, type, interestRate, and getBalance, as well as the comment associated with the class definition, are processed. First multiple-word identifiers such as “interestRate” are split into their component words. Each word is assigned a part of speech. For example, in this case “account” is a noun. Then, the words with their parts of speech are
compared against the part-of-speech-tagged keywords in the interface layer of the knowledge base. In this example, the following keywords are matched: account (noun), savings (adjective), checking (adjective), interest (adjective), rate (noun), and balance (noun). The keywords bank (adjective) and interest (noun) are not matched. All of the matched keywords are associated with the class Account. In addition, the keyword balance (noun) is associated with the function getBalance(), because that function’s name contained a match to the keyword.
class Account { private:
int type; // 0=savings, 1=checking float interestRate; float balance; public: float getBalance(); };
(
)
{
}
(
)
{
a ak}
aj ai aI
y
k
I
y
|
y
I
x
I
x
j
,
i
I
x
|
x
∈
∃
∧
∈
∈
∧
∈
∃
∧
∈
Then, inference occurs from the interface layer of keywords to the conceptual graph layer. In this case, the weighted links from the account (noun), savings (adjective), and checking (adjective) keywords meet the threshold of 1.0 for the Account concept to be matched. Also, the interest (adjective) and rate (noun) keywords meet the threshold for the Interest concept and the balance (noun) keyword meets the threshold for the Balance concept to be matched. Therefore, the Account, Interest, and Balance concepts are associated with the class Account. Similarly, the Balance concept is associated with the getBalance function, since its name matched the balance (noun) keyword, which met the threshold for the Balance concept. From there, further inferencing can occur within the conceptual graph layer. In this case, the link from the Account concept is fired, but it does not have enough weight to meet the threshold for the Bank_Account concept, so the Bank_Account concept is not matched.
The end result of this example is that the Account class is associated with the Account, Interest, and Balance concepts, and the account (noun), savings (adjective), checking (adjective), interest (adjective), rate (noun), and balance (noun) keywords. The getBalance() function is associated with the Balance concept and the balance (noun) keyword. This information is then used to calculate semantic metrics.
2.1 Mathematical Notation
In order to define metrics, we need to define some formal notation. Let C1, C2, …, Cm be the set of m classes in a system. Let Fa = Fa1, Fa2, …, Fan be the set of n member functions of class Ca. Let Aa = Aa1, Aa2, …,
Aap be the set of p attribute variables declared in class Ca (not including any that may be inherited by class Ca). Let Ka be defined as the set of keywords in the knowledge base associated with class Ca, and let Oa be the set of concepts in the knowledge base associated with class Ca.
Let
a =Ka ∪Oa be the set of ideas associated with class Ca. Let Ra be the set of conceptual relations connecting to or from any concept in class Ca.Similarly, let Kai be the set of keywords associated with function Fai, let Oai be the set of concepts associated with function Fai.
Let
Iai = Kai∪Oai be the set of ideas associated with function Fai, and let Rai be the set of conceptual relations associated with function Fai.Let # be a mapping from set Fa to set Aa such that Fai #
Aaj if function Fai uses attribute Aaj somewhere in its implementation. Let ? be a mapping from Fa to Fa such that Fak ? Fal if function Fak calls function Fal. Let O be the set of all concepts in the knowledge base. Then let % be a mapping from set Ra to set O such that r % i if i is a concept in Oa and conceptual relation r forms a connection from concept i to any concept j in set O or
from any concept k in set O to concept i.
2.2 Definition of PSI (Percentage of Shared Ideas) Although the semantic metrics proposed by [16] are not subject to distortions due to programming language or programmer style as traditional metrics are, they still have one obstacle: they require a knowledge base with a conceptual graph structure in order to be calculated. Not all knowledge bases have such a structure. Therefore, [27] proposed semantic metrics, including PSI, that can be calculated using any knowledge base that associates concepts or keywords with classes and their member functions, regardless of how the knowledge base is implemented.
PSI is the number of concepts or keywords shared by at least two member functions of a class, divided by the number of concepts or keywords belonging to any member function in the class. PSI for class Ca is defined as follows.
for 1 i, j, k |Fa|, or 0 if no ideas are associated with any function of the class [27].
For example, define class Ca to contain four member functions and a total of ten ideas (concepts or keywords from the knowledge base) associated with member functions to make up the following sets: Ia1 = {i3, i4, i5},
Ia2 = {i4, i5, i6}, Ia3 = {i1, i2}, and Ia4 = {i6, i7, i8, i9, i10}. In this example, ideas i4, i5, and i6 are common to at least two member functions; the others are not. Therefore, PSI for class Ca = 3/10 = 0.30.
2.3 Previous Syntactic Cohesion Metrics
One of the most commonly cited suites of metrics is that proposed by Chidamber and Kemerer [8] [9]. Since Chidamber and Kemerer proposed these metrics, many people have analyzed, criticized, and proposed their own versions of these metrics. We will compare the performance of PSI to six versions of LCOM (lack of
cohesion in methods), originally proposed by [8] [9]. Brief descriptions of these metrics are shown in Table 1.
Full mathematical definitions can be found elsewhere [28].
Definition Reference
LCOM LCOM = the set of pairs of member functions with no instance variable used by both members in the pair
[9] LCOM1 [13] added the constraint that a pair of member functions containing a member function
and itself should not be counted. Inherited instance variables are not counted.
[13] LCOM2 [8] specified a pair of member functions could not include the member function and
itself. Inherited instance variables do not count.
[8] LCOM3 An undirected graph has edges that are pairs of member functions with at least one
attribute variable in common. LCOM3 = number of connected components of the graph.
[23][19] LCOM4 A variation of LCOM in which there is an edge in the graph for each function that calls
another function in addition to the edges for functions that share attribute variables
[19] LCOM5 LCOM 5 is specified from the perspective of the number of functions accessing each
attribute
[13]
Table 1: Definitions of Various LCOM Metrics
3. Criteria for Evaluating Cohesion Metrics
Kitchenham, Pfleeger, and Fenton proposed a framework for evaluating software metrics [21]. In this framework, they described the structure of any measure as containing the entities being analyzed, such as classes or modules; the attribute being measured, such as size; the unit used, such as lines of code; and the data scale: nominal, ordinal, interval, or ratio. Units are valid only for interval or ratio data, but they can be adapted for use with ordinal data. In order for a value to have any meaning, the entity, the attribute being measured, and the units must be specified. The measure must be defined over a specified set of permissible values (discrete or continuous) [21].
In order to be valid, a measure must have:
• Attribute validity: the entity being analyzed has the attribute
• Unit validity: the unit is appropriate for the attribute • Instrumental validity: the underlying model is valid
and the instrument was calibrated
• Protocol validity: the protocol used for the measurement was valid and prevented errors such as double-counting [21].
Furthermore, in order to be theoretically valid, a direct measure must have the following properties: • The attribute has different values for different
entities.
• The measure works in a way that makes sense with respect to the attribute and its values for different entities
• Any of the attribute’s units can be used if the attribute is part of a valid measure.
• The attribute can have the same value for different entities [21].
For an indirect measure, the following properties apply:
• A model of relationships among entities’ attributes is the basis for the measure.
• No improper use of dimensionality occurs in the measure.
• No unexpected discontinuities occur in the measure.
• The units used are appropriate for the scale of data available [21].
Another set of criteria for assessing metrics was proposed by [36]. These criteria were proposed to apply specifically to complexity metrics, but some of them are more generally applicable. Of these, [21] rejected most but incorporated properties 1, 3, and 4 into their framework. These properties are:
1. There exist different entities with different values. 3. There exist different entities with the same value. 4. There exist entities that perform the same function in different ways and have different values [29].
[6] also proposed a set of criteria for metrics. Included in their criteria are some specific properties that cohesion metrics should have. These properties are:
• Non-negativity and normalization: the value falls in a defined range [0, max]
• Null value: the value is zero if there are no relations within a module
• Monotonicity: adding relations within a module never decreases the value
• Cohesive modules: the module created by merging two unrelated modules has a value less than or equal to the cohesion value of the more cohesive original module [6].
4. Theoretical Analysis of the Metrics
PSI is an indirect measurement based on the direct measurement of counting the concepts and keywords from the knowledge base that are associated with each class and member function. In the main processing module of the semMet tool, a report is generated that lists which ideas (concepts and keywords from the knowledge base) are associated with each class and function. From this report, the sets I1,I2, …, Im and Ia1,
Ia2, …, Ian are formed. The cardinality of each set is the quantification of the semantic mass of the corresponding class or member function [27].
To analyze PSI within the framework proposed by [21], we first define the entity being analyzed as a class; the attribute being measured as semantic mass; and the unit as the idea, defined as one concept or keyword in the knowledge base. The data scale is interval, because we can count ideas, but it does not make sense to talk about fractions of an idea. PSI meets Kitchenham, Pfleeger, and Fenton’s four properties for validity as follows:
• Attribute validity: since semantic mass describes how many ideas are associated with a class or function, clearly the entity class has the attribute semantic mass.
• Unit validity: idea is an appropriate unit for semantic mass.
• Instrumental validity: the instrument is valid as long as the knowledge base associates concepts and keywords with classes and members in a way that is representative of their purpose within the domain. • Protocol validity: the measurement as defined in the
formal notation given is unambiguous, consistent, and prevents double-counting [27].
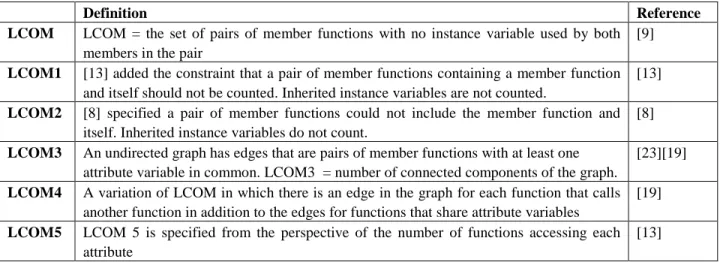
PSI also meets the non-negativity, normalization, null value, monotonicity, and cohesive Metric Kitchenham Framework Non-Negativity/
Normalization
Null Value Monotonicity Cohesive Modules PSI LCOM LCOM1 LCOM2 ? LCOM3 LCOM4 LCOM5 ?
Table 2: Summary of theoretical criteria fulfilled by each metric modules properties outlined by [6]. The value is always
at least zero and always falls within the range [0, 1]. The value is zero if there are no shared ideas within a class. Adding relations (that is, instances of members sharing ideas) never decreases the value. If two unrelated modules are merged, the value is at most the higher original PSI value [27].
Theoretical analysis has been performed on the LCOM metrics by [3]. This analysis is summarized in Table 2. PSI is included in this table for comparison purposes. It is unclear whether LCOM2 and LCOM5 meet the Kitchenham framework. LCOM2’s units are based on the same model as LCOM and LCOM1, which satisfy unit validity but fail on other counts; however,
LCOM2 involves subtracting pairs of modules with attributes in common. It is unclear whether this is an appropriate operation under the model. Similarly, LCOM5 has a unit of 1/attributes. This unit is not counted directly but by using a combination of other units. Therefore, the unit is only valid if this combination of units is based on a valid model.
5. Empirical Analysis
To perform our empirical analysis of PSI and the various versions of LCOM, we computed the metrics using the source code of a set of classes from two GUI systems written in C++, Gina [1] and wxWindows [25].
Then we compared the metric values to experts’ assessments of the software.
The experts rated the cohesion of each class on the following scale: 0 = Bad, 0.25 = Poor, 0.50 = Fair, 0.75 = Good, 1.00 = Excellent
To check the degree to which the experts gave consistent ratings of software cohesion, we computed inter-rater reliability for each team of experts. We used Gen++ [11] to calculate LCOM, HYSS [7] to calculate LCOM1, LCOM2, LCOM3, LCOM4, and LCOM5, and semMet to calculate PSI.
We performed statistical analysis to see how the metric values compared to the experts’ assessment of each class. We used the following hypotheses for the first two experiments.
H0: = 0 (There is no correlation between the metric
value and the team’s value.)
H1: ≠ 0 (There is a correlation between the metric
value and the team’s value.)
When two variables are independent, their correlation coefficient value is 0. A direct relationship between two variables is indicated by a positive value; an inverse relationship is indicated by a negative value. To understand the meanings of these values, Cohen [10] and Hopkins [20] proposed the following scale.
< .01 – trivial, .10 - .30 – minor, .30 - .50 – moderate, .50 - .70 – large, .70 - .90 - very large,
.90 - 1.0 - almost perfect 5.1 Experiment 1
For this experiment, we computed metrics on a set of 13 classes from the wxWindows system, a system written in C++ for cross-platform GUI development. It has been under development or in use for over twelve years [25]. These classes were selected to make a minimal windowing system.
Also, a team of experts from a graduate level software engineering course analyzed cohesion of the same 13 classes. Each expert had prior object-oriented programming experience, especially in C++. Most had at least a year of experience in software development. The experts’ ratings were averaged to get a team rating for each class. Group inter-rater reliability was 0.89, indicating a high degree of agreement among the experts.
From the scale proposed by [10] and [20], Table 2 shows PSI has a statistically significant very large correlation with the experts’ ratings. Except for LCOM, the other metrics had only a moderate or large correlation with the experts’ ratings, if any. At this level of significance, LCOM3, LCOM4, and LCOM5 did not have a significant correlation with expert ratings. The exact values are given in Table 3. We can see from these results that PSI is closer to these experts’ cohesion ratings than any of the LCOM metrics.
Metric Correlation p-value Statistically Significant ( = 0.05) PSI -0.7745 0.0019 LCOM -0.7257 0.0115 LCOM1 -0.5782 0.0385 LCOM2 -0.5557 0.0486 LCOM3 -0.4873 0.0912 LCOM4 -0.5371 0.0584 LCOM5 -0.4462 0.1962
Table 3: Metrics correlated with Expert Team 1 cohesion rating (Experiment 1)
5.2 Experiment 2
In this experiment, we computed the metrics from a set of 277 classes from the Gina [1] and wxWindows [25] systems and looked for correlation
LCOM LCOM1 LCOM2 LCOM3 LCOM4 LCOM5
LCOM1 NS LCOM2 NS 0.9964 LCOM3 NS 0.8997 0.9253 LCOM4 NS 0.8561 0.8849 0.9838 LCOM5 NS 0.4706 0.4868 0.5217 0.5436 PSI 0.6333 0.6507 0.5895 NS NS NS
between the metrics, using the following hypotheses: H0: = 0 (There is no correlation between the metric
values.)
H1: 0 (There is a correlation between the metric
values.)
We found a large correlation between PSI and each of LCOM, LCOM1, and LCOM2, but no significant correlation between PSI and any others. There was a very large correlation in each pairing of LCOM1, LCOM2, LCOM3, and LCOM4; LCOM5 had a moderate to large correlation with each of these. LCOM did not have a significant correlation with any metric except PSI. Complete results are in Table 4. We indicated pairs with no statistically significant correlation with the label “NS.”
6. Conclusion
We performed theoretical and empirical analysis on PSI and six variations of LCOM. We found PSI is empirically and theoretically valid, and that it matches well with experts’ views of cohesion, performing better than any version of LCOM. Furthermore, since PSI does not rely on the structure of code, it could be calculated in the design phase, yielding results before implementation. Thus software engineers should consider using PSI to assess the cohesion of object-oriented software.
7. Future Research
Future research includes extended empirical studies. Additionally, the next obvious expansion for this work is to create a tool to calculate semantic metrics from design specifications as well as from source code. We began to explore this issue, but it is a rich area for exploration. Although some syntactic metrics claim to be design metrics, most of them can be computed in an automated way only from source code. This is not the case with semantic metrics.
8. Acknowledgements
This research was partially supported by NASA grants NAG5-12725 and NCC8-200.
9. References
[1] Backer, A. Genau, M. Sohlenkamp, The generic interactive application for C++ and OSF/MOTIF,
version 2.0, (1991), Anonymous ftp at ftp.gmd.de, directory gmd/ginaplus.
[2] Biggerstaff, T. Mitbander, B, Webster, D.
Program understanding and the concept assignment problem, Communications of the ACM,
v. 37, no. 5, pp. 72-83, May 1994.
[3] Briand, L., Daly, J. Wust, J. A unified framework for cohesion measurement, Empirical Software Engineering, v. 3, no.1, pp. 65-115, 1998.
[4] Briand, L., Daly, J. Wust, J. A unified framework for coupling measurement in object-oriented systems, IEEE Transactions on Software Engineering, v. 25, n. 1, pp. 91-121, Jan./Feb.
1999
[5] Briand, L. Morasca, S., Basili, V. Defining and validating high-level design metrics, University of Maryland, Technical Report CS-TR 3301, 1994.
[6] Briand, L., Morasca, S., Basili, V., Property-based software engineering management, IEEE Transactions on Software Engineering, v. 22 no. 1,
pp. 68-86, Jan. 1996.
[7] Chae, H., Kwon, Y., Bae, D. A cohesion measure for object-oriented classes, Software: Practice and Experience, v. 30 , pp. 1405-1431, 2000.
[8] Chidamber, S., Kemerer, C. A metrics suite for object oriented design, IEEE Transactions on Software Engineering, v. 20, n. 6, pp. 476-493,
June 1994.
[9] Chidamber, S., Kemerer, C., Towards a metrics suite for object oriented design, Proceedings of the Conference on Object-Oriented Programming Systems, Languages, Applications, pp. 197-211,
1991.
[10] Cohen, J. Statistical Power Analysis for the Behavioral Sciences, 2nd ed. Lawrence Erlbaum Publishing Co, Mahwah, N.J., 1988.
[11] Devanbu, P. GENOA - A customizable, language- and front-end independent code analyzer, Proceedings of the International Conference on Software Engineering, pp. 307-317, 1992.
[12] Etzkorn, L., Bowen, L., Davis, C., An approach to program understanding by natural language understanding. Natural Language Engineering,
v. 5, no. 1, pp. 1-18, 1999.
[13] Etzkorn, L., Davis, C., Automated Object-Oriented Reusable Component Identification. Knowledge-Based Systems, v. 9, no. 8, pp. 517-524, Dec.
1996.
[14] Etzkorn, L., Davis, C. Automatically identifying reusable OO legacy code. IEEE Computer, v. 30,
[15] Etzkorn, L., Davis, C. A Documentation-related approach to object-oriented program understanding. Proceedings of IEEE 3rd Workshop on Program Comprehension, pp. 39-45,
1994.
[16] Etzkorn, L., Delugach, H., Towards a semantic metrics suite for object-oriented design, Proceedings of the 34th International Conference on Technology of Object-Oriented Languages and Systems, pp. 71-80, 2000.
[17] Harrison, R., Counsell, S., Nithi, R. An overview of object-oriented design metrics, Proceedings of the 8th IEEE International Workshop on Software Technology and Engineering Practice, pp.
230-235, 1997.
[18] Henderson-Sellers, B. Software Metrics. Prentice-Hall, Hemel Hempstaed, UK, 1996.
[19] Hitz, M., Montazeri, B. Measuring coupling and cohesion in object-oriented systems, Proceedings of the International Symposium on Applied Corporate Computing, 1995.
[20] Hopkins, W. A new view of statistics, http://www.sportsci.org/resource/stats (last accessed 4/5/06).
[21] Kitchenham, S. Pfleeger, S. Fenton, N. Towards a framework for software measurement validation, IEEE Transactions on Software Engineering,
v. 21, no. 12, pp. 929-944, Dec. 1995.
[22] Kozaczynski, W., Ning, J., Engberts, A., Program concept recognition and transformation, IEEEE Transactions on Software Engineering, v. 18,
no. 12, pp. 1065 – 1075, Dec. 1992.
[23] Li, W., Henry, S. Object-oriented metrics which predict maintainability, Journal of Systems and Software, v. 23, no. 2, pp. 111-122, 1993.
[24] Pressman, R. Software Engineering: A Practitioner’s Approach. McGraw-Hill, Boston,
2001.
[25] Smart, J. wxWindows, http://www.wxwindows.org/
(last accessed 4/5/06).
[26] Sowa, J. Conceptual Structures: Information Processing in Mind and Machine, Addison-Wesley, Reading, Mass, 1984.
[27] Stein, C. Etzkorn, L., Cox, G., Farrington, P., Gholston, S., Utley, D., Fortune, J. A new suite of metrics for object-oriented software, Proceedings of the 1st International Workshop on Software Audit and Metrics, Porto, Portugal, April 2004.
[28] Stein, C., Semantic Metrics for Source Code and Design, Doctoral Dissertation, University of Alabama in Huntsville, 2004.
[29] Weyuker, E. Evaluating software complexity measures, IEEE Transactions on Software Engineering, v. 14, no. 9, pp.1357-1365, Sept.

![Table 2: Summary of theoretical criteria fulfilled by each metric modules properties outlined by [6]](https://thumb-us.123doks.com/thumbv2/123dok_us/1836050.2765899/7.918.99.785.631.755/table-summary-theoretical-criteria-fulfilled-modules-properties-outlined.webp)
