FLOOD MAPPING AND FLOOD DAMAGE ESTIMATION USING GIS
By
Mohamad
Rezafahmi
Bin Mohd Saleh
Dissertation submitted in partial fulfillment of the requirements of the
Bachelor of Engineering (Hons) (Civil Engineering)
CERTIFICATION
OF APPROVAL
Flood Mapping and Flood Damage Estimation using GIS
by
Approved by:
Mohamad Rezafahmi Bin Mohd Saleh
A project dissertation submitted to the Civil Engineering Programme Universiti Teknologi PETRONAS in partial fulfillment of the requirement for the
BACHELOR OF ENGINEERING (Hons) (CIVIL ENGINEERING)
r
As Zc. Prof. Dr. Abdul Nasir Bin Matori Project Supervisor
UNIVERSITI TEKNOLOGI PETRONAS TRONOH, PERAK
CERTIFICATION
OF ORIGINALITY
This is to certify that I am responsible for the work submitted in this project, that the original work is my own except as specified in the references and acknowledgements, and that the original work contained herein have not been undertaken or done by unspecified sources or persons.
- lu/ý,
"
Flood mapping has been used widely in many countries nowadays as a method to encounter this natural hazard phenomenon. In the past few years, studies about the flood analysis and modeling used to take years. But now, with the facilitation of Geographical Information System (GIS) automated process, the studies are faster and even accurate in modeling the flood inundation area. The used of GIS is essential as a planning tool for floods, educating the populations at risk and managing floods as they actually rise. Features in the GIS itself such as the 3-D Visualization and detailed hydrological characteristic help a lot in defining areas which is vulnerable to flood. Generally, flood mapping can identify the effects of flooding and those effects are represented in hazard and risk mapping. The main advantage of using GIS for flood management is that it not only generates a visualization of flooding but also creates potential to further analyze this product to estimate probable damage due to flood. This paper is to demonstrate the use of GIS in constructing the flood map at studies area. The map then are derive into Digital Terrain Model (DTM) to make the identification in flood vulnerable areas easier which provide high detailed representation of the topographical variations in the Earth's surface.
ACKNOWLEDGEMENT
This project has taken about a year of planning and working processes in order to fulfill the requirements of Final Year Project subject. In a year duration, many peoples had being involved either directly or indirectly whose contribute in assorted ways to this project in order to make it a success. Thus, it is a pleasure for me to convey my heartfelt gratitude to them all in this humble acknowledgement.
In the first place, I would like to record my gratitude to Assoc. Prof. Dr. Abdul Nasir Bin Matori. He was not only served as my supervisor but also encouraged and challenged me throughout his constructive comments, critics and valuable suggestions. Besides, his full supports and advices had actually inspired me and develop my skills as a researcher and engineer to be.
It is also a pleasure to pay tribute to government body that had been given their full cooperation during the data gathering process which is Mr. Ismail bin Mat Noh, from Hydrology Department (JPS Perak Tengah), Mrs. Hanida from Engineering Department (JPS Seri Iskandar) and Mr. Muhammad Azian bin Radzali, from River Engineering Department (JPS Negeri Perak). Their crucial contribution is actually the backbone of my project.
Not to forgot, my parents and family members who have given a never-ending support in the quest to gain valuable knowledge and experience in this university throughout the completion of this project. They deserve a special mention for their inseparable supports and prayers.
Certainly on the list of peoples to be thank of are all friends from all around and also to those people that not be mentioned here. Your names may slip of my mind at this moment, but your actions and helps stay in my mind forever.
And last but not least, grateful gratitude to the almighty God that has made all things possible.
TABLE OF CONTENTS
CERTIFICATION OF APPROVAL ... i CERTIFICATION OF ORIGINALITY ... ii ABSTRACT ... iii ACKNOWLEDGEMENT ... iv TABLE OF CONTENTS ... v LIST OF FIGURES ... vii ... viii LIST OF TABLES ... ii CHAPTER 1 INTRODUCTION ... 1 1.1 Background of Study ... 1 1.2 Problem Statement ... 2 1.3 Objectives ... 3 1.4 Significance of Projects ... 3 1.5 Scope of Study ... 3CHAPTER 2 LITERATURE REVIEW ... 4
2.1 Natural Phenomenon ... 4
2.2 Flood Mapping ... 4
2.3 Understanding Geographical Data ... 6
2.3.1 Spatial Data ... 6 2.3.2 Tabular Data ... 6 2.3.3 Image Data ... 6
2.4 Digital Terrain Model ... 10
2.4.1 Elements of Digital Terrain Modeling ... 10
2.4.2 Data Points in DTM ... 11
2.5 Drainage Modelling ... 13
2.5.1 Surface Water Drainage and Watersheds ... 13
CHAPTER 3 METHODOLOGY ... 16 3.1 Project Research ... 18 3.2 Project Tools ... 18 3.3 Data Gathering ... 18
CHAPTER 4 RESULT AND DISCUSSION
... 21 4.1 Results
... 21
4.1.1 Identification of Flood Area ... 21
4.1.2 Comparison between Results and Existing Flood Data
... 28
4.1.3 Flood Estimation Damage
... 31
4.1.3.1 Road
... 31
4.1.3.2 Houses
... 33
CHAPTER 5 ECONOMIC BENEFITS
... 34 CHAPTER 6 CONCLUSION AND RECOMMENDATION
... 36 REFERENCES
... 3 7 APPENDICES
LIST OF FIGURES
Figure 1: Example of GIS themes ... 5
Figure 2: Satellite Image ... 7
Figure 3: Superimposition technique between 1973 and 1996 topographical map.... 9
Figure 4: Main tasks of DTM ... 11
Figure 5: Elevation data in the form of contours used by GIS for computing the DTM ... 12
Figure 6: Representation of stream networks as dendritic (left) or anabranching (right) ... 14
Figure 7: Primary work flow ... 16
Figure 8: Secondary work flow ... 17
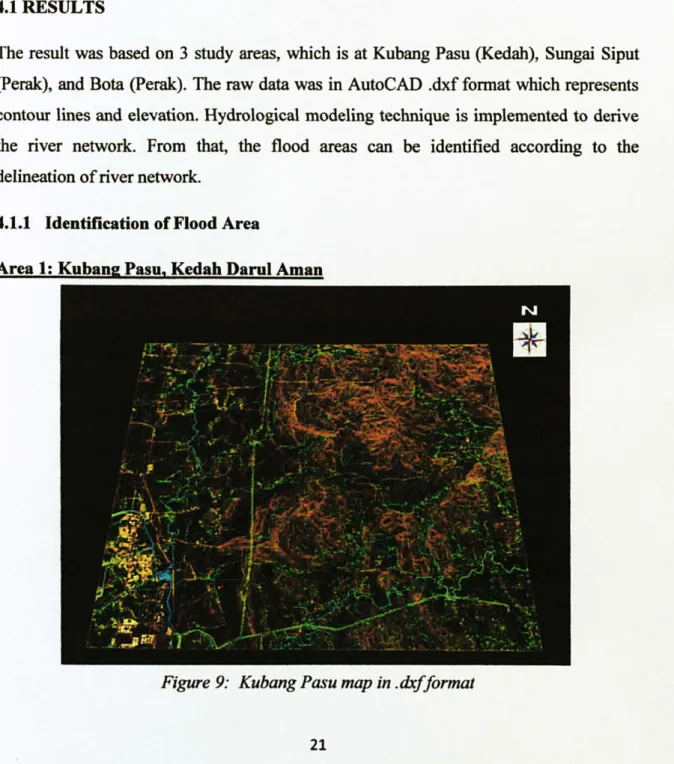
Figure 9: Kubang Pasu map in dxf format ... 21
Figure 10: Contour lines are transforms to DTM ... 22
Figure 11: River network overlay with Kubang Pasu map, blue shaded indicate the flood area ... 23
Figure 12: Bota map in dxf format ... 23
Figure 13: Contour lines are transforms to DTM ... 24
Figure 14: River network overlay with Bota map, blue shaded indicate the flood area ... 25
Figure 15: Sungai Siput map in dxf format ... 25
Figure 16: Contour lines are transforms to DTM ... 26
Figure 17: River network overlay with Sungai Siput contour map, blue shaded indicate the flood area ... 27
LIST OF TABLES
Table 1: Value of Properties ... 12
Table 2: Cost of Repairing Road ... 12
Table 3: House and Building Properties ... 12
Table 4: Table 4: Damage Rate with Flood Depth ... 20
Table 5: Villages marked as shown in Figure 11 ... 28
Table 6: Villages marked as shown in Figure 14 ... 29
Table 7: Villages marked as shown in Figure 17 ... 30
Table 8: Estimation Cost of Road Resurface in Kubang Pasu ... 31
Table 9: Estimation Cost of Road Resurface in Bota ... 32
Table 10: Estimation Cost of Road Resurface in Sungai Siput ... 32
CHAPTER 1
INTRODUCTION
1.1 BACKGROUND OF STUDY
Flood is known as one of the natural hazard phenomenon that affects many countries in the world. It is an evitable natural phenomenon where its happen anywhere and anytime in all rivers and natural drainage systems that not only damages the lives, natural resources and environmental but also causes major loss in economy and health.
Malaysian early settlements are historically known grew on the banks of the major rivers in the country like other major populations in the world. Together with natural factors such as heavy monsoon rainfall, intense convection rain storms, poor drainage and other local factors, floods have become a common element in the lives of a significant number of Malaysians.
Huge funds are needed in implementing the flood insulation project and restructured area that has been affected by floods. Many effort and initiative by government and local authorities in identifying the flood causes and vulnerable areas that is risky towards this natural phenomenon. Thus, there is a need to further studies about this topic where an effective plan could be generated at the end of the studies.
Geographical Information Systems (GIS) technology are used widely in many discipline because its multi functional purposes such as analyze spatial information, edit data, maps and present the results of all these operations. By using this GIS tools in flood mapping, an accurate prediction and details about the flood characteristic could be determine. Besides that, a proper plan can be prepared to reduce the risk and casualties during the floods such as identifying areas that need to be focused on when the floods occurs.
1.2 PROBLEM OF STATEMENT
As a consequence of seasonal floods occurring almost annually in one part of the country or another, flood losses in terms of loss of life and damage to properties are substantial. During the flood, low level areas are most vulnerable to flooding. For example, main river basins are the area which is fully congested with human settlement where most agriculture and other economics converge here since ancient times, and these areas are extremely vulnerable to natural disasters due to both geographical and meteorological conditions.
Unfortunately, the developments around these areas are still continued in recent years. Many developers did not realize that the risk and possibilities of flood to occurred in their area. Many houses and commercial areas were constructed to attracted more civilian without taking any identification about the surrounding geographical and meteorological. Then, when this natural hazard phenomenon comes, it will destroy anything that is around its parameter.
The annual cost that government need to spend for flood disaster preparedness, rescue and relief operations, and post-flood rehabilitation of victims and public utilities are substantial. Lack and ineffectiveness of flood evacuation plan also contributed to the increasing numbers of casualties and properties. Therefore, by doing this study a method in identifying floods using GIS mapping could be really helpful to the communities.
1.3 OBJECTIVES
Upon completing the project, a few objectives need to be achieved. The objectives of study are as follows:
1) To identify the areas that are vulnerable to flooding using GIS
2) To roughly estimate the damage
in the flooded area
1.4 SIGNIFICANCE OF PROJECTS
At the end of the research, the use of GIS technologies as a method of flood mapping in Malaysia could be implemented widely so that the casualties and losses during the floods phenomenon can be reduced. Besides that, others matter can be achieved such as:
1) Prevent any development in flood high-risk area
2) Prepare
better and more effective flood evacuation
plan
3) Focus on flood high-risk area by providing more facilities such as evacuation area
1.5 SCOPE OF STUDY
The scope of studies for FYP 1 is to get familiarize with GIS software and gathering all information regarding flood research which has been discovered by the previous people. In FYP 2, the work is more to finding the final results which is the flooded area in selected area.
The author has chosen few places in Malaysia which has flood occurrence history almost every year as the study areas. Each areas geographical and hydrological feature need to identify to ensure the research methodology can be done without any obstruction or constraints. The study area was chose at Kubang Pasu district in Kedah, Kampung Gajah and Sungai Siput, Perak. Then, the flood mapping process will go through those areas to identify the prone areas. As an addition to this study, the author added a rough estimation about the flood damage mainly to the residential and some facilities there.
CHAPTER 2
LITERATURE REVIEW
2.1 NATURAL PHENOMENON
Flooding can occurs along the rivers and when torrents hit an area continuously or in coastal areas of the sea which exposed with big waves during storm. Technically, flooding will most probably occurs in low level area especially at downstream. A lot of factors contribute to this natural phenomenon such as poor drainage system, ineffective water catchment area, dam breakage and tsunami effects. Therefore, it is importance to rectifying this problem and used the technologies that exist to let the human life much more comfort and better.
2.2 FLOOD MAPPING
Flood mapping has been used widely in many countries nowadays as a method to encounter this natural hazard phenomenon. Existing flood maps need to update because, in the nearly 20 years since the original studies were completed, additional information has become available about peak flows and floodplain elevations that would significantly change the flood estimates these maps display. On the other hand, complete re-studies using traditional methods are costly and time-consuming, so it is unlikely that the maps can be restructured quickly enough to meet demand.
Depending on the function, users have very exact demands on content, scale, precision or readability of the map. Flood maps are primarily used for flood risk management strategy (prevention, mitigation), land-use planning, land management, emergency planning, public awareness rising, and private sector, in particular insurance sector [1].
information for decision-making on issues not directly related to flooding, such as environmental planning or soil contamination after flood.
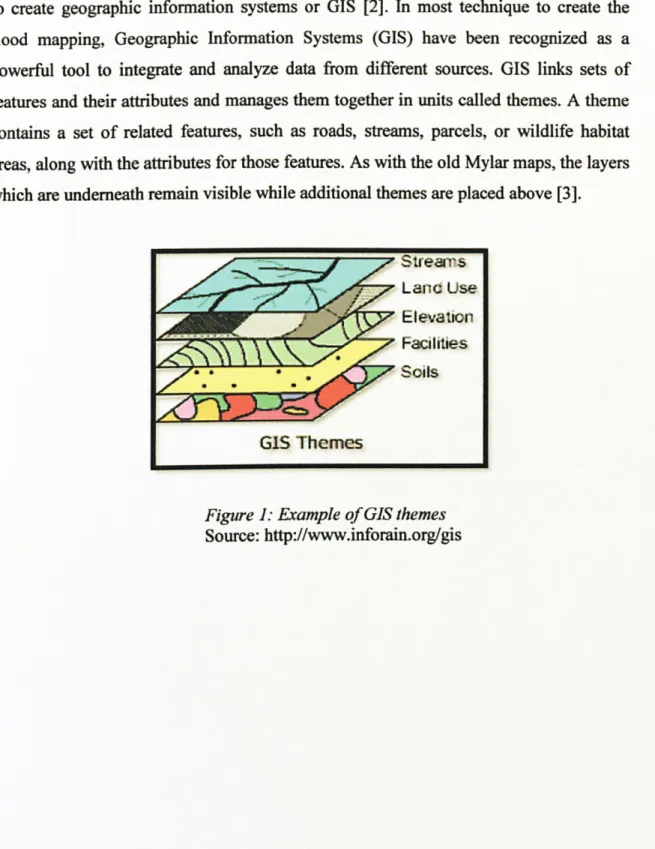
Maps have been used for thousands of years, but it is only within the last few decades that the technology has existed to combine maps with computer graphics and databases to create geographic information systems or GIS [2]. In most technique to create the flood mapping, Geographic Information Systems (GIS) have been recognized as a powerful tool to integrate and analyze data from different sources. GIS links sets of
features and their attributes and manages them together in units called themes. A theme contains a set of related features, such as roads, streams, parcels, or wildlife habitat areas, along with the attributes for those features. As with the old Mylar maps, the layers which are underneath remain visible while additional themes are placed above [3].
trears Lanc Use Elevation Facilities Soils
Figure 1: Example of GIS themes Source: http: //www. inforain. org/gis
23 UNDERSTANDING GEOGRAPHICAL DATA
Geographical data is the information about the earth surface and the objects on top of it such as rivers, forest, hills and etc. This information comes in three basic forms which is:
" Spatial Data " Tabular Data " Image Data
2.3.1 Spatial Data
Spatial data contains the locations and shape of map features and normally known as digital map data where the users need when to identified to make maps and study spatial relationship. For instance, spatial data is the points that represent such things as shopping centers, banks, and physician's offices, and lines that represent such things as street, highway, and rivers.
2.3.2 Tabular Data
Technically, tabular data is the descriptive data that GIS links to map features or in other words, adding the information to geography. It is collect and compile for specific areas like states, census tracks, cities and often comes packaged with the feature data. Some tabular data contains geographical locations, such as addresses, bird nest sites or places where flood have occurred. Then, from the locations, map features can be created, displayed and analyzed along with other spatial data.
23.3 Image Data
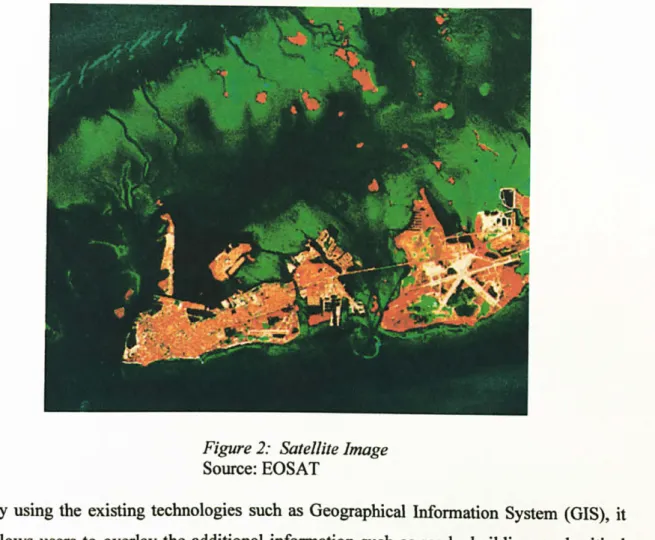
Image data is important to get an overview about the particular area that need to be investigated where it is include such diverse elements as satellite images, aerial photograph, and scanned data. Image of the earth taken from satellites or airplanes can be displayed as maps along with other spatial data containing map features.
Figure 2: Satellite Image Source: EOSAT
By using the existing technologies such as Geographical Information System (GIS), it allows users to overlay the additional information such as roads, buildings and critical facilities which allowing quick assessment of the potential impacts for a particular flood level. Then, GIS can used to map areas along the periphery of the inundated area where uncertainty in the flood or land elevations translates into uncertainty about the extent of inundation [4].
Generally, flood mapping can identify the effects of flooding and those effects are represented in hazard and risk mapping. However, for management purposes the cause of flooding are of very high importance. Early warning systems, warn and alarm schemes, clearance of channels etc. are fully based on the cause and development of flood event [1]. It is evident that GIS has a great role to play in natural hazard management because natural hazards are multi dimensional and the spatial component is inherent [5]. The main advantage of using GIS for flood management is that it not only generates a visualization of flooding but also creates potential to further analyze this product to estimate probable damage due to flood [6].
More recently, advances in computer and GIS technology have increased the accessibility and mobility of GIS tools, such that communities can use GIS to manage their local knowledge and community data collections using mobile GIS and Global
Positioning System (GPS) technologies [7]. As a consequence, GIS has now become a fundamental component of community-based methodologies [8].
For the studies of flood mapping using GIS, the author will identify the terrain and contour in low level area which is vulnerable to having flood. It is importance to know
the area information because there are many factors that contribute to flood. Then, the studies continue with the investigation in what level of water the flood will occur. Besides that, by referring the flood mapping, areas of flood occurred can be determined and predicted when it will happen. During the floods, some of existing flood evacuation plans is not fully comprehensive where only covers areas which had been previously affected by floods. Therefore, after identifying the areas that are highly vulnerable, a proper flood evacuation plans can be constructed without any areas effected left behind.
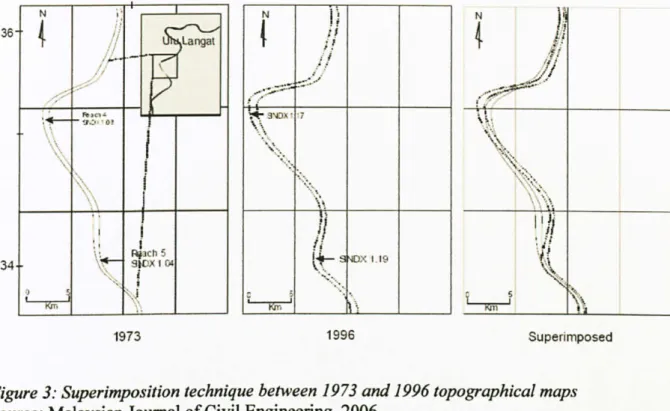
In order to have a further understanding about the role of GIS in flood management, the author has refers to some of the previous research in journal, books, articles and other relevance references. In Malaysia, there was a research regarding the floods which has changes the Sungai Langat channel. By comparing maps showing the conditions in year 1973 and 1996, they need to identify changes in alignment along the river. Then, by using the GIS, identification of reaches that have undergone changes and their relation to sinuosity indices was made. The results are useful to guide river restoration works and promote multiple benefits of biodiversity enhancement, cleaner water, and reduction of flood risk [9].
36 34 N Laangat Ric 43ch 9JUX I CA I ;j i 1973 N ý+
4
;:
r
34D.
ý., 7
-
iý
. ý . 1996 "ý",. '" 4 i Li x; J,, il ýs" ; ": ýti. 'ý ý:. S T ýýýI
,j
,
ý.;
ý
_± i SuperimposedFigure 3: Superimposition technique between 1973 and 1996 topographical maps Source: Malaysian Journal of Civil Engineering, 2006
GIS extrapolation analysis then were used to identify the changes in sinuosity index (SINDX) in the up-stream, mid-stream and down-stream reaches. Changes in channel plan form were detected by superimposing the maps of year 1973 and 1996 (Figure 2). This technique provides evident on how the channel sinuosity is modified in size and position as the results of lateral erosion and sediments movement [9].
In determining the flood areas, sometimes it is necessary to couple a complex GIS with a simplified one. Good examples of this situation take place from the collaboration between teams with different equipments or from the need to use a more sophisticated system when a simpler one proves to be insufficient [10]. GIS are commonly equipped with tools that are significant to the implementation of hydrologic and hydraulic models, like algorithms for the calculation of watershed contours, slope, Digital Terrain Models (DTM), network functions, and the capability to overlay images.
Studies about coupling GIS with hydrologic and hydraulic models started in 1975, when the Hydrologic Engineering Centre (HEC) worked on the integration of HEC-1 in a GIS
using a grid based method [10]. The result of this effort was HECSAM (Spatial Analysis Methodology). In this approach, GIS served simply as a database to feed the hydrologic model.
2.4 DIGITAL TERRAIN MODEL (DTM)
For the most part in generating the flood mapping, it is necessary to derive the Digital Terrain Model (DTM). DTM is basically a digital file providing highly detailed representation of the topographical variations in the Earth's surface and it can be used by combining other digital data such as maps or orthophotograph where a 3D image of land
surface can be produced.
The concept of creating digital models of the terrain is relatively recent and the term digital terrain model (DTM) is generally attributed to two American engineers at the Massachusetts Institute of Technology during the late 1950s [13]. The definition they coined then was: "DTM is simply a statistical representation of the continuous surface of the ground by a large number of selected points with known X, Y, Z coordinates in arbitrary coordinate fields" (Miller and LaFlamme, 1958). Specifically, their early work was concerned with the use if cross-sectional data to define the terrain. Since then, several other terms, such as digital elevation model (DEM), digital height model (DHM), digital ground model (DGM), and digital terrain elevation data (DTED) have been combined to describe this and other closely related process. Although in practice these terms are often presumed to be synonymous, in reality they often refer to distinct products (Petrie and Kennie, 1990).
2.4.1 Elements of Digital Terrain Modeling
The production and use of DTMs generally involves five discrete procedures or tasks. These are generation, manipulation, interpretation, visualization, and application as shown in Figure 2.1. Deriving products from a DTM should not be viewed as a one-way process, but rather as the result of various interrelated stages in modeling [15].
Applications
Visualization
:
1:
DTM Generation
Figure 4: Main tasks of DTM
2.4.2 Data models in DTM
Interpretation
During the process of acquiring terrain data, a relatively unordered set of data elements is captured. In order to construct a comprehensive and usable DTM, it is necessary to establish the topographical relations between the data elements as well as an interpolation model to approximate the surface behavior [13]. It is impossible to record every point, and consequently a sampling method must be used to extract representative points. These discrete points can then be used to build a surface model that approximates the actual surface [14]. There are three methods are commonly used to represent surfaces in digital form which is contour line, grids (lattice or elevation matrix), or triangulated irregular network (TIN) [15].
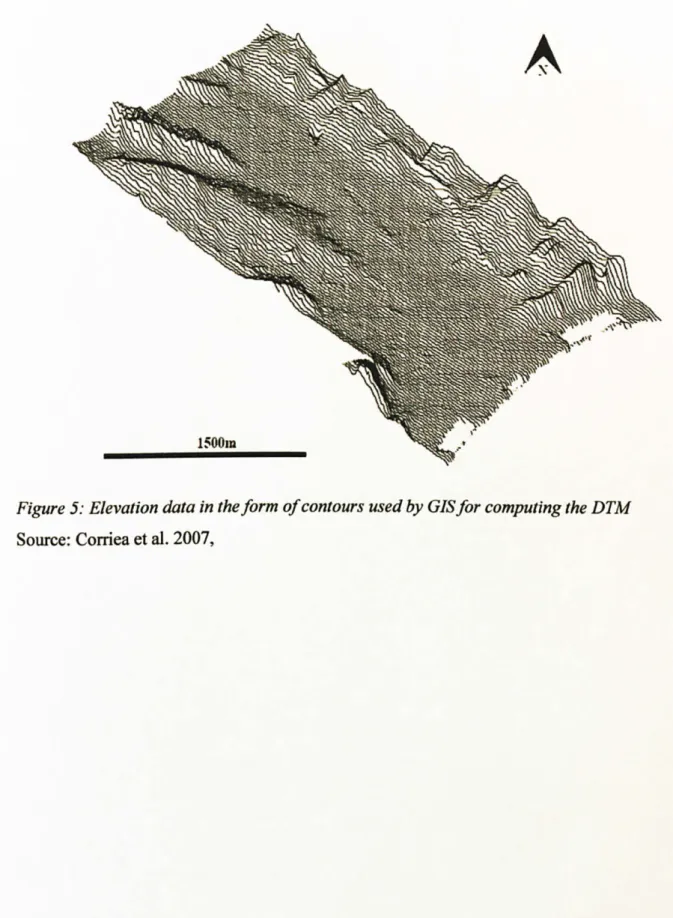
Contour or isolines of constant elevation at a specified interval are probably the most familiar representation of terrain surfaces. Contour accuracy depends upon whether the isolines have been generated from primary or derived data [13]. The contour lines are needed in GIS to prepare a DTM of an area. In order to get a DTM, contour lines must be digitized and allocated height values in the segment editor. Then, contour interpolation operation is used. A simple method to get a general view of the terrain is to apply the "Shadow filter" on the DTM with the "Filter operation" [11]. From the
DTM that been derived, the flow of the flood can be predicted and inundation area can
be identified.
Figure 5: Elevation data in the form of contours used by GIS for computing the DTM Source: Cornea et al. 2007,
2.5 DRAINAGE MODELING
Water resources engineering is a distinct branch of environmental modeling that deal primarily with water quality and quality management. Because of its importance to society, sustainable water resources engineering has evolved into its own discipline separate from traditional environmental engineering. Whether mitigating floods, assessing reservoir water supplies, or making decisions about wastewater treatment and disposal, water resources engineering is a large-scale activity that is impacted by terrain at all levels [10].
Hydrology is the science of the movement and distribution of the Earth's waters through all spheres of the Earth's system. To characterize and model the distribution of water level (whether in a river or as soil moisture in the ground) in a region is a fundamental requirement of water resources management [15]. Consequently, one of the most basic modeling units within hydrological modeling is the watershed [13]. Alternatively known as the catchment or basin, a watershed is defined as a control volume such that all water
entering the control volume drains to one specific point.
2.5.1 Surface Water Drainage and Watersheds
Water poured over a hard perfectly smooth surface will run off or drain by gravity in the direction of steepest descent (when disregarding inertial effects). Routes of steepest descent are called slopelines or flowlines, and these lines are perpendicular to contour lines (which are lines of constant elevation). The runoff process leads to the development of surface drainage networks, which result from the accumulation of flow from merging flowlines [16]. The location and nature of these drainage networks, or river networks, ultimately lead to the definition and delineation of a watershed.
Accurate hydrological modeling requires the accurate representation of a river network. According to El-Sheimy and Valeo (2005), river networks are often idealized as dendritic systems that look like trees, where a single branch (or flowline) flows into a larger branch, which flows downstream to yet another larger branch, which flows
downstream to yet another larger branch. This is indicated as in the illustration on the left in Figure 6.
1
Outlet
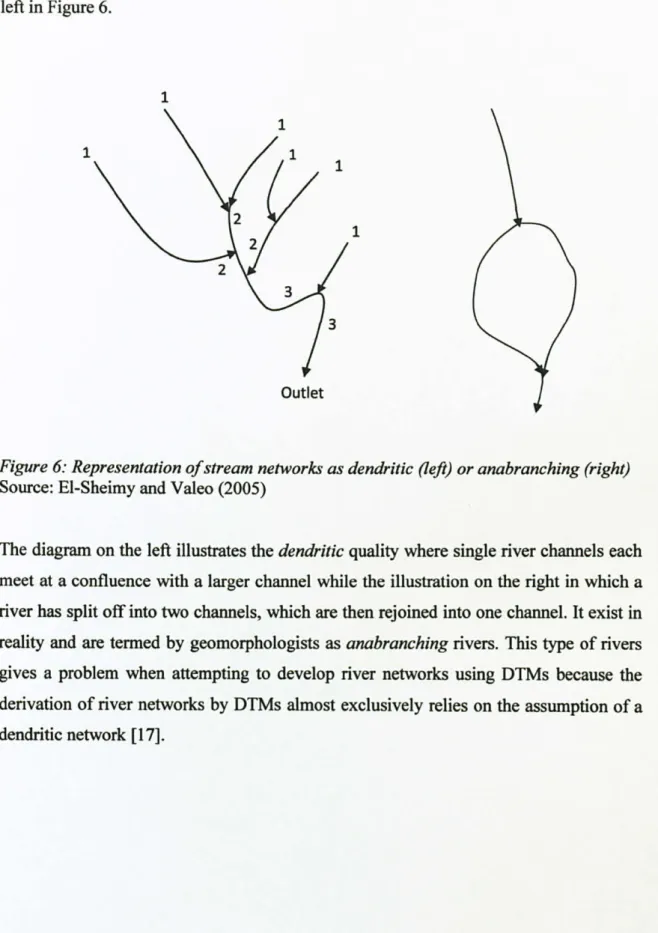
Figure 6: Representation of stream networks as dendritic (left) or anabranching (right) Source: EI-Sheimy and Valeo (2005)
The diagram on the left illustrates the dendritic quality where single river channels each meet at a confluence with a larger channel while the illustration on the right in which a river has split off into two channels, which are then rejoined into one channel. It exist in reality and are termed by geomorphologists as anabranching rivers. This type of rivers gives a problem when attempting to develop river networks using DTMs because the derivation of river networks by DTMs almost exclusively relies on the assumption of a dendritic network [17].
Horton (1932) and Strahler (1957) are considered pioneers in the quantification of river networks. A stream of lowest stream order 1 is a stream with no other tributaries (small rivers) draining into it. As streams converge at confluence points, streams of higher order are created. The stream order is assigned such that when two streams of the same order converge, then the order of the new stream is the old stream order number plus 1. Similarly, catchments are also assigned orders according to the Horton's law of basins, which implies that the drainage area of a catchment is directly proportional to the stream order of that catchment [ 16].
CHAPTER 3
METHODOLOGY
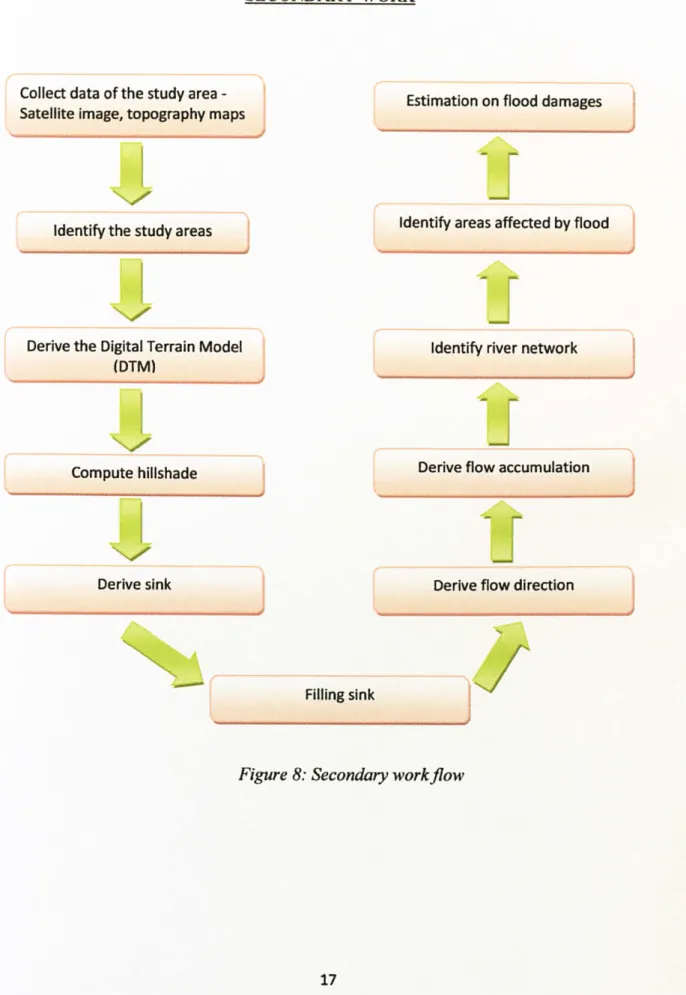
In order to achieve the objectives of the project, research and investigation about the flood mapping will be done. The work flow of the studies was divided into two which is Primary Work and Secondary Work. Primary work basically is the flow where the authors concentrate more on researching and studying of the project while Secondary work proceeds when all the data are available to achieve the final objective.
PRIMARY WORK
Research the previous project about flood mapping as references.
(Ex: journal, articles, thesis)
I
Discuss with Supervisor regarding the relevancies of the references for this project.
I
Take note any important technique and
SECONDARY WORK
Collect data of the study area -
Satellite image, topography maps Estimation on flood damages
"1
ý ýý
Identify the study areas
ý
--7
Derive the Digital Terrain Model identify river network
(DTM)
Compute hillshade
ý/
Identify areas affected by flood
Derive flow accumulation
Derive sink Derive flow direction
Filling sink
3.1 PROJECT RESEARCH
In this stage, it involved the literature research on the topic of the project and the related issues. Various source of information such as from journals, books and magazines need to consider during the research. The good understanding regarding the topic is really important to make sure the project will run smoothly.
3.2 PROJECT TOOLS
The author use ArcView GIS 3.2 as a tool to generate the flood mapping. ArcView is a useful software or desktop GIS and mapping. It is a product of Environmental Systems Research Institute, Inc. (ESRI). ArcView GIS is powerful software that provides for visualizing, querying, exploring, and analyzing data geographically. In other hand, ArcView is a powerful GIS tool that can display information, read spatial and tabular information from a variety of data formats, access external databases, produce thematic maps (use colors and symbols to represent features as well to represent features based on their attributes), perform spatial queries, connect spatial information to database attributes, provide several analytical tools, and allows for a high degree of customization using Avenue [12].
3.3 DATA GATHERING
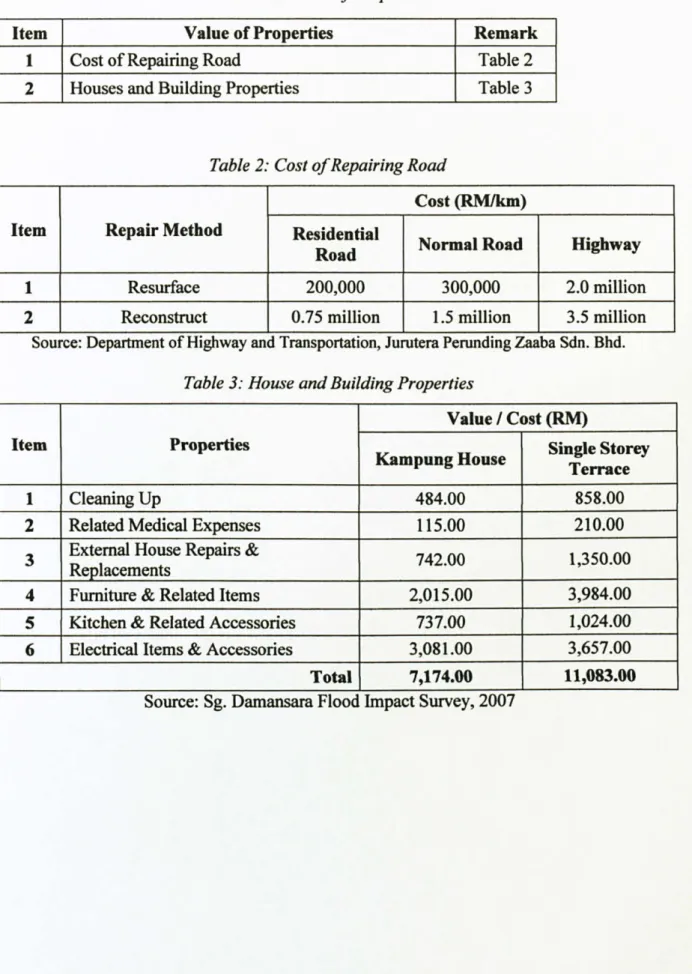
The elevation data for this research was given in AutoCAD (. dxf) format as 3D contour lines. The author has select Kampung Gajah and Sungai Siput, Perak and Kubang Pasu, Kedah as the study area where the previous flood occurrence record, topography map and satellite image are taken as a part of studies. As additional research for this study, an estimation of flood damages will be included in the result. The values of the properties are divided into 4 parts as table below.
Table 1: Value of Properties
Item Value of Properties Remark
1 Cost of Repairing Road Table 2
2 Houses and Building Properties Table 3
Table 2: Cost of Repairing Road
Cost (RM/km)
Item
Repair Method
Residential
Road Normal Road Highway
1
Resurface
200,000
300,000
2.0 million
2 Reconstruct 0.75 million 1.5 million 3.5 million
Source: Department of Highway and Transportation, Jurutera Perunding Zaaba Sdn. Bhd.
Value / Cost (RM)
Item Properties
Kampung House Single Storey Terrace
1
Cleaning Up
484.00
858.00
2
Related
Medical Expenses
115.00
210.00
3 External House Repairs &
Replacements 742.00 1,350.00
4
Furniture & Related Items
2,015.00
3,984.00
5
Kitchen & Related
Accessories
737.00
1,024.00
6 Electrical Items & Accessories 3,081.00 3,657.00
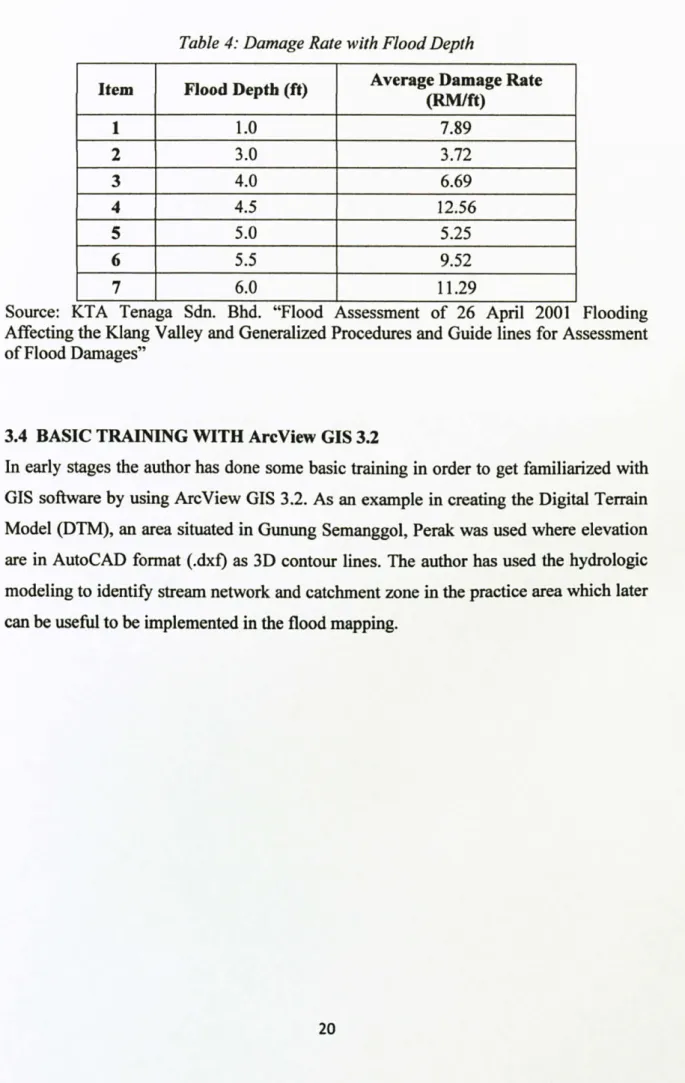
Table 4: Damage Rate with Flood Depth
Item Flood Depth (ft) Average Damage Rate (RM/ft)
1
1.0
7.89
2
3.0
3.72
3
4.0
6.69
4 4.5 12.565
5.0
5.25
6
5.5
9.52
7
6.0
11.29
Source: KTA Tenaga Sdn. Bhd. "Flood Assessment of 26 April 2001 Flooding Affecting the Klang Valley and Generalized Procedures and Guide lines for Assessment of Flood Damages"
3.4 BASIC TRAINING WITH ArcView GIS 3.2
In early stages the author has done some basic training in order to get familiarized with GIS software by using ArcView GIS 3.2. As an example in creating the Digital Terrain Model (DTM), an area situated in Gunung Semanggol, Perak was used where elevation are in AutoCAD format (. dxf) as 3D contour lines. The author has used the hydrologic modeling to identify stream network and catchment zone in the practice area which later can be useful to be implemented in the flood mapping.
CHAPTER 4
RESULTS AND DISCUSSIONS
4.1 RESULTS
The result was based on 3 study areas, which is at Kubang Pasu (Kedah), Sungai Siput (Perak), and Bota (Perak). The raw data was in AutoCAD dxf format which represents contour lines and elevation. Hydrological modeling technique is implemented to derive the river network. From that, the flood areas can be identified according to the delineation of river network.
4.1.1 Identification of Flood Area
Area 1: Kubang Pasu, Kedah Darul Aman
From the Figure 9, it shows a part of Kubang Pasu district locate at Kedah Darul Aman. The area contains roughly about 41 percent of residential area where most of it concentrate at the south east of the map which in Jitra city. At the north east, most of the area is used for agricultural activities, mainly for palm plantation and paddy field. There are 2 main river that can identified from the map indicated by the blue line, Sungai Bata that across the Jitra city and Sungai Padang Terap at the south west of the map.
Figure 11: River network overlay with Kubang Pasu map, blue shaded indicate the flood area
(Refer Appendix 6 for KI - KS)
Area 2: Bota, Perak Darul RidzuanFigure 12: Bota map in. dxf format
From the Figure 12, it shows a part of Bota, Perak Darul Ridzuan. In the middle of the map, there is a river known as Sungai Perak. Roughly, about 36 percent of residential area was identified in this area mostly village type while 26 percent of the area contains agricultural part that concentrated on east of the map.
Figure 14: River network overlay with Bota map, blue shaded indicate the flood area (Refer Appendix 6 for BI- B5)
Area 3: Sungai Sinut. Perak Darul Ridzuan
Figure 15 shows Sungai Siput map that located at the north part of Perak Darul Ridzuan. The north side of this map are the hill land with the highest peak >1000 metres. Most of the residential area are concentrated along the Sungai Pelus with most of the house are village type.
Figure 17: River network overlaid with Sungai Sipul contour map, blue shaded indicate the flood area
(Refer Appendix 6 for Si- S3)
As shown in the Figure 9, Figure 12, and Figure 15, the selected area data is in the AutoCAD format (. dxf) which then being transformed to Digital Terrain Modeling (DTM). Then, fill function works to derive depression less DTM. In order to derive hydrologic characteristic about a surface, the direction flow from every cell in the raster need to be determine.
According to Figure 11, Figure 14, and Figure 17, the flooded area can be derived by overlaid the delineation of river network with the contour lines. River network color are changing from light to dark which means the light color line is the source of water from hill side and the more darker line is moving to the lower land. The blue shaded indicate the possibilities of flood occurred in that area.
4.1.2 Comparison between Results and Existing Flood Data Area 1: Kubang Pasu, Kedah Darul Aman
As shown in Figure 9, there are four areas that being identified to have high possibilities for flood to occur. The results of this study are then compared to the actual flood occurrence history in the area to determine area that is exactly flooded. Refer to Figure 9, the blue shaded area that been marked with K, represent villages as state below:
Table 5: Villages marked as shown in Figure I1
Mark Area Name
K1 Kampung Bukit
K2 Kampung Bendang
K3 Kampung Bata
K4 Kampung Lahar
K5 Kampung Kerkap
From the results, all the villages have successfully proved as flood prone areas. From 2002 until 2009, there was several flood occurrences happen at those areas according to the pictures and newspaper article at APPENDIX 1. During the flood, two of the main river which is Sungai Bata and Sungai Padang Terap has overflow, thus caused flooding to the residential area along the river. In November 15,2009, Sungai Bata has recorded water level at 9.33 meter (alert level 9.16 meter), which is above the danger level.
Area 2: Bota, Perak Darul Ridzuan
As shown in Figure 14, there are two areas that being identified to have high possibilities for flood to occur. The blue shaded area that been marked by B, represent villages as stated below:
Table 6: Villages marked as shown in Figure 14
Mark Area Name
BI
Kampung Merua
B2
Kampung Bukit Chupak
B3
Kampung Bendang Bidara
B4
Kampung Parit 6
B5 Kampung Pant 1
Refer to the results, all the villages in the blue shaded have successfully proved as flood prone areas according to the Peta Banjir Daerah Perak Tengah from Drainage and Irrigation Department of Malaysia (JPS) Perak Tengah. On 2008, about 53 villagers from Kampung Pant 6, Mukim Layang-Layang has been transferred to the nearby relief centres. In the shaded area mark by number 2, most of the areas are used for agricultural activities. Those farmers who cultivate oil palm and fruit orchards have been facing difficulties in carrying out their agricultural activities because there are gardens or orchards, flooded with water. The articles and pictures regarding flood in Bota, Perak
Area 3: Sunp-ai Siput, Perak Darul Ridzuan
Figure 17 shows two areas that being identified to have high possibilities for flood to occur. The blue shaded area that been marked by S represents of several villages as stated below:
Table 7: Villages marked as shown in Figure 17
Mark
Area Name
Si Kampung Pulau Kemiri
S2 Kampung Melintang
S3 Kampung Mentimun
Refer to the results, all the villages in the blue shaded are proved as flood prone area. In December 29,2009, about 30 houses from five villages were almost flooded due to heavy rain which causes Sungai Perlus to overflow. Roughly, about 100 houses along the Sungai Perlus have been affected badly by flood. The flood that has recently occurred in the last 10 years has destroyed some of the oil palm and rubber plantations and interrupts the only road network to Sungai Siput town from their respective village. The photos and articles about flood in Sungai Siput are shown in APPENDIX 3.
4.1.3 Flood Estimation Damage
A rough estimation regarding flood damages have been done to the areas affected. The values of properties are taken from Table 1 that contains of houses and building properties, and cost of repairing road.
4.1.3.1 Road
In certain area, road has been affected badly due to the flood such as erosion on the road pavement, road being taken away by the strong river current and many others minor problems. It will take a huge financial amount in order to resurface and reconstruct the road.
Area 1: Kubang Pasu, Kedah Darul Aman
Table 8: Estimation Cost of Road Resurface in Kubang Pasu Village Name Length of Road
Affected Cost of Losses (RM/km) Losses (RM)
Kam un Bukit
0.45 km
200 000
90 000
Kam un Bendang
0.42 km
200 000
84 000
Kam un Bata
0.22 km
200 000
44 000
Kampung Lahar
0.30 km
200 000
60000
Kamp
un Kerkap
0.84 km
200 000
168 000
TOTAL
446 000
Area 2: Bota, Perak Darul Ridzuan
Table 9: Estimation Cost of Road Resurface in Bota Village Name Length of Road Affected Cost of Losses (RM/km) Losses (RM)
Kampung Merua
0.26 km
200 000
52 000
Kampung Bukit Chupak 0.16 km 200 000 32 000
Kampung Bendang Bidara
0.16 km
200 000
32 000
Kampung Parit 6
0.26 km
200 000
52 000
Kampung Parit 1
0.39 km
200 000
78 000
TOTAL
246 000
Area 3: Sungai Siput, Perak Darul Ridzuan
Table 10: Estimation Cost of Road Resurface in Sungai Siput Village Name Length of Road Affected Cost of Losses (RM) Losses (RM)
Kampung Pulau Kemiri 0.77 km 200 000 154 000
Kampung Mentimun 0.17 km 200 000 34 000
Kampung Melintang
0.52 km
200 000
104 000
TOTAL
292 000
Table 8,9 and 10 is the analysis of the rough estimation of the flood damage that effected road in all the three areas which is in Kubang Pasu, Bota and Sungai Siput. The author considers that, the flood is not much to make the road to be reconstructed. Value of resurface from Table 2 of this report was taken as the factor value of losses. The highest total loss for road damages is in Kubang Pasu, Kedah. All the length of road affected was roughly calculated using Ruler mode in Google Earth (See Appendix 5)
4.1.3.2 Houses
For cost estimation on the number of house damages, the author has made a rough number of houses affected according to satellite photo. It is because since there reference data about the numbers of latest houses in those areas.
Table II: Estimation Cost of House Affected
Area Houses Affected Value of Losses Total Losses (RM)
Kubang Pasu
258
7174.00
1,850,892.00
Bota
182
7174.00
1,305,668.00
Sungai Siput
134
7174.00
961,316.00
TOTAL 4,117,876.00
The author was make an assumption that, the value of single storey house will be the same as value of kampong house since there was no reference data of losses of a single storey house. The value above shows that the highest losses and damages are experienced by the most developed area which has more numbers of houses or high population area.
CHAPTER 5
ECONOMIC BENEFITS
Water resources planning and analysis used to take years but now with the facilitation of GIS automated process, it has trimmed down to just a task of few days. The concept of water resources planning has changes from only planning to prediction, effective management and quick response system through effective use of GIS and computer based modeling.
GIS application to hydraulic modeling is universal, effective, economical and less time consuming technique for river system analysis. Inadequate planning of water resources cause loss of life and damage to properties every year and leave tens of thousands homeless. As the people in the developing countries, we can utilize these tools and save money, time and can efficiently and timely model our water resource system at the tips of our finger.
GIS are in widespread use by both public and private organizations. Any more organizations would like to implement the technology, but they must first justify this major purchase. The most commonly used technique to justify any capital investment in is cost benefit analysis. Traditional cost-benefit analysis begins with an organization's identifying, listing, valuing, and summing the tangible costs associated with purchasing and implementing a GIS.
Tangible costs for GIS begin with the hardware needed for the operation, including computers, servers, and extensive data storage capacity to accommodate the vast
global positioning systems (GPS) devices, and perhaps even digital recording devices (such as a camera, for example). Once the organization has determined what hardware it needs, it may work with vendors to agree on prices. GIS software is another key part of the implementation.
Just as important to the analysis are the estimated tangible benefits of implementing GIS. There are three major categories of tangible benefits that a cost benefit analysis for GIS should include: cost reduction, cost avoidance, and increased revenue from sale of data; however, there may be legal limitations on data sales, and any organization that wishes to sell data is advised to seek a legal opinion before proceeding. Like costs, many benefits of GIS implementation are tangible where it is relatively easy to identify their economic value.
Some costs and benefits will be intangible and therefore difficult to assess. Among intangible costs are temporary disruptions of service within the organization caused by the changeover to GIS, uncertainty and hardship caused to staff members by the adoption of new technology, and other potential organizational dislocations created by the implementation of GIS. Intangible benefits may include better decisions which are
more readily accepted by stakeholders and client groups, for example. At the very least, it is important to identify any estimated intangible costs and benefits. If these intangibles are organizational disruptions, as described above, it is important both to identify them
and to suggest strategies to mitigate their effects.
Engineers dealing with the water in one way or the other must be up to date with the demand of the hour and should step forward to learn and apply new techniques to serve our province best by making use of the GIS application to water resources projects. It is the slogan of the time, demanding engineers in the developing countries to play their vital role in efficient water resources planning, management, and prediction in developing.
CHAPTER 6
CONCLUSION AND RECOMMENDATIONS
5.1 CONCLUSION
In conclusion, based on data and findings presented in previous chapters, it can be concluded that the used of GIS in identifying area that is vulnerable to flooding has been proved. Besides that, by using GIS, it can reduce time and a numbers of man powers in identifying flood prone area manually. The technique that has been practice can be developing more to gain much more accurate in identifying various types of places. Furthermore, in order to reduce the risk of life and properties losses, the local authorities must ensures there is no development occurred in those that is highlight as flood high risk area. Then, from safety measures that we consider, it should prevent any life losses and money to being waste just like that.
5.2 RECOMMENDATIONS
The use of GIS application in flood mapping especially in Malaysia is still in the early stage. It is because there are not enough people capable in handling such this application which are quite new. GIS give a very wide application not just for flood mapping use, but it is also can be use in various types of analyzing task. The results of this study are mainly dependent on the data of an area and also the accuracy of flood maps that generated by hydraulic and hydrology simulation software. In the future, the use of GIS in flood mapping can be improved by determining the technique to identify which level of water can give a flood impact to area nearby. Besides that, in order to estimate the flood damages, the latest information regarding the area of studies must be collected to
REFERENCES
[1] Flood Mapping in Europe Good Practice Handbook, EXCIMAP (2007) [2] What is GIS, htta: //www. inforain. org/about/about gis. html
131 GIS for Beginner, http: //www. mapcruzin. com/what gis. htm
[4] Joseph L. Jones, Tana L. Haluska, Alex K. Williamson, and Martha L. Erwin (1998). Updating Flood Inundation Maps Efficiently: Building on Existing Hydraulic Information and Modem Elevation Data with a GIS, US. Geological Survey Open-File Report 98-2003
[5]Coppock, J. T. (1995). GIS and natural hazards: an overview from a GIS perspective. In: Carrara, A. and Guzzetti, F., Editors, 1995. Geographical Information Systems in Assessing Natural Hazards vol. 6, Kluwer Academic, Netherlands, pp. 21-34.
161 Hausmann and Weber, 1988. P. Hausmann and M. Weber, Possible Contributions of Hydroinformatics to Risk Analysis in Insurance. Proceedings of the Second International Conference on Hydroinfoomatics, Zürich, Switzerland, 9-13 September, Balkema, Rotterdam (1988), pp. 57-62
[7] Phong Tran, Rajib Shaw, Guillaume Chantry and John Norton (2008) GIS and Local Knowledge in Disaster Management: A Case Study of Flood Risk Mapping in Viet Nam, Disasters 152-169
181 Hatfield (2006) Using Participatory Methodologies, Geographic Information Systems and Earth Observation Data to Map Traditional Ecological Knowledge in Hong Ha Commune, Thua Thien Hue, Viet Nam. EOSTEM Project Milestone 9 Report. Hatfield Consultants, West Vancouver.
191
Mohd Ekhwan Toriman, Zulkifli Yusop, Mazlin Mokhtar, and Hafizan Juahir, 2006, '
APPLICATION OF GIS FOR DETECTING CHANGES OF SUNGAI LANGAT
CHANNEL', Malaysian Journal of Civil Engineering 18(l): 59-70 (2006)
1101 Francisco Nunes Cornea, Maria de Graca, Flood Plain Management in Urban Developing Areas, GIS Base Flood Analysis and Urban Growth Modelling, Water Resources Management, Vol 13. pp 23-37 (1999).
III] F. Forte, R. 0. Strobl, and L. Pennetta, 2005, `A methodology using GIS, aerial photos and remote sensing for loss estimation and flood vulnerability analysis in the Supersano-Ruffano-Nociglia Graben, Southern Italy', Environ Geol (2006) 50: 581-594
112] Introduction to ArcView GIS, http: //people. morrisville. edu/--shavvaw/ArcView
(13J Miller, C., and LaFamme, R. A., "The digital terrain modeling-theory and applications, " Photogrammetric Engineering, 24(3): 433-442,1958.
1141 Peucker, T., Fowler, R., Little, J., and Mark, D., "The triangulated irregular network, " Proceedings of the Digital Terrain Models Symposium, St. Louis, MO, 1978 1151 Moore, I. D., Grayson, R. B., and Ladson, A. R., "Digital terrain modeling: a review of hydrological and geomorphological, and ecological applications, " Hydrological Processes 5: 3-30,1991)
1161 Horton, R. E., "Drainage basin characteristics, " Transactions American Geophysical Union, 13: 350-361,1932.
[17] Naser ES, Catrina V., Ayman H., "Digital Terrain Modelling", Acquisition, Manipulation and Applications, 2005
APPENDIX 1
The Star Online, 15th November 2009
More families evacuated as
flood situation worsens in
Kedah
ALOR SETAR: Kedah continues to move families to temporary relief shelters as floods damage more houses.
Some 200 victims were ordered to move to the Sekolah Kebangsaan Malau centre yesterday, bringing the total number of evacuees to 679. A spokesman from the state flood operations room said the five centres in Kubang Pasu district housed 516 victims.
In Padang Terap, the number of evacuees at the two centres remained unchanged at 54. The situation in Kota Setar district remained
unchanged with 109 victims still staying in the two relief centres.
Meanwhile, the water level at several rivers in the Kubang Pasu and Kota Setar districts were still above the danger mark, such as Sungai Bata recorded at 9.33m (alert level 9.16m), Sungai Kongluang 13.2m (13.2m) and Sungai Pantai Johor at 2.16m (alert level 2m).
In the Padang Terap district, Sungai Kuala Nerang recorded a reading of 16.65m (17.1m) and Sungai Kampung Kubu was at 12.61m (12.8m). In Kuala Terengganu, folks were advised not to play in floodwaters as a precaution against contracting cholera following 11 confirmed cases since the outbreak a week ago.
State health director Dr Nordiyanah Hassan said most of the 97 people warded at the Sultanah Nur Zahirah Hospital are expected to be discharged from today.
One person was discharged yesterday after testing negative for the disease. Another died of the disease on Tuesday. - Bemama
Kosmo, 23ird
October 2006
Kedah, Perlis sambut Aidi! fitri dalam banjir
ALOR STAR - Kemeriahan menyantbut Ai- diltitri di Kedah dan Perli+ tergtmggu apnbiL"r Ieherapa knwaaan di dui buah negeri itu dilanda banjir brrrmula kolmarin.
Bagairnauapun, rsehitzgg"a nudum tadi tidak
ada kemalang: rn jiwa hPrlaku akihat han, )ir
ter+ebat.
Jabartan I; rrk)ddnudan K: tji CuaKU pula ttw"" ramalkan I*. rntari liarat terutamanya Kedah, Perlis cLm Pulau Pinang akan brrhari raya dalam :; uavma hujan lehat don herkemung- kinan banjir.
Kerua Penolang IYngarah Puraat Ramalan CW9ra.
. Iahatan Ih"rkhidmnran Kaji ('uarn.
Wurtg Teck Kiung brrkatu, hujan herteruntut dan kadang kada Iehat itu mula melanda Ix, lvnrpa negeri di tiemenan)unºt : rejak 13 Ok-
udx"r dan dljangka Iwlarutan r"hing), m awal
bulan depan.
'la merup: rkaur fr"nunrena perahhan nwn>sun harat daya ke mormm timur Imn; ' katnny^r.
Di Kedah. lehih I. OIX) orang penduduk daa- r"ah I'Nnrianyt. Kulr: rng F: rut (fan [Nokok Sena
rerjc jn. + renrk akihat kaw"a. vrn rtw"rrka dilanda
hatljir u"juk tuulum kcdnurritt.
1)i Ih"ndang, kira-kira I: r both kamlwng
d, naiki air dl unl: rra 0.5 dan 1.5 meter yang menyehahkan lelw"ralm penduduk terpukHa dipindaldcln ke rumah . +awdara"rnara dan ra- kan-rakan yang herdekntan.
Ahli Uh-wan Undangan NrgR ri (ADUN) ka. w"wwn Sung{u Tiang, Surnym liraccdl berkalu, : intarý. r knwveum yang dilanda hnnjir ialah
I'lekan Kubur Pcrtijang, Kuhang Pisang, I. ubuk Batu, Lahar Tunjung dun Ilendutyt Rcrjn.
"Nnngrut"mangw itu dipindnhknn ke rumah keluargu nxreka yang kxrdekatun dan tiuda pu. at pemindahan yang dituhuhkan . etakat ini, " katanya.
KENDERAAN torpaksa mangharungi banJlr solpas air molimpadºI Jalan Pokok Sons di Kedah semalam.
dinaiki air ternuuuk Jal: kn Tobiar-Kubur Pan- jana bt"rhampiran Kubarrg Pinang ditutup un- tuk : elmrang kt"nderuan rin{, atn.
1)i 1'ttkok Sena, kira-kira 6() bah rumah dinaiki air dan antara kaw"a`m yang terlilmt laialt Kucnpung lit"ndung Baru, Kampun); Cu. lau, l. uh: tr I)alam, li"rrnatanu Limau, Alor Cina dan Lubuk Kt"rianK
ßeberapu penduduk jup terpakta dipin-
Ketua Nmuda UMNO Bahagian Yukok Se- na. I lari. ('he Mat berkatn, beliau dan ahli"nhli bahuXian memantau perkembaty,, an butljir di r; ekltar daerah kecll hu di aampinK tutun
ttenyampaikan wmbarytan an ltayu.
Di Kuhunx i'uwu, mangsa hat>jir darf 1'_' buah
kampunu di daeruh itu pindahkarº ke dun pueat pemindahan barijir Apjak malam kelmarin.
Srbanyak 276 marWw elaripada BA keluarRa
Kebangsaan Kudiattg, mum" VS unuigsa
daripttda ": 7 ki"lunrrga di deu"an orang ramai Kamputtg I. tthar dekat . ini.
Alenteri ße: vtr Krd: ih, Dtttuk Seri Nfith(Wr Khalid yang ditemui w"m tra nwlawat mangsa i, atajir di pusat pemindahan Kampung Lsthar deknt sini petan); ? em-lam metnintn monQ-m cx"ncatw ttlwn itu t. apaya Itanyak ht"rtrah: tr dan
taltah menlchudupi duJtautt. up"r1Wti di wit
amat Islam st"dan)( memhuat lwrrutpmt akhir nxnyttmbut ketilutan Aidilfilri.
13tq, roimanapun, ditJauun tnendalmti, parww
air di ("lutný; lun mulai lKtlih l>, "gitu juýa parr:
air di kawtwtn I : ulanK Terap mulai +urut. St"mt"ntarn itu di Kanlrar. w"banyak 12 mang- ! ia lxuýu" daripadu Up kcluargu di Kampung . lelentpuk di"kat rini di1tirnlaltkan kt Ueean t Orang 16mai Jelempttk M"riktnan hanjir yang melattdu kuwusan itu wjuk mumm kt"Imorin-
lienubng Pelmwai ()perasi Jubatun Ibrta- hatutn Awam I. IPA: i), Sury'an Syt"d \arri tiycd Ilassan berkuta, -eiakut pukul 1.: it) petang w malam, air lwr: ttla pada lwras 0.5 nwter dan mula mtngnhr kelunr kt kawa. +an hutan Kan- dis
dis dun. t"ml>rtdnn KiKlianK-Jelempnk. "Ifuat mrsa itti, kita bunt pt"r. ediaan di dea"an nrang ramai . IPlempok Ini dan kemunil- kirwn bikutgan kt"lurrga akin ]x"rtamhnh ka- lau hujan leimt mueih btrteruan dulum tem-
rh yang ttgnk panjanu, " ktuanya keliktt di-
ungi dl einl.
Ityjan Ieh; u yang berlaku dl utara Penis terutama di kttwtLwatt lodang ttbu ('huping w j: tk til, t httri lalu dikntakan menjadi punca btu11ir ilu.
Jahatan Kebajikpn Masyarukat telah menß- httntAr brknlnn yang hentpa barangan kt" perluan aeperti kain , itlimut, tikar dun juga makanan krpada mangta rrhinKKu bagjir pulih
Photos of the Flooded Areas
Paddy field flooded with water in Kampung Bukit
{.
ý
Iýýýr
Iý, t .! ýý. ý; ". -.ýa''; 'f t.. iA ý`". ic. ý tý_ #. _, 7t_ L :. ' «". r, , ý m'., ý ý ýýý 1. ... - ºýý ý `ý: ý' . -f; fýý'ýi ., .r /: ' r rr. '`... - ý!...
Paddy field flooded with water in Kampung Lahar
__ .. ýlN .
A house near Sungai Bata was flooded
_r
APPENDIX 2
Map of Flood Areas in Perak Tengah District
PETA KaIiASSAN B: A-NJIR DI DAERAIi PERAK TE_\ G AH
ati _. _ , L, rts3s L6La 3LIU . . a-. 1h ti A4L* %a, = QI-Nn_. a _. _ _ .l.. L
S'cF.. 22 Jm
Location of Hydrology Station in Perak Tengah
ýiý a : u. "1 t_:: 1 9'l"1 .a3. a: a 'XI_ .... i:. a = .. ý. r -EN i =- -J-S-= K. 46: ? ON G Gi A3 "il. 'ý: t I I r / 1 i
I. EDL'DUICA\ STESE. X HIDROLOGI
PEtZ. üK TE. \G. VIi
N ý -J / s I iý-- I 1ILZiL Ji et Ur ý , ý_ ý a / I-- . ýZý J I/ -' II ý 1t y`r-~
1!
7/I -1ý //" ý % I. "-i
lý
`-1-
-u
.ý-, 1 / / ýI
ý I ... _-_ ý. . T-. ý.,.,:., _ soft- \ rtuu º": " r+.:: x: V. uý -1 'ý\ ý. \\ D / ry Owý: ` ... .. iw uCipt aLIC. u i I 11Li31i , i-r i 1TTta ; I _ ý. L- -- i ýý ý'- ... f ý.,... ý,../I-%
ýC'='"'" 0 ----m c: Y. r cw D 1F1i1H IS'i, =.... iQl--. K ý ]iC1ZSS +: Z&P tv. t"_ar D tiA, E rn g cMLaKCourtesy image from Drainage and Irrigation Department of Malaysia (JPS) Perak Tengah
Photos of the Flooded Areas
A house flooded by water in Kampung Parit 6
..
APPENDIX 3
BERNAMA, 1" December 2008
Banjir DI Terengganu Semakin Pulih
ie i -- <--- --. ý-
x-ýs. ý_- " -- --- 'u _-- Tr'°" _ _L. 1C s _-°i_s ,. _-. s. . r-ý `__ _ a-ý "- ar"s' .__ . _. _ý 'r .. -
<r. s-"'1_s I. J.. >T-"9L s" .: 's"'y "9s"-, _s'J " Ys"
-e^I^: s". s.. : .. __ T.. r.. ýýs.. _ : ý... s.. ... s'... .. . _.. is.. .. is"ý.. ý... is ý "ý.. ý ,
-u s"z s_ . . ! ti2" 3! "1' tie, _ _e ý2: 2 x ! J- ""I, -. .. _"1-:! " _ eýe " l: 1- _-°i -Y . _'.. 1 L'_ - r"_. ,j1,.
3e a_ er, ss [_""I s ýs ," Cs^j -_ Caev^ 4s s" : ýs ,s e_"u" ics..
ý: e", _s^ _ýs- _cs: . -ýs, . _, _ _ a, " "",; s ., ts; "- __ .. °s, ^rs
.... ýý"a1' ý .... _ ... 'd's"" s" S_ ', s Ms's-,
_ -f"'aý]d" ße3, .. f_S (: d"dý
as. a_s s :_ 1ý"" i-ýr: e"^ýs^a. s. t +_-e x: __<: -it_--ý
^ir^.. 4: 4: I:. 1: ^Ir: - s: _ ""Ueecs> : a"ss. "ss'rs.
1.1 r-la a Vl. -e. 2, ^_a a" la s- le-: "--- 3e-:. la a" =r^,. a ý"" 9rv', a^.: _ a_ <r"r^üa. la a" - "'ýa T c^ v-=' _. la a..
_- la a- -^. ^u _-_- `xý1a"
s , r"a'a - "-'; vvr
a e_a a^ý a^: av ý 9! ^tr: r" I.! -ie: r".
J!! ' <_!. 1 Te"r^ýý. f"... "<_! ý Sr".! 'y 1-, 4 -... aCýlý3 x^I_! fe^: -"ss^ ar"s"'s °ý_! a"Tr-is! "_ua. asa 1_"_ualG : _.
J t., A\TA`.. j---i e °ýa" , -.: :. rj -_ e- " s *-:; -a a", 1-5
:Z_ _a", s.
1_"_. ý. st 3. ýr_"a. r Ii_ ela:: a: -. s<c"": ^Ir"Fa'"a^y te". a: a
se"ru -. -"s"', 3.
_^ýa: a"- _ _at:. e^ý°__ _ Se. ca^ <ea^yeaa".
Bs: _ <s. _ . Te r c^ -ita. a a IS a; ^u^. yj Cr. s_s r""ýý:: ,e _r, a
-a
c"a^, "s-"w ý, e:.
ý [: ýT.: &L"", `. -... 1_""ir "-u^.;,. ij"1 "_ [raa^ ýie". ""yaa: . r;: a_i
1. '_11 ý.; -- , _: r .. 1. - ri.: -i. . -u : _..
se^I.. -I.
1_"_s, aý =_: a: <aaJ rr"aý 9e^. _a'j Ba^I " <! r: J' te", J: J >e"J^ýJ Sit ý a'y :ria:, r
_. _ýr: `i^". a^r _a 1 =Js 4a>. Ta'J" 4r"a^
. -_, _"d^yi. <_dd <"J . ý=1 ý"a^yi" lr . -, ý"a^ýi GJ^ <.:: J ýa^s"_ : "; J : 'J. _. ý
IJ J^ ZJ": J- ^J'J3^y"J^y "IJ 3. fYý 'IJ>ý _. _. ýý . ^: Jý_ ti_ ý_ ts". ^jJ^. aJ: J'rJ "e: aJ : .... ^^y _ >".
$e s_ te". ss : a"a> a"=. rLr; --sr e- : a"s> : s°s. a ^u"s"sýs : _)_" f; s ,a_: s ýs _ [e f Cr :es, _ als a f: : e"Is; s-Ie; e.
) .. 'Al ..: rSl=.. T. =r"aý. x"a""la
_. c"a^ý . rca. a :.. ý.. ^ ,r
. a^ <a^i. _
. e^i tr" ýs^ýý. "'ý ^ir"ra . a^:. a 9a^J " ^Is ! ^I : __ . l.. "^-iit ß. : ev.! ' 3.1! -_ a .. _. _r". 1s. ^le"eý1 .^:! 'a1' : 1ý1 ^^ý_ 11.: _ -113^I : i_ x: rs' ^ ".! " ý! ý!! "'1 ... ^le: r' 1" ý!: '^f! ^ sr': 1 "'1: 1"1' !' ýi' ý.. ^ý! =r".,, a"
N! '! a ." Ci°ýi^
_ ýefli" L: '3"4 'i^It ti^I ""ý dfiý. 9! ^y'd* fL^I'-i
-'i' %_^YCd^14:
(! x-1_3 ' ^_ý]`; a! ^"1]" ;: l: 3'.. j" ' I.. .. a- ýJ JFJ: w"J"' . J^ J".. L. "LJL L ... 3Jý
Cinalslam. net, 27`h November 2008
27 november 2008
Menteri Besar Perak prihatin dengan
mangsa banjir- di Sunqai Siput.
4.4s
SUNGAI SIPUT, 27 Nov :- Mangsa banjir dibeberapa kawasan petempatan di Daerah Sungai Siput mendapat perhatian serius dari YAB Menteri Besar Perak apabila beliau menghantar wakilnya untuk meninjau dan memberi sedikit bantuan kepada 28 keluarga mangsa yang terlibat.
"Saya sampaikan salam dari YAB Menteri Besar dengan lafaz 'assalamualaikum' kepada semua mangsa yang terlibat, YAB Menteri Besar walaupun pada petang tadi berada di Pusat Ternak Sungai Siput merasmikan AgroFest namun beliau terpaksa bergegas balik ke Ipoh menghadiri program yang diatur terlebih dahulu, clan beliau memohon maaf kerana tidak dapat bersama dengan tuan-tuan pada malam ini ' demikian antara ucapan Pengerusi Kelab Penyokong Kerajaan Perak, Drs. Khalil Idham Lim yang mewakili YAB Menteri Besar semasa menemui 15 keluarga mangsa yang dari PPRT Lintang yang ditempatkan di Pusat Perpindahan Kg. Tok Siraj.
ý, NNW W"
E
Drs. Khalil menyampaikan Bantuan Kerajaan Negeri kepada mangsa di Kg. Tok Siraj.
Dalam ucapannya juga beliau menyatakan keperihatinan kerajaan negeri kepada mangsa banjir tersebut dan memohon semua mangsa bersabar dengan ujian tersebut,
Photos of the Flooded Areas
Other villagers helping their neighbors escaped from flooded house using sampan in Kampung Trosor, Sungai Siput
APPENDIX 4
APPENDIX 5
Area 1: Kubany- Pasu, Kedah
Kampung Bukit (0.45 km)
Area 2: Bota. Perak Darul Ridzuan