to Visualize Phylogenetic Trees
, Adam Arvelakis1,2, Martin Reczko1, Alexandros Stamatakis1,Alkiviadis Symeonidis1,2, and Ioannis G. Tollis1,2
1 Foundation for Research and Technology-Hellas, Institute of Computer Science
P.O. Box 1385, Heraklion, Crete, GR-71110 Greece
2 Department of Computer Science, University of Crete
University of Crete, P.O. Box 2208, Heraklion, Crete, Greece
Abstract. Over recent years the field of phylogenetics has witnessed significant algorithmic and technical progress. A new class of efficient phylogeny programs allows for computation of large evolutionary trees comprising 500–1.000 organisms within a couple of hours on a single CPU under elaborate optimization criteria. However, it is difficult to extract the valuable information contained in those large trees without appropri-ate visualization tools. As potential solution we propose the application of treemaps to visualize large phylogenies (evolutionary trees) and im-prove knowledge-retrieval. In addition, we propose a hybrid tree/treemap representation which provides a detailed view of subtrees via treemaps while maintaining a contextual view of the entire topology at the same time. Moreover, we demonstrate how it can be deployed to visualize an evolutionary tree comprising 2.415 mammals. The respective software package is available on-line at www.ics.forth.gr/˜stamatak.
1
Introduction
Phylogenetic (evolutionary) trees are used to represent the evolutionary history of a set of n organisms which are often also called taxa within this context. Usually, a multiple alignment of a—in a biological context—suitable small region of their DNA or protein sequences can be used as input for the computation of phylogenetic trees. Other computational approaches to phylogenetics also use gene order data [28].
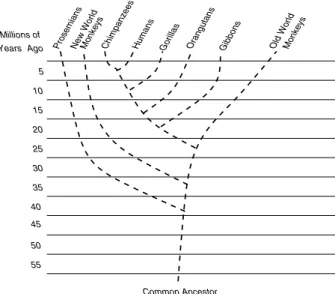
In a computational context phylogenetic trees are usually strictly bifurcat-ing (binary) unrooted trees. The organisms of the alignment are located at the tips (leaves) of such a tree whereas the inner nodes represent extinct common ancestors. The branches of the tree represent the time which was required for the mutation of one species into another—new—one. An example for the evolu-tionary tree of the monkeys and the homo sapiens is provided in Figure1.
Part of this work is funded by a Postdoc-fellowship granted by the German Academic
Exchange Service (DAAD)
This work was supported in part by INFOBIOMED code: IST-2002-507585 and
the Greek General Secretariat for Research and Technology under Program “ARIS-TEIA”, Code 1308/B1/3.3.1/317/12.04.2002
J.L. Oliveira et al. (Eds.): ISBMDA 2005, LNBI 3745, pp. 283–293, 2005. c
45 40 35 30 25 20 15 10 Common Ancestor Humans Monkeys Chimpanzees Millions of
Years Ago ProsemiansNew World Gorillas Orangutans Gibbons Old WorldMonkeys
50 55 5
Fig. 1. Phylogenetic tree representing the evolutionary relationship between monkeys and the homo sapiens
The inference of phylogenies with computational methods has many impor-tant applications in medical and biological research, such as e.g. drug discovery and conservation biology. A paper by Baderet al[1] addresses potential indus-trial applications of evolutionary tree inference and contains numerous useful references to important biological results obtained by phylogenetic analysis.
Due to the rapid growth of available sequence data over the last years and the constant improvement of multiple alignment methods it has now become feasible to compute very large trees for datasets which comprise more than 500– 1.000 organisms. The computation of the tree-of-life containing representatives of all living beings on earth is considered to be one of the grand challengesin Bioinformatics.
Unfortunately, phylogenetic inference under elaborate criteria such as Maxi-mum Parsimony [10] (MP) or Maximum Likelihood [9] (ML) is an NP-complete1 problem [7] [4]. However, the field has witnessed significant algorithmic progress over the last 2–3 years. Novel phylogeny programs and methods such as PHYML [11], MetaPigA [15], RAxML [25], [23], [26], or Rec-I-DCM3 [19] allow for infer-ence of large evolutionary trees of up to 1.000 taxa with MP or ML within less than 24 hours on a single CPU. The largest ML-based tree computed to date with the parallel version of RAxML contains 10.000 taxa [24] and the largest MP-based phylogeny with Rec-I-DCM3 comprises more than 13.000 organisms [19]. Despite the algorithmic advances in the field only few adequate visualization tools are available for the analysis of such large trees. Thus, the design of novel
1 Note that, this has not yet been demonstrated for ML due to the high mathematical
tree viewing tools is crucial [22] in order to accelerate the analysis process as well as to extract useful information from the data and expedite the cognitive process. In this paper we describe the deployment of treemaps for visualization of phylogenies and present the respective software tool. Furthermore, we show how it can be used to visualize a phylogeny of 2415 mammalian mitochondrial DNA sequences which has been computed with RAxML.
The remainder of this paper is organized as follows: In Section2 we survey the most common phylogenetic tree display tools and describe the basic con-cepts of treemaps. Thereafter, we describe the implementation, algorithms, and basic features of the visualization tool (Section3). The advantages of displaying phylogenies with treemaps are outlined in Section4by example of a 2.415 taxon tree. Finally, we conclude in Section 5 and indicate directions of current and future research.
2
Related Work
2.1 Phylogenetic Tree Viewers
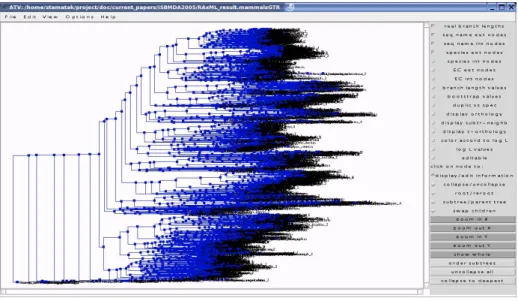
We review some popular tree viewing concepts and programs with respect to their ability for visualization of large evolutionary trees. Among the most popu-lar representations are phylogram, radial, and slanted cladogram drawings [16]. Those representation are provided by common tree-viewing programs such as Treeview [17] and ATV [29]. However, these layouts and programs are targeted at medium-sized trees comprising a maximum of 300–400 taxa. Thus, they are not well-suited to visualize large trees with thousands of taxa (see Figure3).
Approaches for larger trees make use of two-dimensional [3] and three-dimensional [12] hyperbolic space in order to simultaneously provide a detailed and contextual view of the tree. The two-dimensional hyperbolic tree-viewer Hypertree [3] is able to reasonably display tree with up to 1.000 taxa.
Other approaches such as SpaceTree [18] or TreeWiz [20] only display repre-sentative parts of very large trees. However, biologists usually prefer a simulta-neous detailed display and contextual view of phylogenies. There also exist some approaches based on virtual reality [27],[21] which are however not accessible to most researchers due to the sheer cost of the respective infrastructure.
Carrizo [6] provides a readable and comprehensive review of efforts to appro-priately display phylogenetic trees from an information visualization perspective. To the best of our knowledge our implementation represents the first dedi-cated adaptation of treemaps to display phylogenetic trees.
2.2 Treemaps
The concept of treemaps for visualization purposes was initially proposed by Johnson and Shneiderman in 1991 [13]. It is particularly aimed at displaying tree structures. The standard treemap algorithm starts with a given area and positions a number of siblings within this area from left to right or top to bottom
respectively in the same way as standard tree algorithms. The essential difference is that treemaps fill the entire available space and make use of rectangles to display nodes and hierarchies. In contrast, standard tree-representation such as e.g. cladograms draw a symbol for nodes at the center of the provided area and then connect the nodes via edges.
In particular, treemaps can—apart from simply dividing the space into sub-areas of equal size for each descendant—adjust the size of each sub-area depend-ing on additional parameters/information located at the nodes. The color inten-sity of each treemap rectangle can be used to visualize branch length (weight) values. The method described so far represents the standard treemap-algorithm which is also known as slice & dice because the produced rectangles are relatively thin.
The squarified algorithm [5] is a variation of the slice & dice algorithm which seeks to solve the visibility problem of thin rectangles by drawing them in an as
squareas possible. Since fittingnsquares of a given area into a rectangle of pre-defined dimensions is an NP-complete problem [14], the optimal solution—if it exists—takes exponential time to compute. To solve this problem the restrictions are relaxed in [5] such thatperfectsquares are not required anymore. Those two algorithms (slice & dice, squarified) cover the two opposite ends of the aspect-ratio versus preservation-of-order spectrum.
Another variation for treemap drawing which intends to attain a compromise between the two previously mentioned approaches is the strip & ordered algo-rithm [2]. Apart from the different algorithms to draw treemaps with distinct rectangular shapes there exists a number of additional measures to enhance the visualization and interpretability of treemaps. The addition of frames (or bor-ders) draws a border around each internal node such that the internal structure becomes more clearly visible [5]. When using a treemap without borders the risk of hiding color information of an internal node is high. The addition of cushions [5] can be used to create a pseudo-3D effect instead of displaying flat two–dimensional areas. At each hierarchy level of the tree a bump is added to the respective nodes to generate cushions.
3
Implementation
Now we describe how the treemap visualization mechanism has been adapted to display phylogenetic trees. One important property of the tree topologies— obtained e.g. by maximum likelihood analysis—is that they are strictly bifur-cating unrooted trees, i.e., describe the relativeevolutionary history of the or-ganisms (see Figure1). Moreover, the visualization of the branch lengths is very important since they denote evolutionary distances between organisms. Thus, mechanisms to sufficiently highlight branch lengths and to root the tree at arbi-trary branches are required.
In general, branch lengths can be displayed by the addition of a see-through border to each node. The width of this border is proportional to the distance from the parent. However, this approach consumes valuable pixels and hence
Fig. 2.The color of a node indicates the distance from the parent
limits the size of displayable trees. Therefore, we use the node color to indicate the distance from the parent (see Figure2).
To visualize additional information for the tree, it is possible to load an annotation file that contains labels assigned to each leaf of the tree. A unique color is automatically assigned to each label and all leaves with the same label are shown in the treemap with the same color. We use this feature to indicate the taxonomic order of each species in the phylogenetic tree. The taxonomic orders can be assigned to a tree in the Newick file format using an external script and taxonomic information from the Integrated Taxonomic Information System on-line database available under http://www.itis.usda.gov. This kind of visualization can indicate very efficiently potential problems like outliers in the constructed tree.
The tree-viewer implements two of the aforementioned treemap algorithms (see Section 2.2): The standard slice & dice algorithm, and the squarified al-gorithm. The rationale for selecting those two is that they embrace the entire range of the aspect-ratio versus preservation-of-order spectrum.
The software has been entirely implemented in JAVA to ensure portability. The software uses JAVA swings and the JBCL library for the graphical interface.
In the following we list some of the main features of our software:
– Borders of up to 4 pixels can be added to each node to highlight the internal structure of the tree
– Nodes can be represented as cushions using a similar, but less compute-intensive approach, as described in [5]
– The tool offers a hybrid tree/treemap representation mode which draws the upper part (close to the root) of the phylogeny in standard tree representa-tion and the lower part (subtrees containing tips) as treemaps.
– In addition to linear color coding w.r.t. branch lengths the coloring of the treemaps can be performed using exponential or logarithmic functions
– Apart from an equal rectangular area size which is usually assigned to each leaf of the treemap, the area of the leaves can be scaled according to their accumulated branch length distance from the root
– The initially unrooted phylogenetic tree is rooted at the center branch (the rooting that produces the tree with the smallest depth)
– The root can be moved with drag-and-drop to an arbitrary branch
– The user can zoom in into specific subtrees
Finally, in order to correlate the information of trees obtained by computa-tional methods with phylogenetic information from other sources our tool pro-vides the possibility to load taxonomic information about the tree species from a separate file. This additional information about families and subfamilies of or-ganisms can be used to color groups (treemaps) of species accordingly. Moreover, this allows for detection of potentially misplaced organisms and identification of errors, at least with respect to expectations from non-computational approaches to phylogenetics.
4
Results
In order to demonstrate the features of our tree-viewer we used two large tree topologies which have been computed with RAxML and Phyml. The trees con-tain 2415 mammals and were computed based on a manually aligned mitochon-drian DNA data set from Olaf Bininda–Emonds at the Technische Universit¨at M¨unchen.
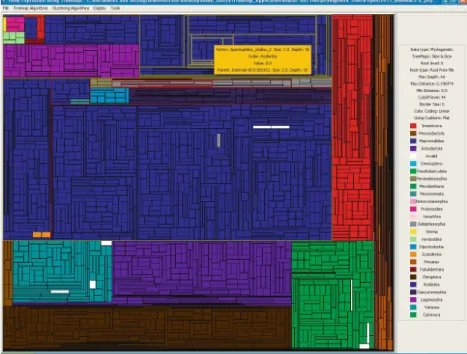
In Figure3the tree produced by RAxML is displayed using a typical tree-drawing technique. In Figures4-7the trees produced by both tools are colored according to the taxonomic order of each species using taxonomic information retrieved June 8, 2005, from the Integrated Taxonomic Information System on-line database, http://www.itis.usda.gov. Two problematic cases can be identified very easily.
1. The speciessturnaria-ilium is of the taxonomic orderchiroptera, but occurs in the tree on the branch of carnivoraand
2. thylamys-pusilla belonging to order didelphimorphia, is on the branch of
rodentia.
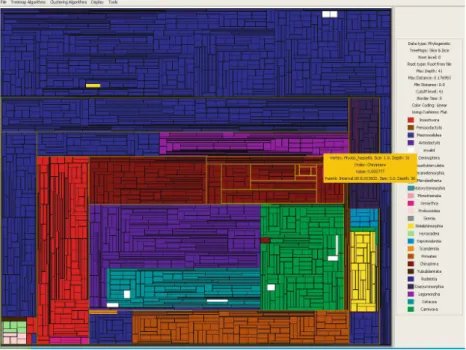
Finally, Figure8illustrates the hybrid tree/treemap viewing option.
5
Conclusion, Availability, and Future Work
Treemaps represent an effective visualization method to display and analyze hierarchical data. In this paper we have presented the—to the best of our
Fig. 3.Visualization of the 2415-taxon phylogeny of mammals with ATV
2 2
1
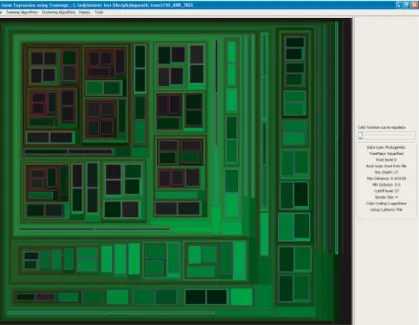
Fig. 4.The tree produced by RAxML, drawn with thesquarifiedalgorithm. The two problematic cases are indicated with circles
Fig. 5.The tree produced by RAxML, drawn with theslice and dicealgorithm
Fig. 7.The tree produced by Phyml, drawn with theslice and dicealgorithm
knowledge—first adaptation of treemaps to the particular requirements of dis-playing large phylogenetic trees. Moreover, we have introduced a hybrid tree/ treemap representation of phylogenies which provides a detailed view of the sub-trees containing the species (leaves) of the tree while maintaining a contextual view of the entire tree at the same time. Finally, we have demonstrated how tax-onomical data from other sources can be used to easily detect errors originating either from the data assembly or the tree-building process.
The visualization tool is freely available for download at www.ics.forth.gr/˜stamatak.
Future work will cover improved methods to visually emphasize that the displayed trees are unrooted. Finally, we intend to automate the retrieval process of taxonomical information about the species from public databases.
References
1. D.A. Bader, B.M.E. Moret, and L. Vawter. Industrial applications of
high-performance computing for phylogeny reconstruction. InProceedings of SPIE
IT-Com: Commercial Applications for High-Performance Computing, pages 159–168, 2001.
2. B. B. Berderson, B. Shneiderman, and M. Wattenberg. Ordered and quantum
treemaps: Making effective use of 2d space to display hierarchies. ACM
Transac-tions on Computer Graphics, 21(4):833–854, 2002.
3. J. Bingham and S Sudarsanam. Visualizing large hierarchical clusters in hyperbolic
space. Bioinformatics, 16:660–661, 2000.
4. H. L. Bodlaender, M. R. Fellows, M. T. Hallett, T. Wareham, and T. Warnow. The hardness of perfect phylogeny, feasible register assignment and other problems on
thin colored graphs. Theoretical Computer Science, 244:167–188, 2000.
5. D. M. Bruls, C. Huizing, and J.J. van Wijk. Squarified treemaps. InProceedings of
the joint Eurographics and IEEE TVCG Symposium on Visualization, pages 33–42, 2000.
6. Savrina F. Carrizo. Phylogenetic trees: an information visualisation perspective. InProceedings of the second conference on Asia-Pacific bioinformatics, pages 315– 320, 2004.
7. W. H. E. Day, D. S. Johnson, and D. Sankoff. The computational complexity of
inferring rooted phylogenies by parsimony. Math. Bios., 81:33–42, 1986.
8. M.W. Chase et al. Phylogenetics of seed plants: An analysis of nucleotide sequences
from the plastid gene rbcl. Annals of the Missouri Botanical Garden, pages 528–
580, 1993.
9. J. Felsenstein. Evolutionary trees from DNA sequences: A maximum likelihood
approach. Journal of Molecular Evolution, 17:368–376, 1981.
10. W. M. Fitch. Toward defining the course of evolution: minimum change for a
specified tree topology. Syst. Zool., 20:406–416, 1971.
11. S. Guindon and O. Gascuel. A simple, fast, and accurate algorithm to estimate
large phylogenies by maximum likelihood. Syst. Biol., 52(5):696–704, 2003.
12. T. Hughes, Young Hyun, and D.A.Liberles. Visualizing very large phylogenetic
trees in three dimensional hyperbolic space. BMC Bioinformatics, 5(48), 2004.
13. B. Johnson and B. Shneiderman. Treemaps: a space-filling approach to the
visu-alization of hierarchical information structures. InProceedings of the 2nd
14. J. Y. T. Leung, T.W.Lam, C.S. Wong, G.H. Young, F.Y.L Chin. Packing squares
into a square. Journal on Parallel and Distributed Compouting, 10:271-275,1990
15. A. R. Lemmon and M. C. Milinkovitch. The metapopulation genetic algorithm:
An efficient solution for the problem of large phylogeny estimation. Proceedings of
the National Academy of Sciences, 99:10516–10521, 2001.
16. T. Munzner, F. Guimbretiere, S. Tasiran, L. Zhang, and Y. Zhou. Treejuxtaposer:
Scalable tree comparison using focus+context with guaranteed visibility. In
Pro-ceedings of SIGGRAPH 2003, 2003.
17. R.D.M. Page. Treeview: An application to display phylogenetic trees on personal
computers. CABIOS, 12:357–358, 1996.
18. C. Plaisant, J. Grosjean, and B.B. Bederson. Spacetree: Supporting exploration in
large node link tree, design evolution and empirical evaluation. InProceedings of
the 2002 IEEE Symposium on Information Visualization, pages 57–70, 2002. 19. U. Roshan, B. M. E. Moret, T. Warnow, and T. L. Williams. Rec-i-dcm3: a fast
algorithmic technique for reconstructing large phylogenetic trees. In Proceedings
of the IEEE Computational Systems Bioinformatics conference (CSB), Stanford, California, USA, 2004.
20. U. Rost and E. Bornberg-Bauer. Treewiz: interactive exploration of huge trees. Bioinformatics, pages 109–114, 2002.
21. D.A. Ruths, E.S. Chen, and L. Ellis. Arbor3d: an interactive environment for
ex-amining phylogenetic and taxonomic trees in multiple dimensions. Bioinformatics,
pages 1003–1009, 2000.
22. M.J. Sanderson and A.C. Driskell. The challenge of constructing large phylogenetic
trees. Trends in Plant Science, 8(8):374–378, 2003.
23. A. Stamatakis. An efficient program for phylogenetic inference using simulated
annealing. InProceedings of IPDPS2005, Denver, Colorado, USA, 2005.
24. A. Stamatakis, T. Ludwig, and H. Meier. Parallel inference of a 10.000-taxon
phylogeny with maximum likelihood. In Proceedings of 10th International
Euro-Par Conference, pages 997–1004, 2004.
25. A. Stamatakis, T. Ludwig, and H. Meier. Raxml-iii: A fast program for maximum
likelihood-based inference of large phylogenetic trees. Bioinformatics, 21(4):456–
463, 2005.
26. A. Stamatakis, M. Ott, and T. Ludwig. Raxml-omp: An efficient program for
phylogenetic inference on smps. In Proceedings of 8th International Conference
on Parallel Computing Technologies (PaCT), 2005. Preprint available on-line at www.ics.forth.gr/˜stamatak.
27. B. Stolk, F. Abdoelrahman, A. Koning, P. Wielinga, J.M. Neefs, A. Stubbs, A. de Bondt, P. Leemans, and P. van der Spek. Mining the human genome using
virtual reality. In Proceedings of the Fourth Eurographics Workshop on parallel
Graphics and Visualization, pages 17–21, 2002.
28. J. Tang, B.M.E. Moret, L. Cui, and C.W. dePamphilis. Phylogenetic reconstruction
from arbitrary gene-order data. In Proc. 4th IEEE Conf. on Bioinformatics and
Bioengineering BIBE’04, pages 592–599, 2004.
29. C. M. Zmasek and S. R. Eddy. Atv: Display and manipulation of annotated