Statistical Methods for Modeling Heterogeneous
Effects in Genetic Association Studies
by Jingchunzi Shi
A dissertation submitted in partial fulfillment of the requirements for the degree of
Doctor of Philosophy (Biostatistics)
in The University of Michigan 2018
Doctoral Committee:
Associate Professor Seunggeun Shawn Lee, Chair Professor Michael Boehnke
Professor Bhramar Mukherjee Associate Professor Cristen Willer
Jingchunzi Shi [email protected] ORCID id: 0000-0002-9671-2568
c
Jingchunzi Shi 2018 All Rights Reserved
ACKNOWLEDGEMENTS
The pursuit of my doctorate degree has been a rewarding yet extremely humbling experience. This dissertation would not have been possible without the support and guidance from my committee, friends and family.
First, I would like to express my deepest gratitude to my committee chair, Dr. Seunggeun Shawn Lee, who introduced me to statistical genetics and persuaded me to pursue research in statistical methods development. Since then, he has provided me invaluable research opportunities and guidance to build a solid foundation in genetics and biostatistics. He has been extremely patient, accommodating and encouraging. His excellent mentorship has helped me mature as an independent scientist and as an individual alike.
I would like to extend the gratitude to Dr. Bhramar Mukherjee, who is always there to help and offer her guidance on research as well as career building. Her dedication and enthusiasm in science has profoundly inspired me to keep fighting the research challenges in those late nights in SPH. I truly look up to Dr. Mukherjee as my role model of a successful female scientist. I would also like express my heartfelt thanks to Dr. Michael Boehnke and Dr. Cristen Willer for their valuable and insightful advice for my research projects.
In addition, I would like to express my deep appreciation to Kirsten Herold, who has offered tremendous help on my scientific writing. I have benefited greatly from her instruction on becoming a better writer. I would also like to thank Alan Kwong for his generous help on Linux and Python programming. The same gratitude goes
to members of the Lee lab for their great exchange of scientific ideas. I truly treasure our scholastic discussions and friendships.
Last but not least, I would like to thank Paul Imbriano and my parents, for their continuous encouragement and support. They are always there to cheer me up, listen to my fears, and share my laugh. It is their love and understanding that help me get through hard times and keep me brave to face challenges. Without their blessings and encouragement, I would not have been able to finish my journey in graduate school.
TABLE OF CONTENTS
DEDICATION . . . ii
ACKNOWLEDGEMENTS . . . iii
LIST OF FIGURES . . . viii
LIST OF TABLES . . . xii
LIST OF ABBREVIATIONS . . . xiv
ABSTRACT . . . xv
CHAPTER I. Introduction . . . 1
1.1 Mapping Human Complex Traits . . . 1
1.2 The Need for Trans-Ethnic Meta-Analysis . . . 4
1.3 A General Statistical Framework for Modeling Heterogeneity in Biomedical Studies . . . 6
1.4 Dissertation Outline . . . 8
II. A Novel Random Effect Model for GWAS Meta-Analysis and its Application to Trans-Ethnic Meta-Analysis . . . 11
2.1 Introduction . . . 12
2.2 Methods . . . 15
2.2.1 Statistical Models for GWAS Meta-Analysis . . . . 15
2.2.2 New Model Framework for GWAS Meta-Analysis . . 16
2.2.3 Choice of the Kernel MatrixKfor Trans-Ethnic Meta-Analysis . . . 18
2.2.4 Hypothesis Test . . . 19
2.2.5 Using Z-scores Instead of Effect-size Estimates . . . 21
2.3 Results . . . 22
2.3.2 Type I Error Simulations . . . 23
2.3.3 Power Simulations . . . 23
2.3.4 Comparison Between Effect-size-based and Z-score-based TransMeta . . . 28
2.3.5 Computation Time . . . 28
2.3.6 Application to Type 2 Diabetes (T2D) GWAS . . . 30
2.4 Discussion . . . 33
2.5 Supplementary Materials . . . 36
2.5.1 Kernel Matrix K for Trans-Ethnic Meta-Analysis . 36 2.5.2 Derivation of the Asymptotics . . . 38
2.5.3 Using Z-scores Instead of Effect-size Estimates . . . 41
2.5.4 Prior Density Function for MANTRA . . . 43
2.5.5 Estimation of Bayes Factor Threshold . . . 45
2.5.6 Supplementary Tables and Figures . . . 46
III. Trans-Ethnic Meta-Analysis of Rare Variants in Sequencing Association Studies . . . 56
3.1 Introduction . . . 57
3.2 Methods . . . 60
3.2.1 The Random Effects Model for a Single Study . . . 61
3.2.2 The Random Effects Model for Meta-analyzing K Studies . . . 62
3.2.3 The Score Test Statistic: TransMeta-Rare . . . 66
3.2.4 Adjusting for Sample Relatedness . . . 68
3.2.5 Weights and Missing Variants . . . 69
3.2.6 Multiple Studies from the Same Ancestry Group . . 70
3.2.7 Asymptotic Distribution Approximation . . . 71
3.2.8 A Backward Elimination Algorithm to Order Rela-tive Contributions of Participating Studies to Asso-ciation Strength . . . 72
3.3 Simulation Studies . . . 73
3.3.1 Type I Error Rates . . . 74
3.3.2 Power Comparisons . . . 75
3.3.3 Computing Time . . . 84
3.4 Data Application . . . 84
3.5 Discussion . . . 90
3.6 Supplementary Materials . . . 93
3.6.1 Derivation of the Score Test Statistics . . . 93
3.6.2 Construction of the Genetic Similarity Kernel Ψ . . 96
3.6.3 Positive Definite Matrix Ψ under the Genetic Simi-larity Kernel . . . 97
IV. A Score Test for Jointly Testing the Fixed and Random
Ef-fects in Generalized Linear Mixed Models . . . 114
4.1 Introduction . . . 115
4.2 Motivating Examples and Statistical Model . . . 117
4.2.1 Motivating Examples . . . 117
4.2.2 Statistical Model . . . 120
4.3 Methods . . . 121
4.3.1 The Score Test for Gaussian Responses . . . 121
4.3.2 The Score Test for Non-Gaussian Responses . . . . 123
4.3.3 Assess Statistical Significance of the Test . . . 124
4.4 Simulation Studies . . . 126
4.4.1 Scenario 1 - Non-parametric Regression Tests in Cross Sectional Studies . . . 126
4.4.2 Scenario 2 - Non-parametric Regression Tests in Longitudinal Studies . . . 129
4.4.3 Scenario 3 - Meta-analysis on Heterogeneous Effect-sizes . . . 135
4.5 Data Application . . . 135
4.6 Discussions . . . 140
4.7 Supplementary Materials . . . 142
4.7.1 Mixed-effect Representation of the Natural Spline Es-timator for the Non-parametric Function . . . 142
4.7.2 Using Lagrange Multipliers to Determine the Form of γ . . . 144
4.7.3 Asymptotic Distribution of Sρ . . . 145
4.7.4 Asymptotic Equivalency of the Score Test to the Like-lihood Ratio Test . . . 145
4.7.5 Additional Simulations . . . 149
V. Summary and Discussion . . . 152
5.1 Summary . . . 152
5.2 Future Plans . . . 154
5.3 Closing Remarks and Perspective . . . 155
LIST OF FIGURES
Figure
2.1 Empirical power for TransMeta under different effect-size heterogene-ity configurations, with three sub-studies in each ancestry group, and significance level at α = 1.8×10⁻⁶. . . 26 2.2 Empirical power for TransMeta under different effect-size
heterogene-ity configurations, with one integrated study in each ancestry group, and significance level atα = 1.8×10⁻⁶. . . . 27
2.3 Power comparison of the effect-size-based and Z-score-based Trans-Meta, with three sub-studies in each ancestry group, and significance level atα = 1.8×10⁻⁶. . . . 29
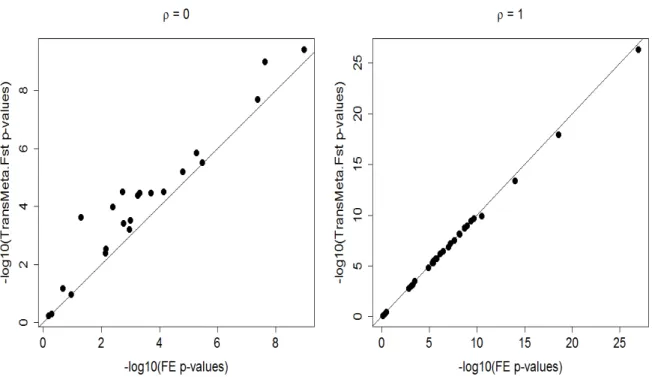
2.4 Comparison of p-values of TransMeta.Fst and FE for 69 lead SNPs in the T2D meta-analysis data. . . 31 2.5 Forest plot of the estimated OR and 95 % CI for rs10830963 in each
ancestry group in the T2D meta-analysis data. . . 32 2.6 Calibration of the Bayes’ factor to the empirical type I error rate. . 51
2.7 Empirical power for TransMeta under different effect-size heterogene-ity configurations, with three sub-studies in each ancestry group, and significance level at α = 5×10⁻⁸. . . . 52
2.8 Empirical power for TransMeta under different effect-size heterogene-ity configurations, with one integrated study in each ancestry group, and significance level atα = 5×10⁻⁸. . . 53 2.9 Power comparison of the effect-size-based and Z-score-based
Trans-Meta, with one integrated study in each ancestry group, and signifi-cance level at α = 1.8×10⁻⁶. . . . . 54
2.10 Power comparison of TransMeta under a coarse grid v.s. a dense grid, with three sub-studies in each ancestry group, and significance level atα = 1.8×10⁻⁶. . . 55 3.1 Pedigree of families, each with 10 members, in the family-based
sim-ulation studies. . . 75 3.2 Venn diagrams to illustrate causal variants selections. . . 77
3.3 Power comparison results for the continuous traits under different heterogeneity configurations, with population-based study design, equal sample size and all the causal variants being trait increasing. . . . 79 3.4 Power comparison results for the binary traits under different
het-erogeneity configurations, with population-based study design, equal sample size and all the causal variants being trait increasing. . . . 80 3.5 Power comparison results for the continuous traits under different
heterogeneity configurations, with population-based study design, equal sample size and 80% of the causal variants being trait increasing. . 81
3.6 Power comparison results for the binary traits under different het-erogeneity configurations, with population-based study design, equal sample size and 80% of the causal variants being trait increasing. . 82 3.7 Power comparison results for the continuous traits under different
heterogeneity configurations, with population-based study design, three sub-studies per ancestry group, equal sample size and all the causal variants being trait increasing. . . 85
3.8 QQ plot of TransMeta-Rare with the genetic similarity kernel for T2D and BMI. . . 88
3.9 Venn Diagram for the number of shared SNPs in genePLCD1 among the five ancestry groups. . . 89
3.10 Power comparison results for the continuous traits under different heterogeneity configurations, with population-based study design, un-equal sample size and all the causal variants being trait increasing. . 99 3.11 Power comparison results for the binary traits under different
hetero-geneity configurations, with population-based study design, unequal sample size and all the causal variants being trait increasing. . . 100
3.12 Power comparison results for the continuous traits under different heterogeneity configurations, with population-based study design, un-equal sample size and 80% of the causal variants being trait increas-ing. . . 101
3.13 Power comparison results for the binary traits under different hetero-geneity configurations, with population-based study design, unequal sample size and 80% of the causal variants being trait increasing. . 102
3.14 Power comparison results for the continuous traits under different heterogeneity configurations, with family-based study design, equal sample size and all the causal variants being trait increasing. . . . 103 3.15 Power comparison results for the binary traits under different
hetero-geneity configurations, with family-based study design, equal sample size and all the causal variants being trait increasing. . . 104 3.16 Power comparison results for the continuous traits under different
heterogeneity configurations, with family-based study design, equal sample size and 80% of the causal variants being trait increasing. . 105
3.17 Power comparison results for the binary traits under different hetero-geneity configurations, with family-based study design, equal sample size and 80% of the causal variants being trait increasing. . . 106 3.18 Power comparison results for the continuous traits under different
heterogeneity configurations, with family-based study design, un-equal sample size and all the causal variants being trait increasing. . 107 3.19 Power comparison results for the binary traits under different
het-erogeneity configurations, with family-based study design, unequal sample size and all the causal variants being trait increasing. . . 108
3.20 Power comparison results for the continuous traits under different heterogeneity configurations, with Family-based study design, un-equal sample size and 80% of the causal variants being trait increas-ing. . . 109 3.21 Power comparison results for the binary traits under different
het-erogeneity configurations, with family-based study design, unequal sample size and 80% of the causal variants being trait increasing. . 110
4.1 Functions fd(t) used in the simulation studies for the non-parametric
4.2 Power of the constancy test for Gaussian responses based on 5000 simulations in cross sectional studies. . . 130 4.3 Power of the constancy test for binary and binomial responses based
on 5000 simulations in cross sectional studies. . . 131
4.4 Power of the constancy test for Gaussian responses based on 5000 simulations in longitudinal studies. . . 133
4.5 Power of the constancy test for Binary and Binomial responses based on 5000 simulations in longitudinal studies. . . 134
4.6 Scatter plot of inverse-normal-transformed LDL-C v.s. age from the MGI data. . . 139
LIST OF TABLES
Table
2.1 Type-I error rate estimates for TransMeta at different α levels, with
three studies in each ancestry group. . . 23
2.2 Type-I error rate estimates for TransMeta at different α levels, with one study in each ancestry group. . . 47
2.3 Pairwise Fst values used for the T2D meta-analysis. . . 47
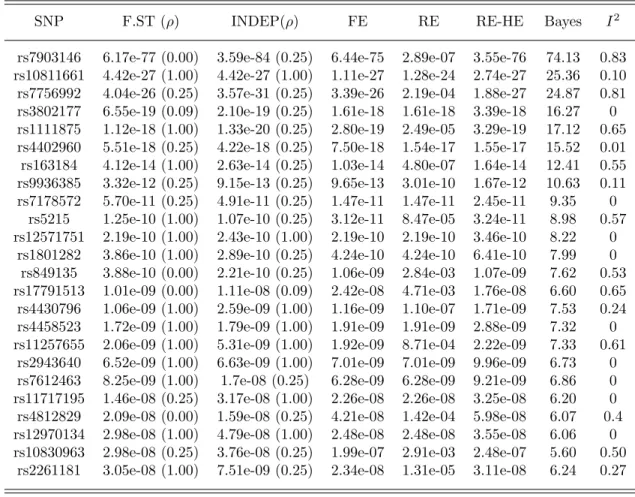
2.4 Meta-analysis results for the 24 SNPs with TransMeta.Fst p-value <5×10⁻⁸ from the T2D trans-ethnic meta-analysis data. . . . . . 48
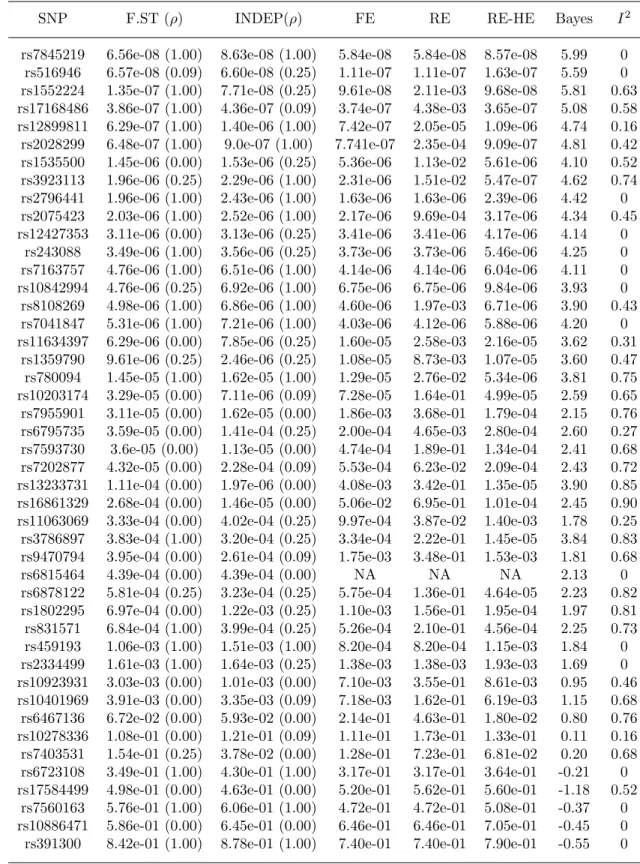
2.5 Table 2.4 continued: Meta-analysis results for the remaining 45 SNPs from the T2D trans-ethnic meta-analysis data. . . 49
2.6 Summary of the computed I2 statistic in the power simulations. . . 50
2.7 Contingency Table of the selected optimalρvalue from TransMeta.Fst for each of the 2000 SNPs in the five power comparison scenarios. . 50
3.1 Type I error rates of TransMeta-Rare at different α levels based on 2.5×10⁷ simulations. . . 76
3.2 The genetic similarity kernel Ψ for simulation studies. . . 83
3.3 Analysis results and characteristics of gene PLCD1. . . 87
3.4 The genetic similarity kernel Ψ for T2D-GENES data. . . 89
3.5 The backward elimination sequence for gene PLCD1. . . 91
3.6 A mock example to demonstrate how to construct the genetic simi-larity kernel Ψ. . . 96
3.7 The percentages of causal variants and the corresponding cvalues in each of the three effect size heterogeneity scenarios. . . 98 3.8 The single study multi-variant SKAT-O p-values for gene PLCD1. . 98 3.9 Meta-analysis p-value from TransMeta-Rare for each of the variant
that is included inPLCD1. . . 111 3.10 Table 3.9 Continued. Meta-analysis p-value from TransMeta-Rare on
each of the variant that is included in PLCD1. . . 112 3.11 Table 3.9 Continued. Meta-analysis p-value from TransMeta-Rare on
each of the variant that is included in PLCD1. . . 113 4.1 Empirical sizes of the constancy test for Gaussian and non-Gaussian
responses based on 5000 simulation runs for non-parametric regres-sion test in cross sectional studies. . . 128 4.2 Empirical sizes of the constancy test for Gaussian and non-Gaussian
responses based on 5000 simulation runs for non-parametric regres-sion tests in longitudinal studies. . . 135 4.3 SNPs with significant main effect associations with LDL-C in the
LIST OF ABBREVIATIONS
HMP3: Phase III of the HapMap Project GLMM: Generalized Linear Mixed Model GWAS: Genome-wide Association Studies LD: Linkage Disequilibrium
LDL-C: Low Density Lipoprotein Cholesterol LMM: Linear Mixed Model
LRT: Likelihood Ratio Test MAF: Minor Allele Frequency MGI: Michigan Genomics Initiative
SAMM: Semi-parametric Additive Mixed Model SNP: Single Nucleotide Polymorphism
T2D: Type-2 Diabetes
T2D-GENES: Type 2 Diabetes Genetic Exploration by Next-generation sequencing in multi-Ethnic Samples
WES: Whole Exome Sequencing WGS: Whole Genome Sequencing
ABSTRACT
Effect-size heterogeneity is a commonly observed phenomenon when aggregating studies from different ancestries to conduct trans-ethnic meta-analysis. Irrespective of the sources of heterogeneity, classical meta-analysis approaches cannot appropri-ately account for the expected between-study heterogeneity. Therefore, to bridge the methodological gap, in the first two projects, I develop statistical methods for modeling the heterogeneous effects in trans-ethnic meta-analysis for genome-wide as-sociation studies (GWASs). In the third project, I extend the methods in trans-ethnic GWAS meta-analysis to a general statistical framework for modeling heterogeneity in biomedical studies.
In the first project, I develop a score test for the common variant GWAS trans-ethnic meta-analysis. To account for the expected genetic effect heterogeneity across diverse populations, I adopt a modified random effects model from the kernel re-gression framework, and use the adaptive variance component test to achieve robust power regardless of the degree of genetic effect heterogeneity. From extensive sim-ulation studies, I demonstrate that the proposed method has well-calibrated type I error rates at very stringent significance levels and can improve power over traditional meta-analysis methods.
In the second project, I extend the common variant meta-analysis approach to the gene-based rare variant trans-ethnic meta-analysis. I develop a unified score test which is capable of incorporating different levels of heterogeneous genetic effects across multiple ancestry groups. I employ a resampling-based copula method to estimate the asymptotic distribution of the proposed test, which enables efficient
estimation of p-values. I conduct simulation studies to demonstrate that the proposed approach is well-calibrated at stringent significance levels and improves power over current approaches under the existence of genetic effect heterogeneity. As a real data application, I further apply the proposed method to the Type 2 Diabetes Genetic Exploration by Next-generation sequencing in multi-Ethnic Samples (T2D-GENES) consortia data to explore rare variant associations with several traits.
In the third project, I develop a supremum score test for jointly testing the fixed and random effects in a generalized linear mixed model (GLMM). The joint testing framework has many applications in biomedical studies. One example is to use such tests for ascertaining associations under the existence of heterogeneity in GWAS meta-analysis; another example is the nonparametric test of spline curves. The supremum score test first re-parameterizes the fixed effects terms as a product of a scale parame-ter and a vector of nuisance parameparame-ters. With such re-parameparame-terization, the joint test is equivalent to testing whether the scale parameter is zero. Since the nuisance pa-rameters are unidentifiable under the null hypothesis, I propose using the supremum of score test statistics over the nuisance parameters. I employ a resampling-based copula method to approximate the asymptotic null distribution of the proposed score test statistic. I first investigate the performance of the method through simulation studies. Using the Michigan Genomics Initiative (MGI) data, I then demonstrate its application by assessing whether the genetics effects to Low Density Lipoprotein Cholesterol (LDL-C) can be modified by age.
CHAPTER I
Introduction
1.1
Mapping Human Complex Traits
The development of recombinant DNA and other molecular techniques in the 1970s have profoundly altered the practice of human biology. Since then, new findings in genetics and molecular biology are emerging at an unprecedented clip. These find-ings provide new insights into the human genome, and are continuously shaping our understanding of the genetic basis of health and disease. As of April 2018, the genes underlying 76% of 6,727 known monogenic Mendelian disorders have been identified (Amberger et al., 2014). Despite the success in gene mapping of Mendelian disor-ders, identifying the genetic risks for complex diseases/traits remains a challenging task, since those disorder/phenotype susceptibilities are usually influenced by genetic variants in multiple genes, environmental/behavioral factors, as well as their possible interactions.
In 1996, Risch and Merikangas (Risch and Merikangas, 1996) predicted that as-sociation studies, which compare the frequency of alleles in a particular variants between affected and unaffected individuals, can be effective tools for studying com-plex traits because of their statistical power to detect genes of small effect. However, such an approach was constrained due to the limited number of polymorphisms that could be genotyped at that time. For example, the available number of markers was
typically in the tens, and the sample size was usually in the hundreds. In the begin-ning of the 21st century, advances in the genotyping technology and the dramatically decreased genotyping cost began to facilitate the detection of a large number of poly-morphisms across the entire human genome. Since then, genome-wide association studies (GWAS) have led to a plethora of discoveries for various human complex diseases/traits (MacArthur et al., 2016).
Early GWAS mainly focused on identifying common genetic variants using single nucleotide polymorphism (SNP) arrays, but the success of these GWAS has been primarily confined to European populations. The ability to aggregate cohort-specific summary statistics from multiple studies via meta-analysis techniques has further promoted more GWAS findings in populations of European descent. However, ac-cumulating evidence has demonstrated that, for a variety of complex diseases/traits, there is substantial overlap in trait-associated loci between different ethnicities (Farrer et al., 1997; Dumitrescu et al., 2011; Carlson et al., 2013). Therefore, it is expected that the efficiency of complex-trait association studies can be further improved when populations of non-European descent are analyzed in conjunction with the European populations via trans-ethnic meta-analysis. However, the classical meta-analysis ap-proaches – both fixed-effects and random-effects models – are not appropriate for combining data across race and ethnicity, and quite limited research exists in de-veloping powerful multi-ethnic GWAS meta-analysis methods for common variants. Thus, trans-ethnic meta-analysis methods for common variant associations are greatly needed.
As of April 2018, while GWASs have successfully identified 53,069 unique SNP-trait associations (MacArthur et al., 2016), most tend to have low to moderate effect and explain only a fraction of the overall heritability (Manolio et al., 2009). The fact that array-based GWAS findings have not been able to fully explain the trait variations led to the widely debated “missing heritability” question after the 1st wave
of GWAS. A natural conjecture for the possible explanation to this problem is that the missing disease heritability is due to rare and low-frequency variants, some with large effects, which could not be captured in the genotyping array platforms (Frazer et al., 2009; Eichler et al., 2010). While the array-based GWAS continues to unearth trait-associated variants, accessibility in terms of cost and technology of next-generation sequencing has opened up the entire spectrum of genome variations for the analysis of complex diseases/traits. In 2014, the cost for whole-genome sequencing (WGS) reached the US$1000 per genome milestone. In contrast to the array-based GWAS, which focus on SNPs that are in linkage disequilibrium (LD) with the causal variants, whole-genome sequencing shifts our research interest toward analyzing causal variants and genes directly. Recent advances in sequencing technology, availability of high-quality human reference panels, and improvements in genotyping imputation accuracy have made it possible to comprehensively catalog genetic variation in population samples. In fact, sequencing studies have successfully identified rare variants that are involved in complex traits, including prostate cancer (Gudmundsson et al., 2012), Alzheimer disease (Cruchaga et al., 2014), lipids and coronary artery disease (Peloso et al., 2014) and many others.
Despite its potential contributions to solving the “missing heritability” problem, one inevitable challenge for the design and analysis of sequencing-based GWAS is that rare variant tests are usually underpowered without an exceptionally large sample size or a sufficient number of rare alleles captured (Bansal et al., 2010). One practical strategy to improve power is to conduct trans-ethnic meta-analysis, which combines summary statistics across studies from different ethnicities to increase sample sizes. However, under the presence of inter-study genetic effect heterogeneity across an-cestries, existing meta-analysis approaches may be unsatisfactory because they do not take into consideration that studies from the more closely related ancestries can be more homogeneous than those that are more distantly related. In order to take
full advantage of the strengths of multi-ethnic meta-analysis, powerful trans-ethnic GWAS meta-analysis methods for rare variant associations are greatly needed.
1.2
The Need for Trans-Ethnic Meta-Analysis
Meta-Analysis is a practical tool to aggregate studies that have already been con-ducted. In ideal situations, meta-analysis can achieve eventually equal power as the joint analysis (Liu et al., 2014). Besides its ability of increasing sample sizes with-out the cost of additional genotyping, meta-analysis has several logistic and ethical advantages over the joint analysis of individual level data. First, meta-analysis only requires summary statistics from each participating study, which avoids the cumber-some integration of genotype and phenotype data from different studies, and protects the privacy of study participants. Second, different studies may require different sets of covariates, which can be difficult to accommodate in a joint analysis, but can be easily incorporated at the summary level statistic in meta-analysis.
Initially, GWAS meta-analyses were mostly European-based, and have proved to be worthwhile in identifying additional complex trait loci (Bustamante et al., 2011). Recently, GWAS have been undertaken in other ethnic groups including Africans, East and South Asians and Hispanics (Popejoy and Fullerton, 2016). With the increasing availability of GWAS from distinct ethnicities, trans-ethnic meta-analysis offers an exciting opportunity to enrich the association strengths with the further increased sample sizes and fine mapping through different LD patterns (Li and Keating, 2014). In fact, trans-ethnic meta-analyses have successfully identified novel loci that are associated with common oncologic diseases, including breast cancer (Siddiq et al., 2012) and prostate cancer (Kote-Jarai et al., 2011); metabolic and cardiovascular diseases/ traits, including high-/low- density lipoprotein (HDL/LDL) levels(Coram et al., 2013), blood pressure (Franceschini et al., 2013) and coronary artery disease (Dichgans et al., 2014); immune diseases such as rheumatoid arthritis (RA) (Okada
et al., 2014) and asthma (Lasky-Su et al., 2012); and many others.
For trans-ethnic GWAS meta-analysis, in addition to its primary objective on dis-ease/trait locus discoveries, several other goals can be simultaneously accomplished using the features of trans-ethnic study designs. Firstly, trans-ethnic GWAS meta-analysis provides an independent replication sample set that can be used to validate single-population GWAS findings and to eliminate concerns about sub-/cryptic- pop-ulation stratification in the single GWAS discoveries (Campbell et al., 2005). Those validated variants can be further used to prioritize loci for secondary replication and sequencing studies (Cantor et al., 2010). Secondly, in trans-ethnic GWAS meta-analysis, differences in LD structures across genetically diverse populations is po-tentially a powerful tool for fine mapping the rare or causal variants that underlie disease associations (Teo et al., 2010). Despite the promising potential, however, the between-study genetic effect heterogeneity among different ethnic groups, e.g. un-equal genetic effect sizes among studies (Wang et al., 2013), presents new challenges in performing trans-ethnic meta-analysis.
In GWAS meta-analysis of common variants, several reasons can contribute to the emergence of complex between-study heterogeneity patterns. First, it is highly possi-ble that the queried SNP is not the underlying causal SNP, but rather is correlated to the causal SNP through LD. Therefore, due to variations in the LD structures across ancestry groups, the same high-risk allele may have different patterns of association with the causal allele among different populations, leading to the observed unequal genetic effects at the marker alleles. This phenomenon can be particularly relevant under the common disease – common variants (CD-CV) model (Cargill et al., 1999; Chakravarti, 1999), in which differential recombination histories can occur due to the varying age of the mutations in the different populations (Pritchard and Prze-worski, 2001). Moreover, the presence of hidden stratification in some populations may produce spurious associations or alter the patterns of true associations, and
therefore further complicate the between-study heterogeneity (Morton and Collins, 1998; Pritchard and Przeworski, 2001; Thomas and Witte, 2002; Stumpf and Gold-stein, 2003; Freedman et al., 2004). In addition, the genetic variant of interest may interact with other environmental, dietary and lifestyle factors. Thus, the difference in these factors among populations can generate variability in the marginal genetic effects between studies (Morris, 2011).
For rare variant GWAS meta-analysis, even if the same variant selection crite-ria are employed, different studies may still present different sets of rare vacrite-riants, since rare variants are often population specific. Therefore, the gene-level association power will likely be unequal among studies, even when effect size across studies is the same for each variant. The possible gene-environment interaction, which contributes to heterogeneous genetic effects in common variant GWAS meta-analysis, also adds to the complex between-study heterogeneity patterns in rare variant meta-analyses. Irrespective of the sources of genetic heterogeneity, classical GWAS meta-analysis ap-proaches cannot appropriately account for the expected between-study heterogeneity. Therefore, to bridge this methodological gap, in the first two projects of this disserta-tion I present two novel statistical methods for modeling the heterogeneous effects in genetic association studies – for both common variants and rare variants – to improve the power of trans-ethnic meta-analysis.
1.3
A General Statistical Framework for Modeling
Hetero-geneity in Biomedical Studies
The key idea in modeling the between-study heterogeneity in GWAS meta-analysis is to decompose the magnitude of the effect size into two components: a fixed con-stant which represents the mean effect size over all populations, and a random vari-able which measures deviation of the study-specific effect from the population mean.
Consequently, assessing associations in trans-ethnic meta-analysis is essentially a joint testing of fixed and random effects.
The statistical framework of jointly testing the fixed and random effects has many applications in the field of biomedical studies. One such example is the likelihood ratio test proposed by Han and Eskin (2011) for ascertaining association signals un-der the existence of between-study heterogeneity in GWAS meta-analysis. Another example is the SKAT-O test proposed by Lee et al. (2012), which optimally com-bines the burden (Madsen and Browning, 2009) and SKAT (Wu et al., 2011) tests for assessing the gene-/region-based rare variant association strengths. It can be shown that an alternative way of deriving the score statistic for SKAT-O is to jointly test the mean (i.e. the fixed effect) and variance component (i.e. the random ef-fect) of the regression coefficient of the genetic variant. To assess the age-varying genetic effect, one can incorporate age (or any non-genetic modifier of interest) into a non-parametric functional form in the varying coefficient model and reformulate the problem of testing the varying coefficient into jointly testing the fixed and random effects in a generalized linear mixed model (GLMM) (Zhang and Lin, 2003; Wang and Chen, 2012). Last but not least, the joint testing framework can be employed in the non-parametric test of spline curves in a semi-parametric additive mixed model (SAMM).
Testing the random effects involves constraints on the variance component param-eters, in which classical inference with a standard null distribution no longer holds, because those parameters under the null hypothesis lie on the boundary of the main-tained hypothesis (Lin, 1997; Andrews, 2001). Although the statistical literature offers an array of methods for testing the fixed and random effects jointly for Gaus-sian responses, corresponding methods for non-GausGaus-sian outcomes remain limited. In response, in my last project, I propose to extend the methods in trans-ethnic GWAS meta-analysis to a general statistical framework with a score test for the joint testing
problem in a GLMM.
1.4
Dissertation Outline
In Chapter II, I develop a score test for the common variant associations in trans-ethnic meta-analysis. To account for the effect-size heterogeneity across diverse popu-lations, I adopt a modified random effects model from the kernel regression framework. Specifically, I treat the genetic effect coefficients as random variables and construct their correlation structure to reflect the level of genetic effect similarities across an-cestry groups. In addition, I use an adaptive variance component test to achieve robust power regardless of the degree of genetic effect heterogeneity. Through ana-lytical approximation of the asymptotic distribution of the proposed test, I achieve efficient computing time for genome-wide datasets, as the method requires less than 3 hours on a Linux cluster node with 2.80 GHz CPU to analyze one million vari-ants. Using extensive simulation studies, I demonstrate that the proposed method has well-calibrated type I error rates at very stringent significance levels and im-proves power over the traditional meta-analysis methods. Re-analyzing a published type 2 diabetes GWAS meta-analysis (Mahajan et al., 2014), I successfully identify one additional SNP which exhibits genetic effect heterogeneity across ethnicities.
In Chapter III, I extend the score test in Chapter 2 to the gene-/region-based rare variant trans-ethnic meta-analysis in sequencing association studies. The pro-posed method is capable of not only accounting for the expected heterogeneous ge-netic effects among studies, but also flexibly modeling varying levels of heterogeneity according to the relatedness between the populations. The proposed method only requires sharing of study-specific summary statistics, such as the score statistics for each variant and the corresponding information matrices which summarize the LD structures between the variants. I employ a resampling-based copula method to es-timate the asymptotic null distribution of the proposed test, which enables efficient
estimation of p-values. I conduct simulation studies to demonstrate that the proposed approach is well-calibrated at stringent significance levels and improves power over current approaches under the existence of genetic effect heterogeneity. As a real data application, I further apply the proposed method to the Type 2 Diabetes Genetic Exploration by Next-generation sequencing in multi-Ethnic Samples (T2D-GENES) consortia data to explore rare variant associations with several traits.
In Chapter IV, I develop a supremum score test for jointly testing the fixed and random effects in a generalized linear mixed model (GLMM) for both Gaussian and non-Gaussian outcomes. The framework of jointly testing the fixed and random effects has many applications in biomedical studies. One example is to use such tests for as-certaining associations under the existence of heterogeneity in GWAS meta-analysis; another example is the nonparametric test of spline curves. Although extensive re-search has been conducted on testing random effect terms only, little work has been done for the joint test of fixed and random effects, especially for non-Gaussian out-comes. Hence, I propose a score test for the joint test in a GLMM to handle both the Gaussian and non-Gaussian response types, and use analytical derivation as well as numerical simulation to demonstrate that the proposed score test is asymptoti-cally equivalent to the corresponding likelihood-ratio test (LRT). The method first re-parameterizes the fixed effects terms as a product of a scale parameter and a vector of nuisance parameters. With such re-parameterization, the joint test is equivalent to testing whether the scale parameter is zero. Since the nuisance parameters are unidentifiable under the null hypothesis, I propose using the supremum of score test statistics over the nuisance parameters. I employ a resampling-based copula method to approximate the asymptotic null distribution of the proposed score test statistic. I first investigate the performance of the method through simulation studies. Using the Michigan Genomics Initiative (MGI) data, I then demonstrate its application by assessing whether the genetics effects to Low Density Lipoprotein Cholesterol
(LDL-C) can be modified by age. Finally, in Chapter V, I discuss the implications of my work and propose potential future directions to pursue.
CHAPTER II
A Novel Random Effect Model for GWAS
Meta-Analysis and its Application to Trans-Ethnic
Meta-Analysis
Abstract
Meta-analysis of trans-ethnic genome-wide association studies (GWAS) has proven to be a practical and profitable approach for identifying loci that contribute to the risk of complex diseases. However, the effect-size heterogeneity cannot be easily ac-commodated through existing fixed-effects and random-effects methods. In response, we propose a novel random effect model for trans-ethnic meta-analysis with flexi-ble modeling of the expected genetic effect heterogeneity across diverse populations. Specifically, we adapt a modified random effect model from the kernel regression framework, in which genetic effect coefficients are random variables whose correlation structure reflects the genetic distances across ancestry groups. In addition, we use the adaptive variance component test to achieve robust power regardless of the degree of genetic effect heterogeneity. Simulation studies show that our proposed method has well-calibrated type I error rates at very stringent significance levels and can improve power over the traditional meta-analysis methods. We re-analyze the published type 2 diabetes GWAS meta-analysis (Mahajan et al., 2014) and successfully identify one
additional SNP that clearly exhibits genetic effect heterogeneity across different an-cestry groups. Furthermore, our proposed method provides scalable computing time for genome-wide datasets, in which an analysis of one million SNPs would require less than 3 hours on a Linux cluster node with 2.80 GHz CPU to analyze one million variants.
Keywords: Common variants; Effect-size heterogeneity; GWAS; Kernel regression; Random effect model; Trans-ethnic meta-analysis.
2.1
Introduction
Although genome-wide association studies (GWAS) have successfully identified more than 50,000 loci that influence the severity of human health outcomes, those identified loci account for only a small fraction of the genetic contribution to most complex diseases and traits (McCarthy et al., 2008; MacArthur et al., 2016). It has been argued that numerous loci with very small effects can explain additional disease risk or trait heritability, and the challenge is to find those loci that can be identified only with very large numbers of samples (Eichler et al., 2010). Since it can be challenging to design and conduct a single study with tens or hundreds of thousands of samples, a more practical alternative is to combine studies that have already been conducted through a meta-analysis (Evangelou and Ioannidis, 2013).
A natural extension of the single-ancestry-based meta-analysis is to include sam-ples from as many studies as possible, even if they come from genetically disparate ancestries. With the further enlarged sample size, trans-ethnic meta-analysis is ex-pected to be more powerful at detecting novel loci without the cost of additional genotyping (Cooper et al., 2008). In fact, several trans-ethnic meta-analyses have been performed in the past few years with success in discovering risk alleles across ancestry groups. For example, five consortia (Mahajan et al., 2014) aggregated
pub-lished GWAS meta-analyses of type 2 diabetes (T2D) from four ancestry groups and successfully identified seven new loci with very small effect sizes.
To take full advantage of the profitability of trans-ethnic meta-analysis, improved statistical methods are required to account for the distinctive ancestral origins among data. Existing methods for GWAS meta-analysis include the classical fixed-effects and random-effects methods, as well as the recently introduced new random-effects method by Han and Eskin (2011) and the Bayesian approach by Morris (2011). The fixed-effects method (FE) (Hedges and Vevea, 1998) is the most popular approach for synthesizing single-ancestry GWAS data. It assumes that the true effect of each risk allele is the same in each data set, and as a result, it has limited power in the presence of genetic effect heterogeneity (Evangelou and Ioannidis, 2013; Wang et al., 2013). The random-effects method (RE) was developed explicitly to model the between-study heterogeneity; however, it implicitly assumes heterogeneity under the null hypothesis, which causes it to have much lower power than FE (Han and Eskin, 2011). To relax the conservative assumption of RE, Han and Eskin (2011) developed a new random-effects model (RE-HE) which achieves higher power than RE. Morris (2011) developed a trans-ethnic meta-analysis method by means of a Bayesian partition model (MANTRA). MANTRA accounts for the relatedness of studies by grouping them into different ethnic clusters. Specifically, studies that are grouped into the same ethnic cluster share the same underlying genetic effect, while different ethnic clusters have different underlying genetic effects.
The aforementioned T2D trans-ethnic meta-analysis (Mahajan et al., 2014) was carried out using the FE method. In addition to identifying novel T2D susceptibil-ity loci, they analyzed 69 established T2D susceptibilsusceptibil-ity loci using Cochran Q test (Cochran, 1954) to evaluate their genetic effect heterogeneity. Among the 69 loci, 3 had very strong evidence of the heterogeneity (Cochran Q p-value < 10−3), and 12
those 15 loci, FE may not be sufficiently powerful to detect the association signals. To improve power, we develop a new trans-ethnic meta-analysis approach, referred to as TransMeta, and use it to reanalyze the T2D trans-ethnic meta-data.
As mentioned above, one challenge in trans-ethnic GWAS meta-analysis is to ap-propriately account for the effect-size heterogeneity. There can be several reasons for the heterogeneous effect sizes. First, it is highly possible that the queried SNP is not the underlying causal SNP, but rather is correlated to the causal SNP through linkage disequilibrium (LD). Variations in the LD structures across ancestry groups can lead to the observed genetic effect heterogeneity. Second, the environmental risk factors may differ between ancestry groups. With the possibility of interaction between the causal variants and the environmental factors, marginal genetic effects may vary be-tween populations (Morris, 2011). To address the heterogeneity issue, we consider a modified random effect model based on a kernel machine framework (Liu et al., 2007). Specifically, we treat the genetic effect coefficients as random variables, with their correlation structure across ancestry groups reflecting the expected heterogene-ity (or homogeneheterogene-ity) among ancestry groups. To test for associations, we derive a data-adaptive variance component test with adaptive selection of the degree of het-erogeneity. This adaptive test combines models of homogeneous and heterogeneous genetic effects, and provides robust power regardless of the genetic effect distribution. We provide details of our proposed method in Section 2.2.
The rest of this chapter is organized as follows: In Section 2.3, we first perform simulation studies to compare the performance of TransMeta with FE, RE, RE-HE and MANTRA for meta-analyzing GWAS across genetically diverse populations. We then illustrate application of TransMeta by reanalyzing the T2D GWAS in Mahajan et al. (2014). We conclude this chapter with a discussion in Section 2.4. Supplemen-tary texts, tables and figures are presented in Section 2.5.
2.2
Methods
2.2.1 Statistical Models for GWAS Meta-Analysis
In this section, we first introduce statistical models of the existing GWAS meta-analysis methods. Let βb = (βb1, . . . ,βbn)T be the effect-size estimates, such as the log
odds ratios or regression coefficients, inn independent studies. If the sample sizes in each study are sufficiently large, then
b
β|β ∼M V N(β,Σ), (2.2.1)
where β = (β1, . . . , βn)T, with βi being the true effect size in the ith study; and
Σ =diag(σ12, . . . , σ2n), with σ2i being the variance of βbi.
FE assumes that all the studies share a common effect-size µ (i.e. β1 = · · · =
βn = µ). FE is powerful at detecting genetic effects that are present in most, if not
all, of the studies with homogeneous effect sizes. The RE model assumes that the true effect sizeβi for theith study is generated from a normal distribution with mean
µand variance τ1,
βi =µ+ηi, ηi ∼N(0, τ1). (2.2.2)
RE typically assumes that even under the null hypothesis of no association, βis can
be different across studies, sinceτ1 is not assumed to be zero under the null
hypoth-esis. Due to this conservative assumption, RE tends to be less powerful at detecting association signals than FE, although it is proposed to account for the expected heterogeneity. Han and Eskin (2011) developed a new RE approach (RE-HE) that assumes no genetic effect heterogeneity under the null hypothesis. Specifically, they assumed that βis are zero among all the studies under the null hypothesis (i.e. µ= 0
andτ1 = 0), and they allowed varying effect sizes among studies under the alternative
hypothesis. The likelihood ratio test was employed to evaluate the null hypothesis of µ = 0 and τ1 = 0. Since asymptotic p-values of RE-HE are only accurate when
the number of studies (n) is very large, they provided tabulated p-values precom-puted with an assumption of equal sample sizes across studies. In the presence of between-study effect-size heterogeneity, RE-HE yields higher power than FE.
The aforementioned three frequentist meta-analysis methods can all be summa-rized under model (2.2.2) with certain assumptions on τ1. With τ1 = 0 under both
the null and the alternative hypotheses, model (2.2.2) is exactly the same as FE. RE assumes that τ1 is non-zero under both the null and the alternative hypotheses,
and tests whether µ= 0 or not, while accounting for the between-study variance τ1.
RE-HE assumes that τ1 = 0 under the null hypothesis, and tests whether both µand
τ1 are zero under the alternative hypothesis.
Unlike the frequentist approaches, the Bayesian meta-analysis approach, MANTRA, assigns studies into ethnic clusters under model (2.2.1). It assumes that studies that are grouped into the same ethnic cluster share the same underlying genetic effect. If we fix the number of clusters as one, all the studies are grouped into one ethnic cluster with homogeneous genetic effects; in this case, MANTRA can be viewed as a Bayesian implementation of the fixed-effects method. If the number of cluster is fixed to be the same as the number of studies (n), each study is assigned to be its own cluster; in this case, MANTRA can be viewed as a Bayesian implementation of the random-effects method. MANTRA uses the Bayesian partition model to adaptively determine the number of ethnic clusters and the cluster membership and assesses the association evidence by means of the Bayes factor.
2.2.2 New Model Framework for GWAS Meta-Analysis
The existing frequentist meta-analysis methods based on (2.2.2) are not optimal when the effect sizes exhibit certain structures across studies. In multi-ethnic meta-analysis, for example, the studies can be grouped by their ethnicities. Genetically similar groups may have more homogeneous genetic effects compared to genetically
diverse groups. In response, we propose a statistical framework that can accommodate prior assumptions on genetic effect distributions. Specifically, we adapt the kernel machine framework (Liu et al., 2007) to flexibly model the genetic effect distributions. Instead of assuming ηis are i.i.d normal samples, we assume that ηis jointly follow a
mean zero Gaussian process with kernel functionτ1K(·,·), whereK(·,·) is a bivariate
function to represent genetic similarity between two groups. This kernel regression framework has been successfully applied in many areas of genetic studies, including rare variant association analysis (Wu et al., 2011) and pathway analysis (Liu et al., 2007). In Section 2.2.3, we will discuss choices of kernels for trans-ethnic meta-analysis.
We first propose to extend (2.2.2) to a hierarchical model by modeling µ as a random variable with distributionN(0, τ2). From this extension, our proposed model
framework can be summarized as
b
β|β ∼ M V N(β,Σ)
β|τ1, τ2 ∼ M V N(0, τ1K+τ211T), (2.2.3)
where K is an n × n kernel matrix and 1 = (1,· · · ,1)T. We then apply a re-parameterization τ1 =τ(1−ρ) and τ2 =τ ρ, where ρ reflects whether genetic effects
are homogeneous (ρ= 1) or heterogeneous (ρ= 0) across ancestry groups, andτ rep-resents the size of the regression coefficientsβ. From this re-parameterization, testing for bothµ and τ1 being zero becomes testing for the common variance componentτ
being zero. Our final model framework is
b
β|β ∼ M V N(β,Σ)
β|τ ∼ M V N(0, τ Vρ)
Vρ = (1−ρ)K+ρ11T, 0≤ρ≤1 (2.2.4)
where Vρ is an n ×n (scaled) covariance matrix of β. We note that Vρ is a linear
of heterogeneity. ρ = 0 indicates that the covariance structure of βis is the same as
the kernel matrix K, andρ = 1 indicates thatβis are perfectly correlated (and hence
homogeneous).
Our proposed model includes the three frequentist meta-analysis approaches as special cases. For example, if ρ = 1 (i.e Vρ = 11T), the model is effectively the
same as FE since all βis should be the same under the alternative hypothesis. We
show in Section 2.2.4 that the variance component score test for τ = 0 with ρ = 1 is exactly the same as the inverse-variance weighted meta-analysis test, the most popular test for the FE approach. As a result, one of the important features of our model is that it includes FE regardless of the choice of K. We believe this is a desirable feature since numerous disease-associated SNPs in various meta-analysis scenarios including trans-ethnic meta-analysis exhibit homogeneous genetic effects across studies (Marigorta and Navarro, 2013). RE and RE-HE are equivalent to testing for τ2 = 0 and τ1 = τ2 = 0 under (2.2.3), respectively, with K = I. This
indicates that RE is equivalent to testing for ρ = 0, and RE-HE is equivalent to testing for τ = 0 while adaptively selecting ρ under the re-parameterized model (2.2.4) with K=I.
2.2.3 Choice of the Kernel Matrix K for Trans-Ethnic Meta-Analysis Suppose the GWAS meta-analysis has B ancestry groups from n studies, based on this assumption, we propose two choices for the kernel structureK:
Choice 1. Group-wise independent kernel structure:
We consider a simple assumption in which genetic effect sizes are independently distributed across ancestry groups, but homogeneous within the same ancestry group.
In particular, Kij =
1 if study i and j belong to the same ancestry group 0 otherwise
,
where i, j ∈ {1, . . . , n}. In Supplementary Materials Section 2.5.1, we provide the general form of matrix K under this group-wise independent structure.
Choice 2. Genetic similarity (Fst) kernel structure:
The fixation index (Fst) is a widely used measure of population differentiation
due to genetic structure (Wright, 1949). Fst = 0 indicates there is no allele frequency
differentiation between populations, whereas a large value of Fst indicates that
pop-ulations are genetically very different. Fst has been used as a genetic distance among
populations. For example, MANTRA uses Fst to group studies to ethnic clusters.
For each cluster, it is assumed that studies share the same genetic effect. We adapt the strategy of using Fst in constructing the kernel matrix K to incorporate genetic
similarity into modeling the genetic effect similarity. In particular, we set Kij = 1− Fst bb0 D , with D=b,b0∈{max1,...,B} {Fst bb0},
where study i and j belong to ancestry group b and b0 respectively, and Fst
bb0 is the
pairwiseFst between the corresponding ancestry groups. In Supplementary Materials
Section 2.5.1, we provide the general form of K under this genetic similarity (Fst)
kernel structure. Unlike MANTRA, which adaptively groups studies based on the prior model of relatedness and observed effect sizes via the Bayesian partition model, our method constructs the genetic similarity (Fst) kernel using only the genotype data
and fixes it prior to carrying out the data analysis.
2.2.4 Hypothesis Test
Under the proposed model (2.2.4), testing for H0 :β1 =· · ·=βn= 0 is the same
situation in which ρ is given before carrying out the test. Following Zhang and Lin (2003), the score test statistics of the variance component τ with a givenρ is
Sρ=βb T b Σ−1VρΣb−1βb =βb T b Σ−1[(1−ρ)K+ρ11T]Σb−1βb, (2.2.5) where Σ =b diag( b σ2 1, . . . ,bσ 2 n), and bσ 2
i is an estimate of σi2. When ρ = 1, the test
statisticSρbecomes Pn i=1βbi/ b σi2 2
,which is the test statistics of the inverse variance weighting.
For any given ρ,Sρasymptotically follows a mixture of χ2 distributions under the
null hypothesis. Specifically, if (λ1, . . . , λn) are the eigenvalues of Σb−1/2VρΣb−1/2, the
null distribution of Sρ can be closely approximated by Pnj=1λjχ21,j, where{χ21,j} are
independent χ2
1 random variables. Several methods exist to obtain tail probabilities
of the mixture ofχ2 distributions. Among them, the method to invert a characteristic
function (Davies, 1980) provides very accurate estimates of tail probabilities and is widely used in many recently developed genetic association tests (Wu et al., 2011). We employ this approach to approximate the asymptotic distribution of Sρ when ρ
is given.
In practice, however, we rarely have prior information on which ρ is optimal in terms of maximizing power. Lee et al. (2012) have studied a similar problem within a context of rare variant association analysis; they proposed to use the minimum p-value over a grid of ρ as a test statistics. We adopt the same strategy here. Specifically, we set the test statistic as T = inf
0≤ρ≤1
pρ, where pρ is the corresponding p-value of Sρ
for the given ρ. T can be obtained by a simple grid search across a range of ρ values: set a grid 0≤ρ1 ≤ρ2 ≤. . .≤ρν ≤1, then the test statistic becomes
T = min{pρ1, . . . , pρν},
and the optimalρis set as the one whose corresponding p-value (pρ) equals toT. We
observe that a dense grid of ρ does not necessarily improve power (Supplementary Figure 2.10). Therefore, we suggest usingρ= (0,0.32,0.52,1) for simulations and real
data analysis. Once the test statistic T is calculated, the next step is to obtain the corresponding p-value for ascertaining the association evidence. If we had just used the minimum p-value (which is denoted as our test statisticT) to assess significance, we would ignore the multiple comparisons between different pρ values, which would
result in inflated type I error control. Thus, we propose to use numerical integration to approximate the asymptotic distribution of T, details provided in Supplementary Materials Section 2.5.2.
2.2.5 Using Z-scores Instead of Effect-size Estimates
In previous sections, we construct our methods based on estimates of effect sizes and their standard errors. However, Z-score based approaches are also very popular in GWAS. Z-score based approaches use p-values (pi), sample sizes (ni) and direction of
effects (∆i) to construct Z-scores for each study, and then calculate a weighted sum of
Z-scores to carry out meta-analysis. A major advantage of the Z-score based approach is that it allows meta-analysis of data when effect size estimates are not available or measurements of traits are difficult to standardize, ex. tobacco or alcohol use (Evangelou and Ioannidis, 2013). In this section, we extend TransMeta to incorporate Z-score based data input.
Given the input summary statistics (pi,ni, ∆i), a signed Z-score is constructed as
Zi = Φ−1(1−pi/2)∗sign(∆i) for each study, where Φ(·) is the standard normal
dis-tribution function. For continuous traits, it can be shown that the effect size estimate
b
βi is asymptotically equivalent to Zi/
p
niqi(1−qi) (up to a scalar factor), where qi
is a minor allele frequency (MAF) of the SNP (details provided in Supplementary Materials Section 2.5.3). For binary traits, the log odds ratio estimate βbi is
asymp-totically equivalent toZi/
p
niri(1−ri)qi(1−qi), whereri =ncase,i/ni is a proportion
of case samples (Supplementary Materials Section 2.5.3). If all studies have similar ratios of cases and controls, the ri(1−ri) term can thus be ignored. Consequently,
˜
βi =Zi/
p
niqi(1−qi) and its standard error ˜σi = 1/
p
niqi(1−qi) can be used as
in-puts for both continuous and binary traits. To differentiate between the two types of input summary statistics, if effect size estimates βbis and the corresponding standard
errors bσis are used as input data for our proposed method, we denote it as effect-size
based TransMeta; if transformed Z-scores ˜βis and the corresponding standard errors
˜
σis are used as input data for our proposed method, we denote it as Z-score based
TransMeta.
2.3
Results
2.3.1 Simulation Studies
To investigate the performance of TransMeta, we ran a series of simulations with varying assumptions on genetic effect heterogeneity across multiple ancestry groups. To generate SNPs with realistic MAF spectrums across different ancestry groups, we used Phase III of the HapMap Project (HMP3) data (Consortium et al., 2010). HMP3 consists of approximately 1.6 million SNPs, obtained from 1,184 subjects from 11 populations. We excluded the admixed African American population, combined the Japanese and Chinese as one population, and used the resulting 9 populations as seed populations to generate SNP genotypes.
The retrospective binary phenotype Yik of thekth individual in theith study was
generated using the following logistic regression model
logit P r(Yik = 1) =β0 +βigik, (2.3.1)
where gik is a genotype of the selected SNP, and βi is a log odds ratio parameter.
The intercept β0 was chosen to have disease prevalence 0.05. In each replication, we
randomly chose a SNP with a MAF of at least 1% in all populations, and generated SNP genotypes as gik ∼ Binomial(2, qi), where qi denotes the MAF of the selected
Table 2.1: Type-I error rate estimates for TransMeta at different α levels, with three studies in each ancestry group. Type-I error rate es-timates at different α levels based on 20 million replicates. Each entry represents an estimated type I error rate calculated using the proportion of empirical p-values smaller than the given level α. Three studies are sim-ulated per ancestry group, and each study had 500 cases and 500 controls.
α = 10−2 10−3 10−4 10−5 10−6
TransMeta.Fst 9.7×10⁻³ 1.1×10⁻³ 9.6×10⁻⁵ 1.0×10⁻⁵ 9.5×10⁻⁷
TransMeta.Indep 9.8×10⁻³ 0.9×10⁻³ 7.6×10⁻⁵ 5.8×10⁻⁶ 4.0×10⁻⁷
b
σi as the input data. In addition, we recorded ∆i =sign(βbi), the direction of effect
and the p-value pi for testing H0 : βi = 0. We generated 500 cases and 500 controls
for each of the 9 ancestry groups in triplicate, which resulted in a total of 27 studies with a total sample size of 13,500 cases and 13,500 controls.
2.3.2 Type I Error Simulations
To estimate type I error rates at stringent α levels, we generated 20 million repli-cates from model (2.3.1) with βi = 0. Table 2.1 showed that the proposed methods
yields controlled type I error rates at different significance levels under the Fst
ker-nel (denoted as TransMeta.Fst), although slightly conservative under the independent kernel (denoted as TransMeta.Indep). We also considered a setting where there is only one study per ancestry group. Each study then had 1500 cases and 1500 controls. We again used model (2.3.1) withβi = 0 to simulate a total of 100 million replicates,
and observed that empirical type I error rates were well controlled (Table 2.2 in the Supplementary Materials).
2.3.3 Power Simulations
Recently, Wang et al. (2013) carried out comparisons of trans-ethnic meta-analysis methods under five different scenarios, which cover a wide range of possible scenarios
of genetic effect heterogeneity. We adopted these five scenarios to compare perfor-mances of TransMeta with existing approaches:
(a) ‘Trans-ethnic fixed-effect’, where no heterogeneity exists in genetic effects at the causal SNP between populations, specifically that, each of the 27 studies carries a genetic relative risk of 1.12 at the causal SNP.
(b) ‘Out-of-Africa effect’, where each of the 18 studies from the non-African popu-lations carries a genetic relative risk of 1.08, whereas the 9 studies from the African populations (LWK, MKK and YRI) present no genetic effects.
(c) ‘Europe and south Asia effect’, where the 12 studies from the European and south Asian populations (CEU, GIH, MEX and TSI) share the same genetic relative risk of 1.2, whereas the 15 studies from the remaining populations present no genetic effects. (d) ‘Heterogeneous Out-of-Africa effect’, where the causal variant has genetic effects only in non-African populations, with the 6 studies from the east Asian populations (CHB+JPT and CHD) each carrying a genetic relative risk of 1.15 while the Euro-pean and south Asian populations carry a genetic relative risk of 1.12.
(e) ‘Environment modifying effect’, where the causal variant has a genetic effect only in the populations living in Europe and USA, with the 9 studies from CHD, CEU and TSI each carry a genetic relative risk of 1.2.
In all scenarios, causal SNPs had the same direction of associations across ancestry groups. For each scenario, we generated 2,000 replicates to obtain empirical power. To perform a fair comparison between the frequentist and Bayesian methods, we generated 20 million SNPs under the null hypothesis and compute Bayes factors using MANTRA. We observed that a log10 Bayes factor threshold larger than 5 corresponds to a p-value threshold less than α = 1.8×10⁻⁶. To find a log10 Bayes
factor threshold corresponding to the genome-wide significance level, we carried out a simple regression analysis between empirical type I error rates and log10 Bayes factors, and observed that log10 Bayes factor= 6.34 corresponds to α= 5×10⁻⁸ (see
Supplementary Materials Section 2.5.5 for details).
Figure 2.1 showed the empirical power of TransMeta as well as existing approaches (FE, RE, RE-HE and MANTRA) under all five scenarios. It can be seen that Trans-Meta.Fst yielded the highest or near highest power among the five methods, except in scenario (e). In scenario (a) where no heterogeneity exists, all five methods per-formed similarly, with FE having the highest power, as expected. In the remaining three scenarios with heterogeneous genetic effects that are not due to the environment modification, TransMeta.Fst outperformed the four existing meta-analysis methods. Unsurprisingly, RE yielded the lowest power across all five approaches. In scenario (e) where the genetic effect was influenced by environmental exposures, populations that shared similar genetic architectures did not necessarily share similar genetic effects. This violated the assumption of using the Fst to take account of the variability in
genetic effects, and in this case, TransMeta.Indep yielded the highest power.
Figure 2.2 showed the empirical power of the five methods with one integrated study per ancestry group. The patterns of empirical power in this setting were very similar to what we observe in Figure 2.1 with three sub-studies per ancestry group, except for RE-HE, which had slightly higher power than that of TransMeta.Indep. Since TransMeta.Indep has the identity matrix as the kernel structure (i.e K = I) under this setting, the similar performance of TransMeta.Indep and RE-HE is not surprising. Overall, TransMeta.Fst attained similar or higher power over competing methods except in scenario (e).
The barplots in Figure 2.7 and 2.8 of the Supplementary Materials summarized the power of the five methods at the more stringent level α = 5×10⁻⁸; the results
Figure 2.1: Empirical power for TransMeta under different effect-size het-erogeneity configurations, with three sub-studies in each ances-try group, and significance level at α = 1.8 × 10⁻⁶. Empirical power for TransMeta and existing methods under the five effect-size sce-narios. Three studies are simulated per ancestry group, each with 500 cases and 500 controls. The empirical power is obtained based on 2000 replicates with the level of significance defined as a p-value less than 1.8×10⁻⁶ or as a log10 Bayes factor larger than 5. The five-effect size scenarios are (a) ‘Trans-ethnic fixed-effect’, where no heterogeneity exists in allelic effects at the causal SNP between populations; (b) ‘Out-of-Africa effect’, where only studies from the non-‘Out-of-African populations carry the causal variant; (c) ‘Europe and south Asia effect’, where only studies from the European and south Asian populations carry the causal variant; (d) ‘Heterogeneous Out-of-Africa effect’, where the causal variant has ge-netic effects only in non-African populations, but the effect size in the east Asian populations is different from that in the European and south Asian populations; (e) ‘Environment modifying effect’, where the causal variant has genetic effect only in the populations living in Europe and USA.
Figure 2.2: Empirical power for TransMeta under different effect-size het-erogeneity configurations, with one integrated study in each an-cestry group, and significance level at α= 1.8×10⁻⁶. Empirical power for TransMeta and existing methods under the five effect-size sce-narios. One integrated study is simulated per ancestry group, each with 1500 cases and 1500 controls. The empirical power is obtained based on 2000 replicates with the level of significance defined as a p-value less than 1.8×10⁻⁶ or as a log10 Bayes factor larger than 5. The five effect-size sce-narios are (a) ‘Trans-ethnic fixed-effect’, where no heterogeneity exists in allelic effects at the causal SNP between populations; (b) ‘Out-of-Africa effect’, where only studies from the non-African populations carry the causal variant; (c) ‘Europe and south Asia effect’, where only studies from the European and south Asian populations carry the causal variant; (d) ‘Heterogeneous Out-of-Africa effect’, where the causal variant has ge-netic effects only in non-African populations, but the effect size in the east Asian populations is different from that in the European and south Asian populations; (e) ‘Environment modifying effect’, where the causal variant has genetic effect only in the populations living in Europe and USA.
2.3.4 Comparison Between Effect-size-based and Z-score-based Trans-Meta
To demonstrate that Z-scores can be used as input summary statistics for Trans-Meta without loss of efficiency, we compared the power of the effect-size based and Z-score based TransMeta. Since the proportion of case samples was one (i.e ri = 1)
for all studies, we ignored ri in the transformation. We also considered using only
the transformed Z-scores and sample sizes as the input, which is equivalent to assume that MAFs of SNPs are the same across all studies. In this case, the transformation simplifies to ˜βi =Zi/
√
ni with standard error ˜sei = 1/ √
ni. We included this setting
because Z-scores are typically obtained without MAFs.
The scatter plot in Figure 2.3 compared the power of the effect-size-based and the Z-score-based TransMeta under the five scenarios as outlined in Section 2.3.3. The plot was generated under the settings where we had three sub-studies per ethnic group, with the level of significance as a p-value less than 1.8×10⁻⁶. The power of these two
approaches was nearly identical when we incorporate both sample sizes and MAFs in the Z-score transformations, and the power of the Z-score based TransMeta was slightly lower than the effect-size based TransMeta when only sample sizes are used in the Z-score transformations. For the one integrated study per ancestry group setting, the results were quantitatively similar to the patterns in Figure 2.3 (Figure 2.9 in the Supplementary Materials). At the genome-wide significance level, we again observed similar patterns as in Figure 2.3 and Supplementary Figure 2.9 (data not shown).
2.3.5 Computation Time
TransMeta provides scalable computation time for genome-wide datasets. To ana-lyze 2,000 SNPs in the power simulations, both TransMeta.Fst and TransMeta.Indep took 20 seconds on average on a Linux cluster node with 2.80 GHz CPU. To an-alyze one million SNPs in a genome-wide dataset, TransMeta would require less
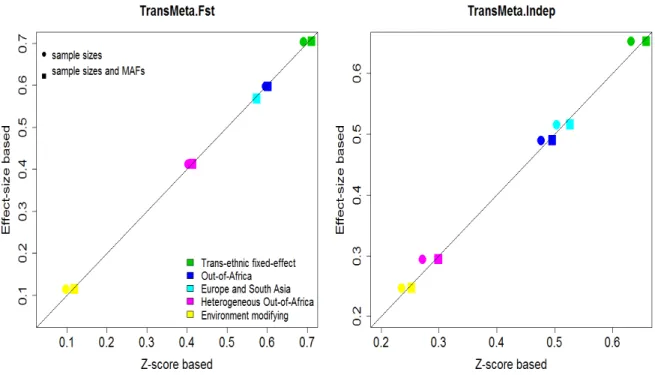
Figure 2.3: Power comparison of the effect-size-based and Z-score-based TransMeta, with three sub-studies in each ancestry group, and significance level at α= 1.8×10⁻⁶. Power comparison of the effect-size-based and Z-score-based TransMeta under the five effect size scenar-ios. Three studies are simulated per ancestry group, each with 500 cases and 500 controls. The empirical power is obtained based on 2000 repli-cates with the level of significance defined as a p-value less than 1.8×10⁻⁶.
The left panel is based on TransMeta.Fst and the right panel is based on TransMeta.Indep. In each plot, the x-axis denotes empirical power of the the Z-score-based TransMeta and the y-axis denotes empirical power of effect-size-based TransMeta. The solid dots represent the power of trans-formed Z-scores using only sample sizes, and the solid squares represent transformed Z-scores using both sample sizes and MAFs.