2015
WWW.INDUSTRY.GOV.AU/OCE
Coal in India 2015
Further information
For more information on other Department initiatives please see the Department’s website at: www.industry.gov.au/OCE For more information or to comment on this publication please email: [email protected]
Project Team Kate Penney Ian Cronshaw Acknowledgements:
The authors would like to acknowledge the contributions of: Bruce Murphy, Counsellor Industry and Science, New Delhi Resoures Division, Department of Industry and Science Geoscience Australia
Minerals Council of Australia Laura Jones
The publication also benefited from valuable comments made by other staff members.
The views expressed in this publication are those of the authors and do not necessarily reflect those of the Australian Government or the Department of Industry and Science.
© Commonwealth of Australia 2015 ISBN: 978-1-925092-63-9 [Online]
This work is copyright. Apart from use under Copyright Act 1968, no part may be reproduced or altered by any process without prior written permission from the Australian Government. Requests and inquiries concerning reproduction and rights should be addressed to [email protected]. For more information on Office of the Chief Economist research papers please access the Department’s website at: www.industry.gov.au/OCE
Creative Commons Licence
With the exception of the Coat of Arms, this publication is licensed under a Creative Commons Attribution 3.0 Australia Licence.
Creative Commons Attribution 3.0 Australia Licence is a standard form license agreement that allows you to copy, distribute, transmit and adapt this publication provided that you attribute the work. A summary of the licence terms is available fromhttp://creativecommons.org/licenses/ by/3.0/au/deed.en. The full licence terms are available from http://creativecommons.org/licenses/by/3.0/au/legalcode.
The Commonwealth’s preference is that you attribute this publication (and any material sourced from it) using the following wording: Source: Licensed from the Commonwealth of Australia under a Creative Commons Attribution 3.0 Australia Licence. The Commonwealth of Australia does not necessarily endorse the content of this publication.
Foreword
World energy consumption is likely to be one of the defining issues of the 21st century, particularly the way in which the world simultaneously addresses climate change and access to energy. Energy markets are evolving with government policies and technological advancements supporting rapid growth in renewable energy capacity. What is often overlooked is that even in recent years the use of fossil fuels has grown by even more in aggregate terms than renewables. Many OECD countries have already delivered on
commitments to reduce their use of coal and oil, but this has been more than offset by higher consumption in highly populated emerging economies such as China, India and South-East Asia.
Many emerging economies are still investing in coal-fired electricity generation to ensure reliable, low-cost electricity access to support their industrial expansion and growing populations. While the focus of energy and coal market analysis in the past decade has been on China, India is now emerging as a key consumer. India’s thermal coal imports have increased from almost zero in the 1990s to having it overtake Japan as the world’s second largest importer in 2013.
The Coal in India report is intended to contribute to the debate by examining the energy policies and regulatory settings that will influence the outlook for India’s coal industry, highlight the role of coal in
improving energy access, and discuss how technical advances can reduce growth in India’s carbon intensity. In doing so, it identifies opportunities for Australian producers and mining equipment and technology services companies in meeting India’s growing demand.
I highly recommend Coal in India to anyone seeking to develop a greater understanding of the factors shaping the growth in India’s coal use over the longer term.
Mark Cully Chief Economist
Contents
ABBREVIATIONS AND ACRONYMS 10
EXECUTIVE SUMMARY 12
INTRODUCTION 17
INDIA’S ELECTRICITY AND COAL MARKETS 21
Structure of the Indian energy sector 21
Electricity sector structure 23
Coal market structure 25
Energy and electricity use 27
Challenges to India’s electricity generation 35
Coal consumption 39
Coal-fired plant performance 42 Coal supply 43 Coal producers 48 Transport 49
Imports 51
MODI GOVERNMENT POLICIES, REFORMS AND IMPACTS 55 Economic development 56
Energy and electricity 57
Climate change and renewables 58
OUTLOOK FOR INDIA’S COAL DEMAND, SUPPLY AND TRADE 63
The IEA World Energy Outlook 63
Electricity generation 64
World coal consumption 67
India’s coal consumption 68
World coal production 72
India’s coal production 73
Challenges to India’s production growth 74
IMPLICATIONS FOR AUSTRALIA 79
APPENDIX—COAL FUNDAMENTALS 85
Part A—Coal properties and extraction 85
Coal mining methods 90
Part B—Coal-fired electricity generation 93
Carbon capture and storage 98
Part C—Trends in world coal use 99
REFERENCES 101
LIST OF FIGURES
Figure 1. World energy consumption 18Figure 2. Institutional structure of energy administration in India 23 Figure 3. Structure of India’s electricity sector 25
Figure 4. Structure of India’s coal sector 27
Figure 5. Primary energy demand 29
Figure 6. India’s energy mix 30 Figure 7. Electricity use and economic development, 2012 31
Figure 8. India’s electricity use per person, 2014 32 Figure 9. India’s power grid regions 33 Figure 10. India’s electricity generation 34 Figure 11. India’s installed capacity and generation, 2012 34 Figure 12. Transmission and distribution losses, selected countries 37 Figure 13. India’s installed coal-fired capacity 40 Figure 14. Installed coal-fired generation capacity of India’s utilities by region, November 2014 40 Figure 15. Effects of different technologies on coal use and carbon emissions 42 Figure 16. India’s proved coal reserves by region, 2014 44 Figure 17. India’s coal production by region, 2013 45 Figure 18. India’s coal supply and demand 46 Figure 19. India’s thermal coal production 47 Figure 20. India’s coal imports 51 Figure 21. India’s thermal coal imports 2013, by source 53 Figure 22. India’s electricity generation by source and CO2 intensity, New Policies Scenario 65
Figure 23. India’s electricity generation capacity under development >50 MW 67 Figure 24. World coal demand, by scenario 68 Figure 25. India’s coal demand, by scenario 69 Figure 26. World coal imports, New Policies Scenario 71 Figure 27. Share of world thermal coal trade by type, New Policies Scenario 72 Figure 28. World coal production, New Policies Scenario 73 Figure 29. India’s coal production, by method 75 Figure 30. Key coal price indicators 81 Figure 31. Projected coal production by deposit type 83 Figure 32. Coal formation 86
Figure 33. Types of coal 87 Figure 34. Open-cut coal mining 91 Figure 35. Longwall mining 92 Figure 36. Coal-fired power plant schematic 94 Figure 37. Relationship between CO2 emissions and plant efficiency 97
Figure 38. Geological storage of carbon dioxide 98 Figure 39. World coal consumption, thermal and metallurgical 100
LIST OF TABLES
Table 1. Conversion equivalents between units of energy 28 Table 2. Indian thermal coal classification 46 Table 3a. Australia’s metallurgical coal exports by destination, Mt 80 Table 3b. Australia’s thermal coal exports by destination, Mt 80 Table 4. Effect of plant efficiency on carbon emissions 95 Table 5. Typical pressure and temperature ranges, by technology type 96
LIST OF BOXES
Box 1. Energy measurement 27 Box 2. Coal-fired electricity generation technologies 41 Box 3: Coal transportation 50 Box 4: India’s Five Year Plans 58 Box 5. Indian investment in the Galilee Basin 82
Abbreviations and
acronyms
AUSC advanced ultra-supercritical (coal plant) CCS carbon capture and storage
CIL Coal India Limited COP conference of parties CPS current policies scenario CSP concentrated solar power DWT deadweight tonnes FDI foreign direct investment FYP five-year plan
Gcal gigacalorie
GDP gross domestic product GW gigawatt
GWh gigawatt hour
HELE high efficiency, low emissions HHV higher heating value
IEA International Energy Agency
IGCC integrated gasification combined cycle INDC intended nationally determined contribution kcal kilocalorie
kWh kilowatt hour
MBtu million British thermal units
METS mining equipment, technology and services MNRE Ministry of New and Renewable Energy MOC Ministry of Coal
MOP Ministry of Power
MOPNG Ministry of Petroleum and Natural Gas Mtce million tonnes of coal equivalent Mtoe million tonnes of oil equivalent
MW megawatt
NEEPCO North Eastern Electric Power Corporation NHPC National Hydroelectric Power Corporation NITI National Institution for Transforming India NPS new policies scenario
NTPC National Thermal Power Corporation
OECD Organisation for Economic Co-operation and Development PCC pulverised coal combustion
PSU public sector undertaking PV photovoltaic
ROM run of mine
SCCL Singareni Collieries Company Limited TJ terajoule
TWh terawatt hour UHV useful heating value UMPP ultra mega power plant
UNFCC United Nations Framework Convention on Climate Change USC ultra-supercritical
Executive Summary
India is the world’s third largest energy consumer, and its energy use is projected to grow at a rapid pace supported by economic development, urbanisation, improved electricity access and an expanding manufacturing base. By 2040, the International Energy Agency projects that India’s energy consumption will be more than OECD Europe combined, and approaching that of the United States.
India’s energy sector is governed by a complex institutional structure that requires heavy interaction across Ministries and jurisdictions. Accordingly, policy development or the introduction of reforms to the sector can be difficult, which has contributed to ongoing weakness in energy policy and provision, including inadequate energy delivery infrastructure and control and co-ordination issues.
To meet its growing energy requirements, India is developing all available technology options. The Government has set ambitious targets to increase the installed capacity of renewable technologies to 175 gigawatts in 2022 (from around 65 gigawatts in early 2015). India is also rapidly expanding its coal-fired electricity generation capacity, with around 113 gigawatts of new capacity already under construction or approved in addition to the 205 gigawatts of existing capacity. In 2012, coal-fired electricity accounted for 60 per cent of India’s installed capacity and 71 per cent of its electricity generation. Given the investment underway in the sector, coal will remain a key input into India’s electricity generation.
India’s coal-fired electricity generation capacity is largely based on subcritical technology and is designed to use domestically-sourced coal. Although subcritical technology is relatively low cost compared with other available technologies, it uses more coal and generates more CO2 emissions. From 2017, all new coal-fired projects developed in India are required to use supercritical technology or better. These technologies operate at a higher efficiency than subcritical plants and as such use less coal and generate fewer emissions. Plants using these technologies run more optimally using high-energy, low ash coal. India’s coal resources are typically low-energy and high ash.
India is the world’s third largest producer of thermal coal. While production has increased over the past few decades, the pace of growth has been insufficient to meet demand. Consequently, India has become more reliant on imported coal (thermal coal imports increased from 10 million tonnes in 2000 to 142 million tonnes in 2013). Most of India’s thermal coal imports have been sourced from Indonesia because of its relatively low-cost compared with other internationally traded coal; its specifications more closely match India’s domestic coal; and several Indian companies own Indonesian mines.
India’s investment in new coal-fired generation capacity will support an increase in coal use. India has plans to almost double its production to one billion tonnes by 2020 to meet its growing requirements. However, growth in production is likely to be constrained by difficulties in accessing land, lengthy approval processes, inadequate transportation systems, and poor productivity largely stemming from the use of outdated
production techniques. Further, the increased use of advanced coal-fired generation technologies will require high quality coal that is not available in large quantities in India. As a result, India is likely to continue to rely on imports.
The expansion in India’s coal use presents some opportunities for the Australian industry, which is not currently a large supplier of thermal coal to India. Australia has large deposits of high-energy, low ash coal that is suitable for use in advanced coal-generation technologies. The roll out of advanced coal generation technologies in India presents a significant long term opportunity for coal producers. In addition, India’s desire to improve the productivity and safety of domestic coal mines through advanced technology may present an opportunity for Australia’s mining equipment, technology and services sector.
COAL
in India
Coal is an important part of India’s energy mix
Opportunities for Australia
To supply high quality coal for advanced generation technologies and mining services.
India is becoming more reliant on imports.
Investment still focused on subcritical coal technologies but moving to advanced technologies.
4000 8000 12000 16000 20000 20000 40000 60000 80000 El ec tri ci ty u se p er p er so n (k W h)
GDP per person (2005 $US) United States Australia Japan Sth Korea India China 0
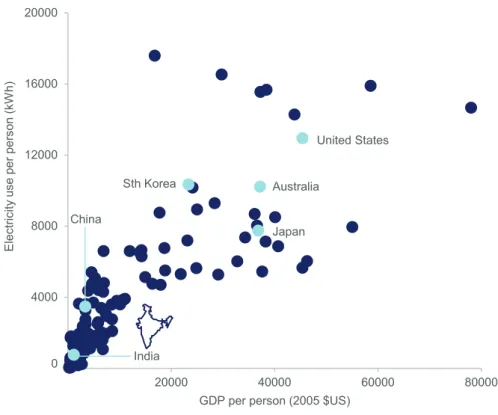
India’s per person electricity consumption is lower than advanced economies and many emerging economies.
200 400 600 800 1978 2011 M t Production Consumption 0
India’s coal demand has outstripped supply since 2009.
Despite large reserves, production growth has been well below growth in consumption over the past decade.
Source: IEA 2014d, World Bank 2015
90%
of India’s coal-fired fleet uses subcritical technology.Indian coal demand growth outstrips
Despite increased growth in other sources, coal will remain a major source of electricity generation. Increased use of renewables, nuclear and advanced coal technology will reduce carbon intensity.
200 400 600 800 1000 1200 700 1400 2100 2800 3500 4200 1990 2012 2040 gC O 2/ kW h TW h
New renewables Nuclear
Gas Hydro
Coal Electricity CO2 emissions intensity (rhs)
0 0
60%
India’s share of new subcritical plants being developed worldwide.Despite impressive renewable targets, most new capacity under development is coal-based. 0 20 40 60 80 100
coal hydro nuclear gas oil renewableother
G
W
under construction approved
Lower coal use CO2 emissions Subcritical Supercritical Ultra supercritical Advanced ultra supercritical CUBA SLOVAKIA
Source: Enerdata 2015, www.enerdata.net
Introduction
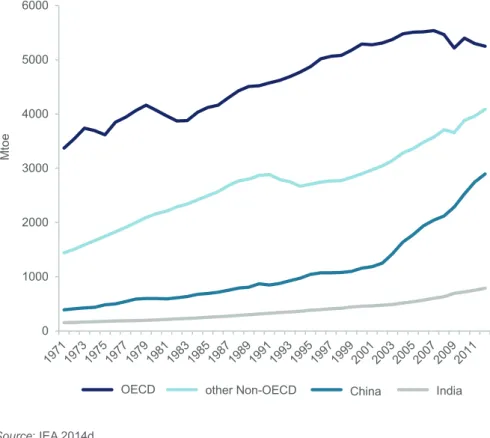
It has been clear for some time that world energy consumption growth has been driven by non-OECD countries, particularly in Asia (figure 1). Much attention has understandably been focused on China given the size of its recent economic expansion and associated increase in energy requirements. However, as China’s economic growth slows, and with it growth in energy and coal use, the focus is now rebalancing towards other emerging energy markets that are highly populated and positioned for a period of economic growth. India is a likely candidate to be the next main driver of world energy consumption as it meets both of these criteria. It has a population of around 1.3 billion people, many of whom still do not have access to electricity, and is already investing heavily to address the issues in its electricity markets. Furthermore, its economy is starting to exhibit robust growth rates with the recently elected Modi government providing a substantial lift in business sentiment.
Figure 1. World energy consumption 0 1000 2000 3000 4000 5000 6000 M to e
OECD other Non-OECD China India
Source: IEA 2014d.
India’s energy consumption has grown substantially over the past forty years, with the average growth rate increasing in the new millennium. Robust economic growth, an expanding middle class and growing population have underpinned this growth, all of which are trends that are unlikely to change in the near term. Nevertheless, the challenges facing India’s energy sector are immense. Despite the extended period of high growth in energy consumption, energy poverty remains a significant issue in India. The International Energy Agency (IEA) estimates that 304 million people (around 13 times Australia’s total population) are unable to access any electricity and many of those that have access experience regular supply disruptions that necessitate expensive diesel back-up generators (IEA 2014c). To date, plans to develop new electricity generation capacity have fallen short of the government’s ambitions and targets. Despite these shortfalls, there has still been substantial growth in India’s electricity consumption and this has primarily been met through increased use of coal. Even though it has substantial coal resources, India’s coal mining sector has been challenged by the growth in demand and the domestic supply response has not kept up. India’s electricity markets and the coal mining industry in India are heavily regulated and mostly managed by public institutions and both experience systemic supply disruptions. The large scale blackouts in northern and eastern India in July 2012, when up to 600 million people lost electricity access, epitomised the ongoing weaknesses in energy policy and delivery, including lack of generation and transmission capacity, control and co-ordination issues, and inadequate energy supply.
India’s energy consumption has grown substantially over the past forty years.
Coal is expected to play a major role in addressing some of India’s energy challenges. Reflecting its large domestic reserves, coal is already a major component of India’s energy supply, accounting for 45 per cent of its total energy mix, 60 per cent of installed electricity capacity and 71 per cent of electricity generation in 2012. Given the plans for investment in new coal-fired capacity, coal will continue to be a major component of India’s energy mix over the longer term.
One of the key challenges facing India is balancing the energy needs of its population and growing economy with the global move to reduce carbon emissions. While investment in renewable energy sources is undoubtedly on the rise in India, there is even greater investment already underway into coal-fired electricity generation which indicates that India’s coal consumption is likely to rise for some time. What remains to be seen is the role High Energy, Low Emissions technologies (HELE), such as ultra-supercritical generators, and carbon capture and storage will play in India’s energy markets. Both have the potential to provide significant reductions in carbon emissions, but come with higher capital costs.
This report focuses on the trends, policies and market structures that are shaping India’s electricity and coal mining industries both in the short and long term. It discusses the long term outlook for India’s coal consumption, production and trade by analysing the market structures, regulatory environment, electricity consumption trends and investment that underpin them. The first chapter provides an overview of India’s electricity and coal industries including the role of government, market structures and regional consumption patterns. The second chapter discusses current policies and reforms that are underway with an assessment of the effects that these may have on India’s coal consumption and production.
Chapter three reviews the IEA outlook for India’s coal demand and supply in the 2014 edition of the World Energy Outlook including some of the challenges to meeting planned targets. The report concludes with a discussion on the implications for Australia as a major coal exporter and potential investment destination. This report also includes a series of appendix that provide some background information on coal as a commodity, its use in electricity generation, HELE technologies, mining methods used to extract coal and trends in world coal use at the end of the report.
India’s electricity and
coal markets
India is a large energy consumer and producer, with a diverse consumer base. While its energy use has increased rapidly over the past few decades, per capita energy use in India remains well below OECD countries and many other emerging economies. Coal has played a vital role in meeting India’s growing energy needs over the past few decades. Even though India is a major coal producer its output has not kept pace with demand and they have become increasingly reliant on world markets to satisfy their requirements. There is a high level of government participation in the energy market, including the development of policies, research and development, regulation and provision of energy through Public Sector Undertakings. Although market-based mechanisms are slowly being introduced and there is increasing private sector involvement, the government remains a key player in the provision of energy.
The structure of India’s energy sector is complex, relying on a high level of co-ordination and co-operation between five major Ministries. This is further complicated through the extensive interaction between central and state-based government agencies. As a result of this complexity, market operation and reforms can be difficult.
Structure of the Indian energy sector
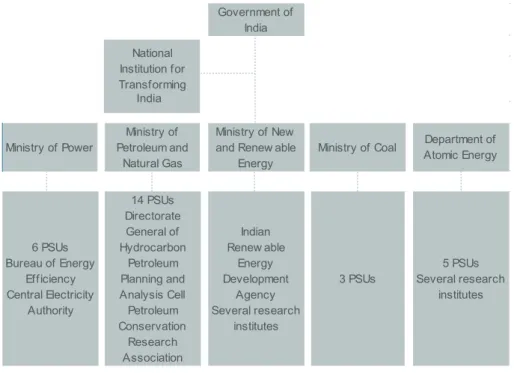
The Indian government is the principal agent in its energy market with responsibility for both setting energy policies and administering the public companies that produce energy. The institutional set-up for India’s energy sector is a complex structure of five major Ministries that are directly involved in policy making,
and have responsibility for energy provision (figure 2). Overseeing these Ministries is the National Institution for Transforming India (NITI), which replaced the Planning Commission in early 2015. The NITI is designed to become a source of relevant strategic and technical advice to the central and state governments with responsibilities across the spectrum of key policy elements. The former top down model of the Planning Commission is intended to be replaced with a more consultative, co-ordinating role, especially where issues cross central-state boundaries.
Three major Ministries; Coal, Power and New and Renewable Energy, were created from a single Energy Ministry more than 20 years ago. To improve co-ordination and deliver better outcomes, the three Ministries now report to a single Minister, Piyush Goyal, following the change in government in 2014. The Ministry of Coal (MOC) has primary carriage over policies and strategies for coal production and development. The MOC has an interest in three Public Sector Undertakings (PSUs) involved in coal production. The Ministry of Power (MOP) is responsible for planning, implementing and monitoring policy in the power sector. The MOP oversees six PSUs and two statutory authorities. The Ministry of New and Renewable Energy (MNRE) takes the lead on policy development and promotion of new and renewable energy. The MNRE has several research and development institutes that are involved in testing and demonstrating various renewable technologies; and the identification of potential sites for development (IEA 2012).
The Ministry of Petroleum and Natural Gas (MOPNG) oversees India’s oil and gas sectors including exploration and production, refining, distribution, marketing, pricing, and trade. The MOPNG has fourteen PSUs that produce oil and gas, and eight statutory bodies. The government has sole responsibility for nuclear power under the Indian Constitution. The Department of Atomic Energy has five PSUs, dedicated to nuclear energy production and research (IEA 2012).
Figure 2. Institutional structure of energy administration in India Government of India National Institution for Transforming Ministry of Power Ministry of Petroleum and Natural Gas Ministry of New and Renew able
Energy
Ministry of Coal Atomic EnergyDepartment of
6 PSUs Bureau of Energy Efficiency Central Electricity Authority 14 PSUs Directorate General of Hydrocarbon Petroleum Planning and Analysis Cell Petroleum Conservation Research Association Indian Renew able Energy Development Agency Several research institutes
3 PSUs Several research 5 PSUs institutes India
Source: based on IEA 2012, p. 18.
Electricity sector structure
Under the Indian Constitution, power is a shared responsibility between central and state governments (figure 3). The central government has a key role in electricity planning, and the formulation, implementation and monitoring of policy in the sector through the MOP. It also provides an oversight and coordination role for two statutory bodies (Central Electricity Authority and Bureau of Energy Efficiency) and six state-owned utilities. These agencies cover thermal and hydropower generation, transmission, distribution and financing. The state governments are also important to the Indian electricity sector as state-owned utilities control a large share of the transmission and distribution network (IEA 2012). In practice, most of the work in the electricity sector is undertaken by the states, with some engagement and support from the central government (IEA 2014b).
Government-owned utilities have a key role in supplying electricity in India, accounting for around 70 per cent of India’s total electricity generation. Private utilities account for the remaining 30 per cent of electricity generation and are slowly playing a larger role in electricity provision.
Key government power companies
The National Thermal Power Corporation (NTPC) is the largest power company in India. It has diversified from is traditional base of thermal assets to include hydropower, nuclear and renewable facilities. It operates 33 power plants, with a combined capacity of 38 gigawatts. Almost 90 per cent of its installed capacity is coal-fired. While NTPC is government-owned
it has Maharatna status, which gives it greater autonomy from the central government in decision making (NTPC 2015). Companies with Maharatna status can incur capital expenditure without any value ceiling; enter into joint-ventures or strategic alliances; restructure the organisation including opening offices abroad; and raise debt from capital markets.
The North Eastern Electric Power Corporation (NEEPCO) was established to develop electricity capacity in the north east of India. NEEPCO has 1130 megawatts of installed capacity and accounts for almost half of the installed capacity in the region (NEEPCO 2015).
The National Hydroelectric Power Corporation (NHPC) is responsible for developing hydropower, tidal, geothermal and wind-based electricity capacity. It currently has 20 plants with a combined capacity of 6500 megawatts (NHPC 2015).
Key private power companies
The private sector is involved in the generation, transmission and distribution of electricity. However, they account for a relatively small share of the overall market. Adani Power is the largest private thermal power producer in India. It has an installed capacity of around 10 440 megawatts and owns India’s largest power plant, Mundra, in Gujurat. The plant has nine generator units with a combined capacity of around 4620 megawatts (Adani Power 2015). Tata Power is India’s largest integrated power company. It was responsible for developing India’s first 4000 megawatt Ultra Mega Power Project using supercritical technology in Gujurat. Tata Power has a total installed capacity of around 8750 megawatts based on thermal, hydro, solar and wind
technologies (Tata Power 2015).
Electricity tariffs charged by central government controlled utilities and independent power producers that deliver power to more than one state are regulated by the Central Electricity Regulatory Commission (CERC). CERC also issues licences for companies transmitting electricity across states and acts as an arbitrator in disputes between companies. State Electricity Regulatory Commissions are responsible for setting tariffs for state-owned utilities (IEA 2012).
The private sector plays a small role in the generation, transmission and distribution of electricity.
Figure 3. Structure of India’s electricity sector
Ministry of Power State Government
State government enegy agencies
Regulation
Transmission
Distribution
Central Government State Government Private Sector
Policy
Generation
Central Electricity Authority Bureau of Energy Efficiency Power Finance Corporation: finances UMPP
Rural Electrification Corporation: finances rural projects
State Electricity Regulatory Commissions
Central Electricity Regulatory Commission
Ministry of Power
National Thermal Power Corporation National Hydroelectric Power Corporation National Hydroelectric Power Corporation Joint Ventures Ministry of New and Renewable Energy Renewables Department of Atomic Energy Nuclear Power Corporation of India Ltd Central transmission utility POWERGRID
State transmisison utilities
State distribution companies State generation and distribution companies
Private distribution companies
Tata Power Delhi Distribution Ltd Others Independent transmission service providers Tata Power Others Independent Power Producers Captive Power Producers Tata Power Reliance Power Adani Power Steel Industry Fertiliser Industry Petrochemical Industry All sector
unbundled Transmissionunbundled
State power generation companies State power generation and distribution companies Source: IEA 2012, p. 33.
Note: UMPP is an ultra-mega power project. They are large projects using supercritical technology, with a capacity of around 4000 megawatts each.
Coal market structure
India’s domestic coal industry is primarily government owned and co-ordinated. The central government plays a key role in India’s coal policy development and also owns the public companies that account for most of India’s coal production (figure 4). The MOC is responsible for the formulation of policies and strategies for coal exploration, project approvals and other issues relating to the production, supply, distribution and pricing of coal in India (MOC 2014a). The Coal Controller is a subordinate office of the MOC which sets standards and procedures for assessing coal quality, inspects coal quality, performs an arbitrator role in the event of quality disputes, issues project approvals, collects excise duties and manages coal-related statistics (Coal Controller 2015).
Coal production in India has been controlled by the central government following the nationalisation of India’s coal mines in the early 1970s. All metallurgical coal mines were nationalised in 1971–72 and thermal coal mines in 1973. Coal India Limited (CIL) was formed as a holding company in 1975, incorporating the state-owned companies that were created following the nationalisation of India’s coal assets. Since its inception, three new state-owned subsidiaries were developed to reduce the administrative burden of companies spanning a large geographic area. CIL now has eight subsidiaries—Bharat Coking Coal Limited, Central Coalfields Limited, Eastern Coalfields Limited, Western Coalfields Limited, South Eastern Coalfields Limited, Northern Coalfields Limited, Mahanadi Coalfields Limited and the Central Mine Planning and Design Institute (MOC 2014b). The Indian Government divested a 10 per cent share in CIL in 2010 and intends to sell a further 10 per cent share during 2015 (MOC 2014c; IEA 2012; Kazmin 2015).
CIL accounts for around 80 per cent of India’s total coal production. The MOC is responsible for setting production targets and other performance indicators for CIL through a dedicated Memorandum of Understanding. CIL’s production target for the 2015–16 financial year (April 2015 to March 2016) has been set at 550 million tonnes, up 8.5 per cent from the previous year’s target. In the previous fiscal year CIL produced 494 million tonnes, 3 per cent below its target of 507 million tonnes (Bahuguna 2015). To achieve the new target, CIL will need to produce an extra 56 million tonnes during the 2015–16 financial year.
Although the central government has primary carriage over India’s coal sector, state governments retain some influence over developments through approval of mining licences and leases, which are required before the MOC grants final project approval, and royalty rates (IEA 2012).
Coal production in India has been controlled by the central government following the nationalisation of India’s coal mines in the early 1970s.
Figure 4. Structure of India’s coal sector
Ministry of Coal State Government
Central Mine Planning and Design Institute
Coal Controller
Ministry of Coal State Government Captive Producers
Coal India Limited Singareni Collieries
Company Limited PowerIron/Steel Cement Others
Central Government State Government Private Sector Policy
Production
Singareni Collieries Company Limited Neyvell Lignite Corporation Joint Ventures
Gujarat Mineral
Development Cooperation
Sources: IEA 2012, p. 48; MOC 2014a.
Energy and electricity use
India is the world’s third largest energy user. In 2012, India’s total primary energy demand was 788 million tonnes of oil equivalent (Mtoe), which was greater than Russia, well in excess of any IEA member except the United States, and around six times that of Australia (figure 5). India’s primary energy demand in 2012 was roughly equal to China’s energy consumption in 1990.
Box 1. Energy measurement
There are a few basic concepts that are used extensively in discussions about energy and will assist in understanding developments in world energy markets.
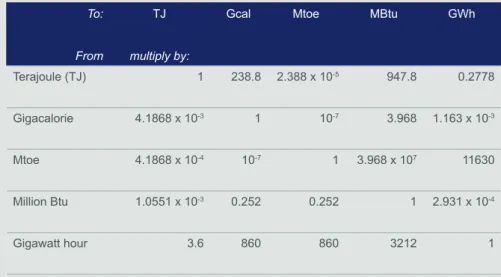
Energy can be loosely defined to include heat, power and fuels, such as oil, gas and coal. In the context of this report, energy use refers to the direct use of crude energy that hasn’t been transformed into another energy source such as electricity or refined petroleum. Electricity can be produced using natural energy sources such as hydro, solar and wind, through the heat of nuclear fission, geothermal or solar thermal, and the burning of combustible fuels such as coal, oil and gas. Fuels, such as coal, oil and gas, are measured for trading and monitoring processes that produce or use them. These can be either physical units for solid fuels (tonnes or kilograms) or volume units for liquids (cubic metres or litres). These units can be converted into energy units to facilitate the aggregation of different fuels in different physical states. The most commonly used energy units are million tonnes of oil equivalent (Mtoe), joules, calories, British thermal units (Btu) and million tonnes of coal equivalent (Mtce). The conversion equivalents are expressed in table 1.
India is the world’s third largest energy user.
Table 1. Conversion equivalents between units of energy
To: From
TJ
multiply by:
Gcal Mtoe MBtu GWh
Terajoule (TJ) 1 238.8 2.388 x 10⁻⁵ 947.8 0.2778 Gigacalorie 4.1868 x 10⁻³ 1 10-7 3.968 1.163 x 10⁻³ Mtoe 4.1868 x 10⁻⁴ 10-7 1 3.968 x 10⁷ 11630 Million Btu 1.0551 x 10⁻³ 0.252 0.252 1 2.931 x 10⁻⁴ Gigawatt hour 3.6 860 860 3212 1 Source: IEA 2005.
The conversion of a fuel from a physical or volume unit to an energy unit requires a conversion factor that expresses the heat obtained from one unit of the fuel. This conversion factor is referred to as its calorific value. The quality of fuels and hence their calorific values varies across deposits and countries.
Electrical capacity is the maximum electricity output that can be generated at a plant under certain conditions. Capacity is typically measured in multiples of Watts. The choice of multiple (kilo, mega, giga, tera) depends on the size of the plant.
Electricity generation and use is the amount of electricity produced or consumed over a certain period of time. Generation and consumption are measured as a multiple of watt hours. Many electricity plants do not operate at full capacity all the time, output is varied based on operating conditions, input costs and requirements (IEA 2005).
Figure 5. Primary energy demand 500 1000 1500 2000 2500 3000 3500
India China US EU Russia Japan Germany Australia
M to e 1990 2012 0 Source: IEA 2014d.
India’s energy demand has roughly quadrupled since 1980, and increased two and a half times since 1990, driven by both economic and population growth. The power sector has been the main contributor to the expansion in energy use, increasing its share of total primary energy demand from 23 per cent in 1990 to 39 per cent in 2012. The building (27 per cent) and industry (22 per cent) sectors are the other major energy consuming activities in India (IEA 2014a).
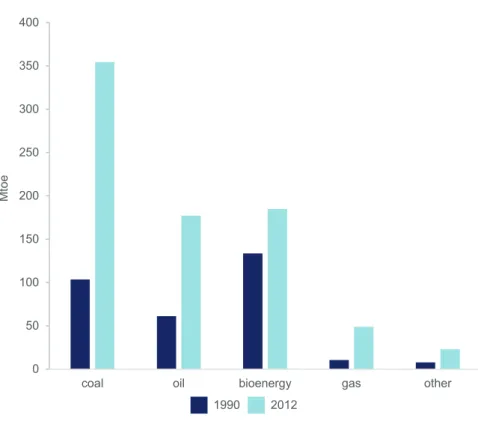
Between 1990 and 2012 the composition of India’s energy mix has changed sharply, with traditional biomass (such as wood used in heating and cooking) in particular losing share (figure 6). The share of coal increased to almost 45 per cent in 2012, up from 33 per cent in 1990. The low cost and reliability of coal, as well as its relative abundance in India, made it a preferred energy source in India.
Figure 6. India’s energy mix 0 50 100 150 200 250 300 350 400
coal oil bioenergy gas other
M
to
e
1990 2012
Source: IEA 2014d.
Energy security in India has been interpreted as a drive towards maximum levels of self-sufficiency, using domestic energy resources of hydrocarbons, bioenergy, other renewables, and even thorium (for use in nuclear power generation). This has led to an over-reliance on government-owned monopolies, and introspective policy making. Moreover, the related challenge of rapidly growing imports of fossil fuels is becoming more prominent. India imports large volumes of oil (India has limited reserves), which until recently has been putting considerable pressure on its current account deficit. Of greater concern to India is the rapid growth in gas and coal imports, because they have large reserves, where the combination of local production and transport issues have prevented output from growing at the same rate as demand. The power sector lacks the diversification of sources that most energy importers consider essential for energy security. This is reflected in the lack of diversification in energy supply sources. Around 83 per cent of India’s thermal coal imports are sourced from Indonesia and 86 per cent of its gas imports are sourced from Qatar. India’s electricity generation quadrupled between 1990 and 2012, to 1130 terawatt hours (TWh). In 2012 India was the world’s third largest electricity producer behind China and the United States, and almost equal to Germany and France combined. However, Indian electricity generators have very high own-use requirements (electricity used at the generation plant), large transmission losses (the electricity lost during transport) in excess of 20 per
India’s electricity generation quadrupled between 1990 and 2012, to 1130 terawatt hours (TWh).
cent, and high commercial losses (from power theft). As a result, India’s electricity consumption was 870 TWh, only four times higher than Australia. Given the large difference in the populations of India and Australia, this highlights the disparity in per person electricity use.
Electricity is essential to economic and human development. It supports industrialisation, improved access to clean water, sanitation and basic health as well as better education services. India’s per person electricity use is very low compared with advanced economies and still low relative to other emerging economies (figure 7). India’s low energy consumption per person can be attributed to a shortfall in electricity infrastructure, such as grid networks, as well as sufficient and reliable generating capacity. The IEA estimates that around 300 million people in India have inadequate access to electricity in India. This represents around a quarter of the population, with nearly 93 per cent of these 300 million people located in rural areas (IEA 2014b).
Figure 7. Electricity use and economic development, 2012
4000 8000 12000 16000 20000 20000 40000 60000 80000 E le ct ric ity u se p er p er so n (k W h)
GDP per person (2005 $US) United States Australia Japan Sth Korea India China 0
Sources: IEA 2014d, World Bank 2015.
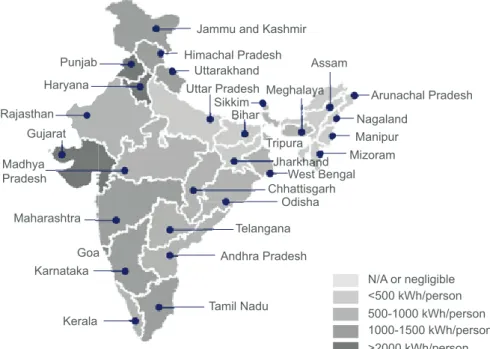
Electricity consumption per person is not uniform in India and varies between regions (figure 8). The lowest electricity consumption per person is in the east and north-east regions, which have populations of around 271 million and 44 million people, respectively. On average, residents in Bihar consumed just 179 kilowatt hours (kWh) each during 2014. By contrast, west coast regions consumed much more electricity. In 2014, residents in
Electricity is essential to economic and human development.
Goa consumed around 2300 kWh per person, almost 13 times the electricity consumed per person in Bihar. As a comparison, the average Australian consumes around 10 200 kWh per person which is about 4.5 times as much as a person in Goa and 57 times as much as a person in Bihar.
Figure 8. India’s electricity use per person, 2014
Tamil Nadu Kerala Karnataka Himachal Pradesh Uttarakhand Maharashtra Andhra Pradesh Telangana Odisha West Bengal Chhattisgarh Madhya Pradesh Rajasthan Gujarat Punjab Haryana
Jammu and Kashmir
Arunachal Pradesh Nagaland Tripura Meghalaya Assam Sikkim Uttar Pradesh Goa Jharkhand Manipur Mizoram Bihar >2000 kWh/person 1000-1500 kWh/person 500-1000 kWh/person <500 kWh/person N/A or negligible
Note: Map shows India’s territorial claims
Source: CEIC 2015.
The Indian electricity network comprises five regional grids—Northern, Western, Southern, Eastern and North Eastern (figure 9). These grids have been interconnected since the end of 2013, but transmission and distribution infrastructure remain underdeveloped. There is considerable diversity in the resources available for power generation between the regional grids. The best solar resources are in the West (Gujarat and Rajasthan); wind in the South (Tamil Nadu and Andhra Pradesh) and West (Gujarat); coal in the East and central West (Jharkhand, Odisha and Chhattisgarh); nuclear in the South, North and East (Karnataka, Andhra Pradesh, Jharkhand and Meghalaya); and hydropower in the East (Sikkim) (IEA 2014b). The difference in available resources influences the amount of power available within each of the regions. Those with insufficient resources have a power deficit, while those with large resources have a power surplus. On balance, India has been in power deficit for several years.
Figure 9. India’s power grid regions Eastern Population: 271 million Power surplus Southern Population: 252 million Power deficit North Eastern Population: 44 million Power surplus Western Population: 273 million Power deficit North Population: 369 million Power deficit
Note: Map shows India’s territorial claims
Source: IEA 2014b.
India’s electricity market is principally powered by coal which accounts for almost three-quarters of total electricity generation (figure 10). India’s coal-fired electricity generation more than doubled from around 390 TWh in 2000 to 800 TWh in 2012. In 2012, India had a total installed electricity capacity of around 250 gigawatts. Around 60 per cent of this was coal-fired. Other renewables accounted for 13 per cent of India’s installed capacity, but only supplied 5 per cent of total generation, illustrating the relatively low utilisation and efficiency of these technologies (figure 11).
India’s electricity market is principally powered by coal which accounts for almost three-quarters of total electricity generation.
Figure 10. India’s electricity generation
0 200 400 600 800 1000 coal
hydro oil and gas nuclear other renewables
TWh
1990 2012
Source: IEA 2014d.
Figure 11. India’s installed capacity and generation, 2012
0 10 20 30 40 50 60 70 80
Coal Hydro Gas Nuclear Other
Renewables P er c en t Capacity Generation
Despite the rapid increase in electricity generation in recent years, supply has still not kept up with demand growth and India has not generated enough electricity to meet its requirements for many years. One of the main ways electricity distribution companies have managed this shortfall has been to load shed which involves cutting power to one part of the system so that the entire network is not overloaded. Distribution companies have tried to reduce the effect of load shedding through advanced warning so that consumers can plan ahead. However, it generally occurs during periods of peak use—5pm until 11pm (IEA 2014b). Load shedding is disruptive to business, industry, hospitals, schools and households that do not have access to electricity for the duration of the outage. Frequent or prolonged load shedding can reduce economic activity or be a deterrent to business investment. However, load shedding is typically directed to consumers that pay the least for electricity—the residential and agricultural sectors (EIA 2014).
Challenges to India’s electricity generation
Electricity pricingElectricity price subsidies are widely used in India. Industrial consumers are often levied with surcharges to subsidise other consumers, particularly agricultural users that do not pay for electricity. Most electricity sold to households is at prices below the cost of electricity generation. It is estimated that around 87 per cent of household electricity consumption is subsidised (Pargal & Banerjee 2014). Artificially low electricity prices do not send the appropriate signals for consumers to improve energy efficiency, alter their electricity use or stimulate investment (IEA 2014b).
Electricity in India is sold through a few different mechanisms, long term contracts, short term bilateral contracts and the spot market. Distribution companies purchase electricity from state generation utilities on long-term contract. These transactions account for the majority of electricity sales in India. The prices for these contracts are determined by regulatory agencies and are usually at cost plus a margin. The electricity price set by regulatory agencies in principle reflects fuel input costs. However, electricity pricing is politically sensitive and regulators are reluctant to increase prices too frequently or by too much. As a result, distribution companies often sell electricity at a loss which reduces the profitability of the sector (IEA 2012).
Power theft
Power theft is a widespread problem in India, with some utilities claiming that up to 80 per cent of their power losses can be attributed to theft (Gupta 2014). The loss of revenue from theft reduces the finances available for maintenance of existing facilities and investment in new generation capacity. There are various methods of power theft; including illegally tapping into existing lines. In the most populous state of Uttar Pradesh, power theft is most prevalent through meter fraud and unmetered usage. Meter fraud
Despite the rapid increase in electricity generation in recent years, supply has still not kept up with demand growth and India has not generated enough electricity to meet its requirements for many years.
Power theft is a widespread problem in India.
involves the payment of bribes to officials so that they will record a lower usage figure or tampering with meters using magnets. Excess unmetered use of electricity appears to be most common among agricultural consumers, who are not charged for electricity. It is estimated that agricultural consumers account for 25 per cent of total electricity consumption and are responsible for the bulk of the power sector’s financial losses. Given the widespread and remote nature of some agricultural consumers is difficult to provide adequate metering systems to these areas (Golden & Min 2012).
A few Indian states have had some success in addressing the power theft issue. Kerala’s power utilities have a reputation of excellent revenue management and have established 13 anti-power theft squads under the anti-theft and vigilance wing of the Kerala State Electricity Board (Pargal & Banerjee 2014). Gujarat has also been successful in combatting power theft especially relating to corruption through the introduction of legislation, the establishment of police stations solely focused on power theft and the widespread installation of meters (Wilkes 2014).
At a national level, the Indian Cabinet approved a US$4 billion programme in November 2014 to roll out meters on distribution transformers, feeders and consumers in urban areas and strengthen sub-transmission and distribution networks initiatives. These measures are aimed at improving electricity access and limiting power losses through theft and any other means (Reuters 2014).
Transmission and distribution
Although India has invested heavily in new electricity generation capacity, the same level of attention has not been directed to its transmission infrastructure which has contributed to the challenge of matching electricity supply with demand. Investment plans to increase transmission capacity have been stalled by delays in acquiring land, delays in scheduling and project delivery, a lack of best practice in project execution and insufficient private sector participation (IEA 2014b).
India’s electricity grid has high transmission and distribution losses relative to the rest of the world. Even though losses have been declining, India’s losses are estimated at between 21 per cent and 30 per cent nationally and up to 67 per cent in some states (figure 12). The national average is around three times the size of losses in China and the United States.
Figure 12. Transmission and distribution losses, selected countries 5 10 15 20 25 30 1990 1992 1994 1996 1998 2000 2002 2004 2006 2008 2010 2012 P er c en t Australia India Brazil Mexico China United States 0
Source: IEA 2014e.
There are multiple reasons for India’s electricity grid performance. From a technical perspective, grid losses primarily stem from insufficient investment in maintenance and system upgrades. This has resulted in an ad hoc approach to extended distribution lines and overloaded transformers and conductors. From a commercial perspective, these losses are the result of power theft (discussed above), inadequate metering and excess consumption in heavily subsidised sectors (IEA 2014b).
In the short term, transmission, distribution and commercial losses will affect the ability of the system to match supply and demand, which may have consequences for India’s economic growth. Over the longer term, issues with transmission and distribution will also affect the ability of India to increase its reliance on renewable energy sources. Currently, India’s new solar and wind capacity is not well integrated into the electricity grid. Slow timeframes for grid connection and poor grid management have adversely affected growth in wind projects and could present a barrier for the further adoption of solar photovoltaic (PV) (IEA 2014b).
There are plans underway to double the inter-regional transfer capacity of India’s electricity grid. The MOP has also announced its intention to modernise India’s electricity distribution system and improve data collection through the Restructured Accelerated Development and Reforms Programme.
Sector profitability
India’s power sector has been making large losses over the past several years. Profitability has been affected by regulated electricity pricing, power theft (as the sector is not receiving an income for the electricity generated), transmission and distribution losses, poor billing practices, consumers failing to pay and the misclassification of customers as subsidised users (IEA 2014b). A steep rise in the cost of inputs has also increased the cost of generation. Input costs have increased because of declining domestic fuel availability (which has increased the reliance on more expensive imports) and poor procurement planning, which results in distribution companies making last minute power purchases from the spot market which is typically higher cost than long-term contracts (Pargal & Banerjee 2014).
In 2011, the combined losses of the sector were around US$10 billion, around 17 per cent of India’s gross fiscal deficit and 0.7 per cent of its GDP. Sector losses are overwhelmingly concentrated in the distribution companies (Pargal & Banerjee 2014). Low profitability in the sector reduces the capacity of companies to invest in new capacity, improved efficiency and other vital infrastructure.
Losses in the sector have been financed through heavy borrowing, typically in the form of short-term loans, to ensure that companies can meet their operating expenses. This has resulted in a more leveraged (debt-financed) capital structure across the sector and an onerous interest burden.
Persistent losses and rising debt burdens have reduced the creditworthiness of the sector, particularly distribution companies. In late 2011, many lenders withdrew finance from the sector. As credit availability declined, distribution companies were unable to pay for power purchases even when electricity was available to the market (Pargal & Banerjee 2014). As a result, many generators were failing to recover their operating costs and resorted to reducing output to well below capacity, creating supply problems (IEA 2014b). It has also slowed investment in new electricity generation capacity. Should the sector continue to struggle with profitability, with flow on effects for the speed and scale of investment, it is possible that India will be unable to meet its ambitious expansion targets.
Regulation and project approvals
India has often missed the electricity capacity expansion targets outlined in its Five-Year Plans (FYP). One of the greatest barriers to the development of electricity infrastructure (both generation and distribution) is the time required to obtain the relevant clearances. While these regulations have important functions in ensuring community rights and environmental protection, dealing with the relevant ministries is complex and at times politically and socially sensitive. More recently, infrastructure projects have been delayed by public protests and formal appeals through the legal system (IEA 2014b).
India’s power sector has been making large losses over the past several years.
Coal consumption
India is the world’s third largest coal consumer behind China and the United States; and the share of coal in India’s electricity mix has been rising. In 2013 India’s coal consumption was estimated at 790 million tonnes (or 516 million tonnes of coal equivalent (Mtce), around 10 per cent less than the United States (IEA 2014f). Thermal coal accounts for around 85 per cent, or 665 million tonnes, of India’s coal consumption. Metallurgical coal (80 million tonnes) and lignite (45 million tonnes) make up the balance.
The power sector accounts for more than 70 per cent of India’s coal use and supported a five-fold increase in coal use in electricity generation over the past few decades. As such, the power sector is clearly central to the coal outlook in India. India’s steel production has increased by around 25 per cent over the past five years to around 83 million tonnes in 2014. The cement industry, the second largest globally after China, is also a major coal user, accounting for around 5 per cent of total coal use. Other industrial sectors, including brick manufacture, consume small quantities of coal.
Coal-fired generation
India has invested heavily in new coal-fired generation over the past few decades to support its rapid growth in electricity consumption (figure 13). The rate of growth in India’s coal-fired generation capacity has accelerated since 2008 with installed capacity almost doubling in just six years. India’s coal-fired capacity is located close to large demand centres with around 42 per cent of capacity located in the western region, 27 per cent in the north and 18 per cent in the south (figure 14). Unlike many OECD countries, India’s installed capacity is relatively new and has many years of operational life remaining.
India has invested heavily in new coal-fired generation over the past few decades to support its rapid growth in electricity consumption.
Figure 13. India’s installed coal-fired capacity 50 0 100 150 200 250 19 90 19 91 19 92 19 93 19 94 19 95 19 96 19 97 19 98 19 99 20 00 20 01 20 02 20 03 20 04 20 05 20 06 20 07 20 08 20 09 20 10 20 11 20 12 20 13 20 14 G W
Source: Enerdata 2015, www.enerdata.net.
Figure 14. Installed coal-fired generation capacity of India’s utilities by region, November 2014 Tamil Nadu Kerala Karnataka Himachal Pradesh Uttarakhand Maharashtra Andhra Pradesh Telangana Odisha West Bengal Chhattisgarh Madhya Pradesh Rajasthan Gujarat Punjab Haryana
Jammu and Kashmir
Arunachal Pradesh Nagaland Tripura Meghalaya Assam Sikkim Uttar Pradesh Goa Jharkhand Manipur Mizoram Bihar >11 GW 8-11 GW 5-8 GW <5 GW N/A or negligible
Note: Map shows India’s territorial claims
Until 2010 almost all Indian coal-fired plants used subcritical technology, with an average efficiency of around 28 per cent, compared with 36 per cent in China and 33 per cent in the United States. Reflecting the relatively lower efficiency, the emissions from India’s coal fleet are around 1100 grams of CO2 per kilowatt hour, which is well above the most efficient plants at around 750 grams (IEA 2014b; IEA Clean Coal Centre 2014). In addition, the use of poor quality, high ash, Indian coal, while affecting the type of plants that have traditionally been built and hence efficiency, also reduces plant availability, as more frequent maintenance is required.
These factors have underpinned the targets in the Twelfth FYP (running from 2012 to 2017) to build large scale, more efficient supercritical plants. Furthermore, it is intended to use more efficient cooling technologies, avoid drawing on increasingly scarce inland water resources and use higher quality, low ash coal in order to maximise the efficiency gains, and raise plant utilisation, through higher coal availability and shorter maintenance times. This coal has tended to come chiefly from Indonesia, where several private power companies have an ownership stake in local mines.
The first supercritical plant in India was commissioned in 2012. It is expected that plants using this technology will account for an increasing share of new plants being developed—an estimated 40 per cent of new plants being developed over the current decade—as policy mandates their use beyond 2017. Nonetheless, the efficiency of Indian coal-fired power plants will remain well below global best practice, and subcritical plants will dominate the power mix for some time.
Box 2. Coal-fired electricity generation technologies
Pulverised Coal Combustion (PCC) is the most common coal-fired technology deployed worldwide. There are a few PCC technologies being used that have markedly different efficiencies, costs and pollution outcomes. The efficiency of a plant refers to the electricity produced for a given heat input. In coal-fired power plants, this depends on the temperature and pressure of the steam generated in the boiler during combustion. The efficiency of a plant increases as both temperature and pressure are increased.
Subcritical technologies are the most common coal-fired plant utilised. It has the lowest efficiency (around 30 per cent) of the available technologies. Subcritical plants generally have low capital costs, which supports its large-scale uptake. Supercritical technologies achieve efficiencies of around 40 per cent. The capital cost of these plants is higher because it must use materials with a greater heat tolerance in the boiler. Supercritical plants use less coal and generate less CO2
than subcritical plants.
Ultra-supercritical and Advanced ultra-supercritical plants operate at efficiencies between 45–50 per cent. The capital cost of these plants is high because they must use advanced materials (with high nickel content) in the boiler. They use less coal and emit less CO2 than supercritical plants.
Plants that utilise supercritical technologies and above require higher energy coal, with low ash content, to operate optimally. See Appendix Part B for further details.
Coal-fired plant performance
The average efficiency of India’s coal-fired power fleet is relatively low compared with other large energy users such as China and the United States. The two underlying causes of this are the quality of coal used and the technical specifications of the generation fleet. Improvements in both areas could produce substantial improvements in efficiency and total output, while reducing carbon and particulate emissions per unit of electricity. Figure 15 illustrates the effect of different technologies on an 800 megawatt power station operating at a capacity factor (actual output relative to potential output) of 80 per cent and generating 6 TWh a year (IEA Clean Coal Centre 2014).
Figure 15. Effects of different technologies on coal use and carbon emissions
Subcritical
Supercritical
Ultra-supercritical (USC)
Advanced USC (AUSC)
5.39 Mt 4.70 Mt 4.35 Mt 3.76 Mt C02=81 C02=70 C02=87 C02=100
Coal use Emissions
Source: IEA Clean Coal Centre 2014.
Note: Emissions are relative to a subcritical plant i.e a supercritical plant generates 13 per cent less CO2
India’s domestically produced coal typically has a low to medium energy content, ranging from 2500 kilocalories per kilogram to 5000 kilocalories per kilogram (Australia’s exports typically have an energy content greater than 5500 kilocalories per kilogram). The energy content of India’s coal has been declining steadily over the past several decades as mines deplete their resources. The average energy content was 5900 kilocalories per kilogram in the 1960s, 4200 kilocalories per kilogram in the 1980s and around 3500 kilocalories per kilogram in the 2000s (IEA 2014b). This means that larger volumes of coal must be burned to achieve the same level of electricity generation and more pollutant emissions are generated.
According to the World Health Organization, six of the ten cities with the highest concentrations of PM2.5 (particles less than 2.5 microns) are located in India. New Delhi has the highest concentration of PM2.5, with an annual average of 153 micrograms per cubic metre. By contrast, Beijing
The average efficiency of India’s coal-fired power fleet is relatively low compared with other large energy users such as China and the United States.
has an annual average of 56 micrograms per cubic metre, almost a third of the levels observed in New Delhi (WHO 2014). Coal-use in power generation can contribute to PM2.5, but is not the main source. Motor vehicles, residential wood burning, forest fires, agricultural burning and some industrial processes can also contribute to PM2.5 concentrations.
The high ash content and moderate moisture of Indian coal lowers its heating value and reduces the efficiency of its power plants. The high levels of silica in Indian coal also result in the ash by-product being highly corrosive. The corrosion makes the operation and maintenance of India’s coal-fired fleet and the removal of ash more difficult relative to plants using higher grade coals.
The efficiency of a power plant is also affected by the temperature difference between the internal heat source and the external environment. India’s high ambient temperatures and relative humidity are not consistent with achieving some of the efficiencies achieved in cooler climates such as in Europe. Coal-fired power plants in India tend to perform better in winter than in summer (IEA 2014b). Finally, around 90 per cent of India’s coal-fired fleet utilises subcritical technologies that have substantially lower efficiency rates than the supercritical and ultra-supercritical technologies that have been developed and deployed in various countries (see Appendix Part B for more detail on these technologies). Moreover, much of India’s older generators are smaller units with efficiency well below 30 per cent (IEA 2014b).
Coal supply
Coal reserves and production
Coal is a key commodity in ensuring India’s energy security because it is the most abundant non-renewable energy source in India. It has the world’s fifth largest proved recoverable reserves of coal (60.6 billion tonnes) after the United States (237.3 billion tonnes), Russia (157.0 billion tonnes), China (114.5 billion tonnes) and Australia (76.4 billion tonnes) (WEC 2013). However, some experts have questioned whether these deposits are
accessible given current technologies being deployed (IEA 2012). If reserves are overestimated, this could become a problem for production planning over the medium to longer term. Most of India’s coal reserves are located in the east, with Jharkhand, Odisha, Chhattisgarh and West Bengal accounting for around 78 per cent of total proved reserves (figure 16). The distribution of India’s coal reserves creates a supply challenge for India. The bulk of its coal resources are geographically separated from its principal areas of consumption and it requires substantial infrastructure networks to transport it from mine sites to generators.
Coal is a key commodity in ensuring India’s energy security because it is the most abundant non-renewable energy source in India.
Figure 16. India’s proved coal reserves by region, 2014 >20 Bt 13-20 Bt 5-13 Bt <5 Bt N/A or negligible Tamil Nadu Kerala Karnataka Himachal Pradesh Uttarakhand Maharashtra Andhra Pradesh Telangana Odisha West Bengal Chhattisgarh Madhya Pradesh Rajasthan Gujarat Punjab Haryana
Jammu and Kashmir
Arunachal Pradesh Nagaland Tripura Meghalaya Assam Sikkim Uttar Pradesh Goa Jharkhand Manipur Mizoram Bihar
Note: Map shows India’s territorial claims
Source: CEIC 2015.
Reflecting the location of its coal reserves, the majority of India’s coal
production is based in the east of the country (figure 17). Jharkhand, Odisha, Chhattisgarh and West Bengal account for around 65 per cent of India’s coal production. A further 23 per cent of India’s coal production is sourced from Madhya Pradesh and Andhra Pradesh.
Figure 17. India’s coal production by region, 2013 >100 Mt 50-100 Mt 10-50 Mt <10 Mt N/A or negligible Tamil Nadu Kerala Karnataka Himachal Pradesh Uttarakhand Maharashtra Andhra Pradesh
Note: Map shows India’s territorial claims
Telangana Odisha West Bengal Chhattisgarh Madhya Pradesh Rajasthan Gujarat Punjab Haryana
Jammu and Kashmir
Arunachal Pradesh Nagaland Tripura Meghalaya Assam Sikkim Uttar Pradesh Goa Jharkhand Manipur Mizoram Bihar Source: CEIC 2015.
Coal quality varies substantially across India and the MOC classifies thermal coal into seven grades based on heat value, ash content, and gross calorific value (table 2, MOC 2014d). Indian coal typically has a low energy content compared with other internationally traded coals which typically have one-third to one-half greater energy content than average Indian coals. Indian coals also have high ash content (30 per cent to as much as 50 per cent), and low sulphur content. The moisture content of Indian coal is variable and is typically higher in coal produced during monsoon season (IEA 2012). Accordingly, Indian coal is generally unsuited for export, with higher quality imported coal often blended with domestic coal to raise quality and hence the combustion efficiency of India’s coal-fired fleet. Alternatively, Indian coal is washed to reduce the volumes of impurities and improve coal quality. However, beneficiation (washing) capacity in India is limited and capacity utilisation is low (Bhattacharya et al 2013). Coal washing, identified as a key technology in the Eleventh FYP from 2007 to 2012, to improve efficiency and reduce pollution, fell far short of targets, with capacity only reaching 125 million tonnes a year, and washed coal production falling short of 50 million tonnes. In the Twelfth FYP from 2012 to 2017, thermal coal washing capacity is planned to reach 175 million tonnes.
Coal quality varies substantially across India.