VOLUME 40, ARTICLE 36, PAGES 1047
-
1062
PUBLISHED 18 APRIL 2019
http://www.demographic-research.org/Volumes/Vol40/36/ DOI: 10.4054/DemRes.2019.40.36
Descriptive Finding
Gender-specific effects of commuting and
relocation on a couple’s social life
Natascha Nisic
Stefanie Kley
This publication is part of the Special Collection on “Spatial Mobility, Family Dynamics and Gender Relations,” organized by Guest Editors Sergi Vidal and Johannes Huinink.
© 2019 Natascha Nisic & Stefanie Kley.
This open-access work is published under the terms of the Creative Commons Attribution 3.0 Germany (CC BY 3.0 DE), which permits use, reproduction, and distribution in any medium, provided the original author(s) and source are given credit.
1 Introduction 1048
2 Gender-specific outcomes of couples’ spatial mobility 1049
3 Data characteristics and variables 1050
4 Effects of commuting and relocation on individual satisfaction with social life
1055
Gender-specific effects of commuting and relocation
on a couple’s social life
Natascha Nisic1
Stefanie Kley2
Abstract
BACKGROUND
This contribution analyzes gender-specific effects of long-distance commuting and residential relocation on the social integration of couples. Research on geographical mobility in the partnership context focused very much on gender differences of regional mobility with respect to labor market outcomes and economic success. The effects of regional mobility and their possibly gendered impact on social networks and the social integration of households have been understudied. However, one would expect that regional mobility imposes severe temporal and geographical restrictions on the formation and upholding of social relationships. Moreover, these restrictions can be assumed to differ by gender due to differential involvement of women and men in market and domestic care work, which also present different opportunities and constraints for maintaining and forming social contacts.
OBJECTIVE
Against this background we analyze the effects of internal migration and job-related commuting on couples’ social relationships.
METHODS
The analysis is based on the British Household Panel Study (BHPS) waves 1997–2008. We first give extensive descriptive overview on the social structure of mobile couples and the amount and perceived quality of social contacts men and women maintain. Second the effects on quality (i.e., the satisfaction with one’s social life) are analyzed within a panel fixed-effects framework.
RESULTS
Results indicate that regional mobility affects women more than men. In particular women who move for her partner’s job prospects suffer losses in perceived quality of
1 Institute of Nutrition, Consumption and Health, Paderborn University, Paderborn, Germany. Email:[email protected].
social life. Female commuters are dissatisfied if they have low qualification and are only weakly integrated in the labor market. Among male commuters time restrictions due to high workload are detrimental to their social life.
1. Introduction
Most previous research on geographical mobility in the partnership and household context focuses largely on gender differences in determinants and outcomes of regional mobility with respect to labor market outcomes and economic success. Overwhelming evidence has shown that long-distance migration and commuting in general enables men to take advantage of better job opportunities and higher income levels in distant regions, but their female partners often suffer income and job losses following joint migration. Women cannot initiate moves or take up commutes that benefit their own careers, especially if they are mothers (Boyle et al. 2001; Shauman and Noonan 2007; Smits 2001). Sociological and economic explanations emphasize gender inequalities in the labor market that lead to women holding a subordinate position in job-related household decisions while also remaining largely responsible for domestic and care work.
However, while also emphasizing the involvement of women in the nonmarket sphere and their responsibilities in the organization of families’ everyday life to explain gender differences, the literature on geographical mobility has overlooked the effects of mobility on the nonmarket sphere itself and on noneconomic outcomes in general (Belot and Ermisch 2006; Nisic and Petermann 2013). In particular, the effects of regional mobility and its possibly gendered impact on social networks – as well as the social integration of households – are thus far understudied. This presents a serious shortcoming in many ways. The psychological literature shows a large body of evidence indicating that social support from personal ties is crucial for individual well-being and coping with stress and crisis (Cohen and Wills 1985; Cohen 2004; Folkman and Moskowitz 2000; Feeney and Collins 2015). At the same time, we can assume that different forms of regional mobility, such as relocation or long-distance commuting, might impose severe temporal and geographical restrictions on the formation and maintenance of social relationships.
2. Gender-specific outcomes of couples’ spatial mobility
Empirically, there is overwhelming evidence that women are more willing to compromise their careers for the occupational advancement of their male partners (e.g., Cooke 2008; Nisic and Abraham 2014). This tendency is clearly reflected in the outcomes of long-distance migration, which yields positive income growth and stable employment for men (Cooke 2003; Jacobsen and Levin 1997, 2000; Smits 2001) but significant earnings losses and reduced employment for their female partners (Boyle et al. 2001; Shauman and Noonan 2007; Smits, Mulder, and Hooimeijer 2004; Mincer 1978). Moreover, studies regarding the determinants of migration also show that household moves are mostly influenced by male partners’ employment-related characteristics, including their education (Nivalainen 2004; Tenn 2010). Hence, although we can expect long-distance migration to be equally disruptive on each spouses’ home-centered social networks, the women’s social life might suffer more because mobile women might be forced to rely exclusively on home-centered networks (after the move) relative to men who are socially integrated at the (new) workplace.
Against this background we analyze the effects of long-distance household moves and job-related long-distance commutes on the perceived quality of social relationships that men and women in partnerships maintain.
3. Data characteristics and variables
Our database is the British Household Panel Study (BHPS) – a nationwide representative survey that was conducted annually in Great Britain between 1992 and 2008. The sample of analysis is restricted to 1997 to 2008 because information on the frequency of social contacts was first gathered in 1997. To assure comparability of the two mobility types (moving and commuting), the sample was restricted to the working age population (18 to 59 years); commuting is identified by work-trip length. Furthermore, because the analysis focuses on gender-specific arrangements and patterns within couples, only individuals living with their partner in a joint household were selected. The sample for analysis comprises N = 50,400 person-years.
The sample characteristics are described in Table 1. The dependent variable in the multivariate analyses (Section 4) is individual satisfaction with one’s social life and reflects the subject view on one’s social integration; this was measured on a 7-point Likert scale from 1 (not satisfied at all) to 7 (completely satisfied). Male and female respondents are, on average, reasonably satisfied with their social life (4.8 on this scale). The objective indicator (i.e., the frequency of meeting people outside the household) was measured on a 5-point scale, whereas 1 denotes ‘never,’ 2 ‘less than once a month,’ 3 ‘once or twice a month,’ 4 ‘once or twice a week,’ and 5 denotes ‘most days.’ This scale was not metric and was highly skewed, and thus it was dichotomized. The value 1 was assigned to persons who rarely meet other persons, that is, once or twice a month or less (15.9%), whereas the value 0 comprises those who meet other people more often, that is, at least once or twice a week. The Pearson’s correlation among satisfaction with social life and the dichotomized indicator for
meeting people is moderate (r2 = –0.10). The distributions of the other independent
satisfied with their social lives. There are twice as many male (9.3%) than female (4.4%) long-distance commuters. Having a lower level of education (i.e., primary or lower secondary education) is more common among women (19.6%) than men (17.9%). More men (38.7%) have higher vocational degrees or university degrees than women (35.7%). In this sample, women earned a considerably lower monthly net wage of 877£ on average compared to 1,824£ among men. This large difference also reflects the lower labor market participation of women – we assigned nonworking individuals zero earnings to keep them in the sample and to avoid selectivity problems in the multiple regression analyses. Women work full-time (i.e., more than 30 hours per week) considerably less often (42.5%) than men (83.2%), and working part-time (less than 30 hours a week) is much more frequent among women (29.7%) than among men (2.0%). Correspondingly, the distribution of full- and part-time workers among the partners of respondents is the reverse. Finally, the men’s average overtime at work (4.3 hours) is considerably higher than among women (1.9 hours).
Table 1: Sample description (couples only, 18–59 years)
Variable Mean Std.Dev. Min. Max. Women: Mean Men: Mean
Satisfaction with social life1 4.8 1.4 1 7 4.8 4.8 Meet people rarely2 0.16 0.36 0 1 0.13 0.18 Long-distance commuter (≥1 h) 0.07 0.25 0 1 0.04 0.09 Moved ≥50 km 0.04 0.20 0 1 0.04 0.04 Age 40.5 10.4 18 59 40.1 41.0 Number of persons in household 3.3 1.2 2 16 3.3 3.3 Number of children aged 0–2 0.12 0.35 0 3 0.12 0.13 Number of children aged 3–4 0.11 0.33 0 3 0.11 0.12 Number of children aged 5–11 0.40 0.72 0 4 0.39 0.41 Number of children aged 12–15 0.22 0.50 0 4 0.22 0.23 Housework at least 60% woman’s task 0.69 0.46 0 1 0.69 0.69 Education: low (primary or lower sec.) 0.19 0.39 0 1 0.20 0.18 Education: high (higher vocational or university degree) 0.37 0.48 0 1 0.36 0.39 Married 0.77 0.42 0 1 0.78 0.76 Household income (per month in £) 3,328 2,003 0 72,927 3,299 3,359 Wage (per month in £, net) 1,335 1,334 0 71,059 877 1,824 Full-time (≥30 h per week) 0.62 0.48 0 1 0.42 0.83 Part-time (<30 h per week) 0.16 0.37 0 1 0.30 0.02 Overtime (in hours) 3.1 5.7 0 75 10.9 4.3 Partner: full-time 0.62 0.48 0 1 0.79 0.43 Partner: part-time 0.16 0.36 0 1 0.03 0.30 Sex: female 0.51 0.50 0 1
Note: N = 50,400 person-years.1Measures range from 1 (not satisfied at all) to 7 (completely satisfied).2At most once or twice a month (dichotomized 5-point scale).
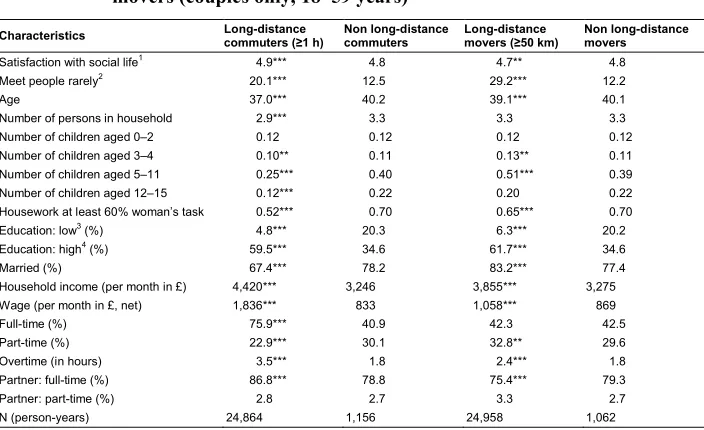
Female and male long-distance commuters and movers have important differences relative to nonmobile respondents (Tables 2a and 2b). The share of respondents who rarely meet people is significantly higher among spatially mobile men and women. The mobile respondents are usually less satisfied with their social lives. Surprisingly, women who commute long distances are generally more satisfied with their social life than other women. This result may be because commuter women live in smaller households (with fewer children) and are less involved in household work. Female long-distance commuters also exhibit higher work participation, which also might present opportunities for social contacts. In particular they are more likely to be employed full-time (75.9%) than other women, which also results in a higher average personal wage (1,836£ compared to 833£ among non-commuters). Women who commute long distances also have a higher average household income because their partners are more often employed full-time too. Long-distance commuting women are more likely to be higher educated (59.5%) than nonmobile women (34.6%) and they are rarely lower educated (4.8%). Female long-distance commuters tend to be younger and single. This matches microeconomic explanations of spatial mobility, which emphasize that regional mobility is most profitable for young, highly educated individuals with high earning potential. These results indicate that it is unlikely for women to become commuters (especially if they have stable relationships and children). But for those that do, spatial mobility may be associated with an economically and socially favorable life situation.
Table 2a: Characteristics of female long-distance commuters and long-distance movers (couples only, 18–59 years)
Characteristics Long-distance
commuters (≥1 h)
Non long-distance commuters
Long-distance movers (≥50 km)
Non long-distance movers
Satisfaction with social life1 4.9*** 4.8 4.7** 4.8 Meet people rarely2 20.1*** 12.5 29.2*** 12.2 Age 37.0*** 40.2 39.1*** 40.1 Number of persons in household 2.9*** 3.3 3.3 3.3 Number of children aged 0–2 0.12 0.12 0.12 0.12 Number of children aged 3–4 0.10** 0.11 0.13** 0.11 Number of children aged 5–11 0.25*** 0.40 0.51*** 0.39 Number of children aged 12–15 0.12*** 0.22 0.20 0.22 Housework at least 60% woman’s task 0.52*** 0.70 0.65*** 0.70 Education: low3 (%) 4.8*** 20.3 6.3*** 20.2 Education: high4 (%) 59.5*** 34.6 61.7*** 34.6 Married (%) 67.4*** 78.2 83.2*** 77.4 Household income (per month in £) 4,420*** 3,246 3,855*** 3,275 Wage (per month in £, net) 1,836*** 833 1,058*** 869 Full-time (%) 75.9*** 40.9 42.3 42.5 Part-time (%) 22.9*** 30.1 32.8** 29.6 Overtime (in hours) 3.5*** 1.8 2.4*** 1.8 Partner: full-time (%) 86.8*** 78.8 75.4*** 79.3 Partner: part-time (%) 2.8 2.7 3.3 2.7 N (person-years) 24,864 1,156 24,958 1,062
Note: N = 26,020 person-years. Mean values if not displayed in another way.1Measures range from 1 (not satisfied at all) to 7 (completely satisfied).2At most once or twice a month (dichotomized 5-point scale).3Primary or lower secondary.4Higher vocational or university degree. Chi-square and t-tests of differences between mobile persons and their nonmobile counterparts with significance levels: *** p < 0.01, ** p < 0.05.
Source: BHPS 1997–2008.
Table 2b: Characteristics of male long-distance commuters and long-distance movers (couples only, 18–59 years)
Characteristics Long-distance
commuters (≥1 h)
Non long-distance commuters
Long-distance movers (≥50 km)
Non long-distance movers
Satisfaction with social life1 4.7*** 4.8 4.6*** 4.8 Meet people rarely2 22.5*** 17.4 35.9*** 17.2 Age 40.4*** 41.0 40.0*** 41.0 Number of persons in household 3.2*** 3.3 3.2** 3.3 Number of children aged 0–2 0.13 0.13 0.13 0.13 Number of children aged 3–4 0.12 0.12 0.14*** 0.12 Number of children aged 5–11 0.38** 0.42 0.50*** 0.41 Number of children aged 12–15 0.19*** 0.23 0.17*** 0.28 Housework at least 60% woman’s task 0.72*** 0.69 0.62*** 0.70 Education: low3 (%) 8.0*** 19.0 7.7*** 18.4 Education: high4 (%) 56.4*** 36.9 65.4*** 37.6 Married (%) 76.2 76.3 77.2 76.2 Household income (per month in £) 4,370*** 3,254 3,949*** 3,333 Wage (per month in £, net) 2,729*** 1,730 2,255*** 1,805 Full-time (%) 96.9*** 81.2 78.3*** 82.9 Part-time (%) 1.7** 2.5 3.5** 2.4 Overtime (in hours) 5.6*** 4.2 4.5 4.3 Partner: full-time (%) 47.8*** 42.8 45.5 43.2 Partner: part-time (%) 31.4 29.9 31.9 30.0 N (person-years) 22,090 2,290 23,361 1,019
Note: N = 24,380 person-years. Mean values if not displayed in another way.1Measures range from 1 (not satisfied at all) to 7 (completely satisfied).2At most once or twice a month (dichotomized 5-point scale).3Primary or lower secondary.4Higher vocational or university degree. Chi-square and t-tests of differences between mobile persons and their nonmobile counterparts with significance levels: *** p < 0.01, ** p < 0.05.
Source: BHPS 1997–2008.
4. Effects of commuting and relocation on individual satisfaction
with social life
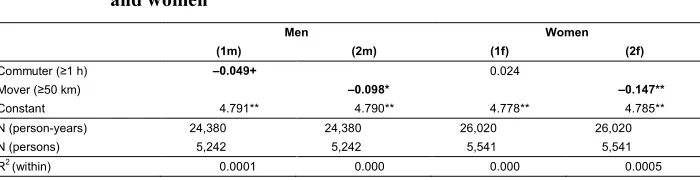
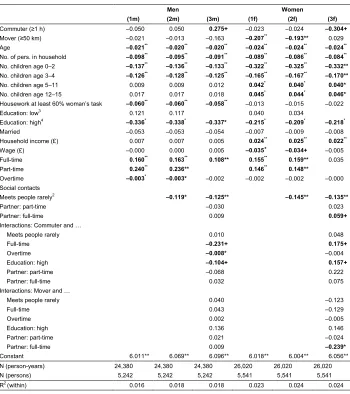
Tables 3a and 3b show the effects of spatial mobility on individual satisfaction with one’s social life (i.e., the subjective view of social integration) based on fixed-effects (FE) panel regression models. FE models identify effects based on changes of the independent and dependent variables, which occur within one person during the observational window (within-effect), and, this way, control for time-constant unobserved heterogeneity (Allison 2009). We focus on the subjective view of social integration because it reflects the perceived quality of relationships. In the bivariate models without controls (Table 3a) we observe a general significant negative effect of long-distance commuting and moving for men in line with our theoretical expectations; for women, the overall negative effect of moving is even stronger than for men. However, commuting does not impact women’s social relationships negatively, which matches the findings from the descriptive statistics and points to the relevance of workplace contacts for women. When adding further control variables in the multiple regression model (Table 3b), both men and women who are long-distance commuters or long-distance movers still tend to be less satisfied with their social life, but this finding is significant for female long-distance movers only (Model 1). In Model 2 and 3 (Table 3b) also the frequency of meeting other people outside the household is included as a control variable in order to separate mobility-induced structural changes in social networks from the perceived quality of social contacts. Model 2 shows that, for both men and women, meeting people outside the household rarely is associated with a significantly decreased satisfaction with social life. But the negative impact of long-distance moves on women’s satisfaction barely changes when the variable ‘meeting people rarely’ is added, which means that for them satisfaction with their social life is only weakly dependent on the frequency of meeting people.
Table 3a: Fixed-effects regressions on the satisfaction1 with social life for men
and women
Men Women
(1m) (2m) (1f) (2f)
Commuter (≥1 h) –0.049+ 0.024
Mover (≥50 km) –0.098* –0.147**
Constant 4.791** 4.790** 4.778** 4.785** N (person-years) 24,380 24,380 26,020 26,020 N (persons) 5,242 5,242 5,541 5,541 R2(within) 0.0001 0.000 0.000 0.0005
Table 3b: Fixed-effects regressions on the satisfaction1 with social life for men
and women
Men Women
(1m) (2m) (3m) (1f) (2f) (3f)
Commuter (≥1 h) –0.050 0.050 0.275+ –0.023 –0.024 –0.304+
Mover (≥50 km) –0.021 –0.013 –0.163 –0.207** –0.193** 0.029
Age –0.021** –0.020** –0.020** –0.024** –0.024** –0.024**
No. of pers. in household –0.098** –0.095** –0.091** –0.089** –0.086** –0.084**
No. children age 0–2 –0.137** –0.136** –0.133** –0.322** –0.325** –0.332**
No. children age 3–4 –0.126** –0.128** –0.125** –0.165** –0.167** –0.170**
No. children age 5–11 0.009 0.009 0.012 0.042* 0.040* 0.040*
No. children age 12–15 0.017 0.017 0.018 0.045* 0.044* 0.046*
Housework at least 60% woman’s task –0.060** –0.060** –0.058** –0.013 –0.015 –0.022
Education: low3 0.121 0.117 0.040 0.034
Education: high4 –0.336* –0.338* –0.337* –0.215* –0.209* –0.218*
Married –0.053 –0.053 –0.054 –0.007 –0.009 –0.008 Household income (£) 0.007 0.007 0.005 0.024** 0.025** 0.022**
Wage (£) –0.000 0.000 0.005 –0.035+ –0.034+ –0.005
Full-time 0.160** 0.163** 0.108** 0.155** 0.159** 0.035
Part-time 0.240** 0.236** 0.146** 0.148**
Overtime –0.003* –0.003* –0.002 –0.002 –0.002 –0.000
Social contacts
Meets people rarely2 –0.119* –0.125** –0.145** –0.135** Partner: part-time –0.030 0.023 Partner: full-time 0.009 0.059+
Interactions: Commuter and …
Meets people rarely 0.010 0.048
Full-time –0.231+ 0.175+
Overtime –0.008* –0.004
Education: high –0.104+ 0.157+
Partner: part-time –0.068 0.222 Partner: full-time 0.032 0.075 Interactions: Mover and …
Meets people rarely 0.040 –0.123
Full-time 0.043 –0.129
Overtime 0.002 –0.005
Education: high 0.136 0.146
Partner: part-time 0.021 –0.024 Partner: full-time 0.009 –0.239*
Constant 6.011** 6.069** 6.096** 6.018** 6.004** 6.056** N (person-years) 24,380 24,380 24,380 26,020 26,020 26,020 N (persons) 5,242 5,242 5,242 5,541 5,541 5,541 R2(within) 0.016 0.018 0.018 0.023 0.024 0.024
Note: Couples, aged 18–59 years.1Measures range from 1 (not satisfied at all) to 7 (completely satisfied).2At most once or twice a month (dichotomized 5-point scale).3Primary or lower secondary.4Higher vocational or university degree.+p < 0.10,*p < 0.05,**p < 0.01; significant effects in bold.
Other predictor effects are similar for men and women: Satisfaction with social life decreases with age, household size, and having small children up to 5 years old in the household. When the children reach school age, this negative impact disappears for men and becomes positive for women. This finding suggests that as children become independent, the degree of freedom for establishing personally rewarding relationships – that is, relationships not driven by social support of small children – also grow especially for women (see, e.g., Munch, Miller McPherson, and Smith-Lovin 1997). Interestingly, a traditional labor division of household duties exclusively and significantly decreases men’s social life satisfaction. Working full-time or part-time increases the satisfaction with one’s social life for both men and women, but working overtime decreases satisfaction significantly only for men. Having tertiary education decreases the satisfaction with one’s social life for both men and women, and this might reflect the impact of occupational status and work obligations on social relationships. For women, household income has a positive effect on the satisfaction with one’s social life, but a high individual income tends to decrease satisfaction.
In the models with interactions (Models 3f and 3m in Table 3b), the coefficients of the interaction terms capture the effect of commuting and moving for different levels of the interacted variables. Interactions of mobility with meeting people as well as with work characteristics (Model 3f in Table 3b) reveal that female long-distance commuters are significantly less satisfied with their social life (even though frequency of meeting people is controlled), in particular if they have low educational levels and if they work part-time (see main effect for long commuters in Model 3f). Whereas, for highly educated and work-oriented commuter women the effect is less negative (see positive interaction coefficients). Thus, the decision to commute might have been a strategy to avoid moves and preserve their social life at the home destination. Among long-distance movers, women are especially unsatisfied with their social life if they have moved with a full-time employed partner.
For men, the estimated interaction effects are different (Model 3m in Table 3b). While long-distance moves have no effect on men’s satisfaction with their social life, long-distance commutes exert positive net effects as long as men have enough free time to meet other people. In combination with being highly educated and working full-time, long commutes tend to diminish individual satisfaction with men’s social life. In particular working overtime exerts a negative effect. Interactions with mobility, having children, or labor division in the households does not affect women’s and men’s satisfaction with their social life (data not shown).
References
Allison, P. (2009). Fixed Effects Regression Models. Thousand Oaks: Sage
Publications.
Belot, M. and Ermisch, J. (2006). Friendship ties and geographic mobility, evidence from the BHPS. Colchester: Department of Economics, University of Essex (ISER Working Paper 2006-33).
Boyle, P., Cooke, T.J., Halfacree, K., and Smith, D. (2001). A cross-national comparison of the impact of family migration on women’s employment status.
Demography38(2): 201–213.doi:10.1353/dem.2001.0012.
Bracke, P., Christiaens, W., and Wauterickx, N. (2008). The pivotal role of women in
informal care. Journal of Family Issues 29(10): 1348–1378. doi:10.1177/
0192513X08316115.
Cohen, S. (2004). Social relationships and health. American Psychologist 59(8): 676–
684.doi:10.1037/0003-066X.59.8.676.
Cohen, S. and Wills, T.A. (1985). Stress, social support, and the buffering hypothesis. Psychological Bulletin 98(2): 310–357.doi:10.1037/0033-2909.98.2.310. Cooke, T.J. (2003). Family migration and the relative earnings of husbands and wives.
Annals of the Association of American Geographers 93(2): 338–349.
doi:10.1111/1467-8306.9302005.
Cooke, T.J. (2008). Migration in a family way. Population, Space and Place 14(4):
255–265.doi:10.1002/psp.500.
Cooke, T.J. (2013). Internal migration in decline. The Professional Geographer 65(4):
664–675.doi:10.1080/00330124.2012.724343.
DeMeester, E., Mulder, C., and Fortuijn, J. (2007). Time spent in paid work by women
and men in urban and less urban contexts in the Netherlands. Tijdschrift voor
economische en sociale geografie 98(5): 585–602.
doi:10.1111/j.1467-9663.2007.00427.x.
Doucet, A. (2000). ‘There’s a huge gulf between me as a male carer and women’: Gender, domestic responsibility, and the community as an institutional arena.
Community, Work and Family 3(2): 163–184.doi:10.1080/713658907.
Feeney, B.C. and Collins, N.L. (2015). A new look at social support: A theoretical
Fernandez, R.M. and Su, C. (2004). Space in the study of labor markets.Annual Review of Sociology30: 545−569.doi:10.1146/annurev.soc.29.010202.100034.
Folkman, S. and Moskowitz, J.T. (2000). Stress, positive emotion, and coping.Current
Directions in Psychological Science 9(4): 115–118. doi:10.1111/1467-8721. 00073.
Hochschild, A.R. (1997).The time bind: When home becomes work and work becomes
home. New York: Henry Holt.
Jacobsen, J.P. and Levin, L.M. (1997). Marriage and migration: Comparing gains and
losses from migration for couples and singles. Social Science Quarterly 78(3):
688–709.
Jacobsen, J.P. and Levin, L.M. (2000). The effects of internal migration on the relative
economic status of women and men. The Journal of Socio-Economics 29(3):
291–304.doi:10.1016/S1053-5357(00)00075-5.
Mincer, J. (1978). Family migration decisions. Journal of Political Economy 86(5):
749–773.doi:10.1086/260710.
Moore, G. (1990). Structural determinants of men’s and women’s personal networks.
American Sociological Review 55(5): 726–735.doi:10.2307/2095868.
Munch, A., Miller McPherson, J., and Smith-Lovin, L. (1997). Gender, children, and
social contact: The effects of childrearing for men and women. American
Sociological Review 62(4): 509–520.doi:10.2307/2657423.
Nisic, N. (2009). Labour market outcomes of spatially mobile coupled women: Why is
the locational context important? Schmollers Jahrbuch 129(2): 203–215.
doi:10.3790/schm.129.2.203.
Nisic, N. (2017). Smaller differences in bigger cities? Assessing the regional dimension
of the gender wage gap. European Sociological Review 33(2): 292–304.
doi:10.1093/esr/jcx037.
Nisic, N. and Abraham, M. (2014). Familie und Mobilität. In: Hill, P.B. and Kopp, J.
(eds.).Handbuch Familiensoziologie. Wiesbaden: Springer: 675–708.
Nisic, N. and Petermann, S. (2013). New city = New friends? The restructuring of
social resources after relocation. Comparative Population Studies 38(1): 199–
Nivalainen, S. (2004). Determinants of family migration: Short moves vs. long moves.
Journal of Population Economics 17(1): 157–175.
doi:10.1007/s00148-003-0131-8.
Pratt, G. and Hanson, S. (1991). Time, space, and the occupational segregation of
women: A critique of human capital theory. Geoforum 22(2): 149–157.
doi:10.1016/0016-7185(91)90004-A.
Rapino, M.A. and Cooke, T.J. (2011). Commuting, gender roles, and entrapment: A
national study utilizing spatial fixed effects and control groups.The Professional
Geographer 63(2): 277–294.doi:10.1080/00330124.2010.547790.
Seery, B.L. and Crowley, M.S. (2000). Women’s emotion work in the family: Relationship management and the process of building father-child relationships.
Journal of Family Issues 21(1): 100–127.doi:10.1177/019251300021001005.
Shauman, K.A. and Noonan, M.C. (2007). Family migration and labor force outcomes:
Sex differences in occupational context. Social Forces 85(4): 1735–1764.
doi:10.1353/sof.2007.0079.
Singell, L.D. and Lillydahl, J.H. (1986). An empirical analysis of the commute to work
patterns of males and females in two-earner households. Urban Studies 23(2):
119−129.doi:10.1080/00420988620080111.
Smits, J. (2001). Career migration, self-selection and the earnings of married men and
women in the Netherlands, 1981–93. Urban Studies 38(3): 541–562.
doi:10.1080/00420980120080091.
Smits, J., Mulder, C.H., and Hooimeijer, P. (2004). Migration of couples with non
-employed and -employed wives in the Netherlands: the changing effects of the
partners’ characteristics. Journal of Ethnic and Migration Studies 30(2): 283–
301.doi:10.1080/1369183042000200704.
Tenn, S. (2010). The relative importance of the husband’s and wife’s characteristics in
family migration, 1960–2000. Journal of Population Economics 23(4): 1319–
1337.doi:10.1007/s00148-009-0253-8.
Van Emmerik, I.J.H. (2006). Gender differences in the creation of different types of
social capital: A multilevel study. Social Networks 28(1): 24–37.