VOLUME 41, ARTICLE 1, PAGES 1
-
36
PUBLISHED 2 JULY 2019
https://www.demographic-research.org/Volumes/Vol41/1/ DOI: 10.4054/DemRes.2019.41.1
Research Article
On the multifaceted impact of migration on the
fertility of receiving countries: Methodological
insights and contemporary evidence for Europe,
the United States, and Australia
Christos Bagavos
© 2019 Christos Bagavos.
This open-access work is published under the terms of the Creative Commons Attribution 3.0 Germany (CC BY 3.0 DE), which permits use, reproduction, and distribution in any medium, provided the original author(s) and source are given credit.
1 Introduction 2
2 Data and methods 4
2.1 Data on births and population by migration status 4 2.2 Methodological insights for assessing the impact of foreign-born or
noncitizens on childbearing in the host countries 7 2.2.1 Estimation of the contribution of foreign-born or noncitizens to the
TFR of the total population in a single year
7 2.2.2 Decomposing the contribution of foreign-born or noncitizens to
changes in the TFR and in the total number of births between two years: Changes in fertility vs. changes in population
11
3 Results 16
4 Conclusions and discussion 24
5 Acknowledgments 27
References 28
On the multifaceted impact of migration on the fertility of
receiving countries: Methodological insights and contemporary
evidence for Europe, the United States, and Australia
Christos Bagavos1
Abstract
BACKGROUND
Within the context of increasing migration flows and persisting low fertility rates in more developed areas, focus has been placed on the impact of migration on the fertility of receiving countries.
OBJECTIVE
The paper examines the effect of migration on the fertility of selected European countries, the United States, and Australia for the 2009–2015 period.
METHODS
We provide methodological insights and evidence derived from comparisons of estimates of age-specific fertility rates (ASFRs) and total fertility rates (TFRs) of native-born or foreign-born women, or female citizens or noncitizens.
RESULTS
The results show that although the United States and Australia are seen as model countries of migration, the contribution of migrants to the levels and trends in the TFR and in the total number of births in these countries seems to be less significant than in some European countries. Our results also show that differences in the overall TFRs of the United States and selected European countries are driven more by the differences in the TFRs of native-born women than by the net effect of migration.
CONCLUSIONS
Our study suggests that the impact of migration on fertility is a multifaceted issue, going far beyond the commonly used net effect of migration on increases in a country’s TFR.
1. Introduction
The impact of migration on a population’s size and age composition is well understood (e.g., Alho 2008; Espenshade 1986, 1994; Murphy 2016). Among the related questions that have been less explored are how much migrants contribute to birth rates and childbearing trends and the extent to which migration accounts for the differences in the overall levels of fertility of the receiving countries. There are several possible explanations for the limited interest that has thus far been shown in these issues, including the lack of reliable data that would allow researchers to perform robust estimations and comparative analysis, the differences in the proxies typically used for migrants on the two sides of the Atlantic and Australia, and the ambiguity about the meaning and appropriate assessment of the fertility contribution of migration.
In this paper, we aim to investigate certain aspects of the contributions of migrants to fertility in selected European countries, the United States, and Australia2 that have
thus far been little explored by providing methodological insights and coherent evidence in a comparative perspective for the 2009–2015 period. Such an analysis has only recently become feasible with the publication by Eurostat of harmonized data on the country of birth or citizenship of mothers and women, which allows us to estimate period TFRs for foreign-born and native-born (or citizen and noncitizen) women in certain European countries from the late 2000s onward (Eurostat 2017a, 2017b, 2017c, 2017d; Lanzieri 2013a). Furthermore, combining survey and population data from the existing US data sources – namely, vital statistics issued by the National Center for Health Statistics (NCHS; Martin et al. 2017), population estimates (US Census Bureau 2017a, 2017b), and survey data, particularly from the American Community Survey (ACS; US Census Bureau 2017c) – allows us to use for the United States a definition of migrants that is as close as possible to the definition used in European countries and thus provides reliable and consistent estimations of TFRs by migration status for selected European countries and the United States.
In this paper, we highlight the multifaceted role of migrant women and their fertility for the TFR and the total number of births of the host countries. We also investigate whether differences in the overall TFRs of European countries, the United States, and Australia can be attributed to the uneven impact of migrants on countries’ period fertility. In particular for European countries and the United States, this aspect was raised at the beginning of the 2000s (Farnsworth Riche 2000; PAA 2002), but it has yet to be investigated. In addition, we use a mixed standardization and decomposition approach to determine to what extent trends over time in the overall TFR and in the total number of births are driven by changes in the fertility levels of migrants or nonmigrants, by shifts in population composition, or even by interactions between these trends.
In this study, we generally use the terms migrant (e.g., women) and migrants and contrast these individuals with people we define as nonmigrant and nonmigrants. However, since an individual’s country of birth is most often used to identify her migration status, we also contrast individuals who are foreign-born with those who are native-born. We also use a woman’s citizenship as a migration indicator (a noncitizen vs. citizen) for some European countries for which data on country of birth is not available for the whole period under study. Furthermore, to ensure comparability
between European countries and the United States, a woman’s country of birth or citizenship is used as a proxy for her migration status in the latter.
Our choice of the countries under consideration was based on their experiences as receiving countries as well as on data availability for each year over the period of the recent economic recession, or 2009–2015. Thus, the United States, Australia, Switzerland, the United Kingdom, France, Belgium, the Netherlands, Germany, and Austria are analyzed as examples of long-standing destination countries with many settled migrants; Italy, Greece, and Spain are considered as examples of new host countries with many recent migrants; and Norway, Sweden, Denmark, and Finland are analyzed as examples of countries that have recently experienced significant levels of humanitarian migration (OECD 2015).
2. Data and methods
2.1 Data on births and population by migration status
We used two sets of data extracted from the Eurostat database to estimate period fertility indicators by migration status for selected European countries: (a) births by single age and country of birth or citizenship of the mother (Eurostat 2017a, 2017b) and (b) the average female population by single age and country of birth or citizenship, estimated as the half-sum of the corresponding figures as of January 1 of each year (Eurostat 2017c, 2017d). With this information, it is possible to compute the age-specific fertility rates (ASFRs) and the TFRs of all women, as well as of women based on whether they are foreign-born, noncitizens, native-born, or citizens. Given that data for France on births, either by mother’s country of birth or citizenship, is not available in the Eurostat database for 2009–2012, we have proceeded with some additional estimations. First, we estimated the ratio of the share by age of births to foreign-born mothers to the share of total births to foreign-born mothers for the period 2013–2015. Given that those ratios were almost unchanged from one year to another, we retained the figures for 2013. Then, on the basis of those ratios and data on total births to foreign- and native-born women for the 2009–2012 period provided by the Institut national de la statistique et des études économiques (INSEE 2019), on births to all women by age (Eurostat 2019a), and on total births of all women (INSEE 2019; Eurostat 2019a), we estimated the number of births to foreign-born mothers by age. We applied the same procedure for the native-born mothers.3
Computing fertility indicators by country of birth or citizenship for the United States has been more challenging. The most significant problem we faced was that the US Census Bureau does not provide annual population estimates by either nativity status (i.e., whether a person is native- or foreign-born) or citizenship (whether a person is a citizen or noncitizen).4 We also encountered problems in accessing data on births in
the US. The NCHS, which provides data on vital statistics, does not collect information on the citizenship of the mother. In addition, for the years 2009 to 2013, the item on a mother’s country of birth is available in the territory files but not in the US Public Use Natality Files. Moreover, in the 2014 and 2015 US files, the term mother’s nativity exclusively refers to mothers who were born in the 50 states of the United States (NCHS 2017).
We have dealt with these problems by using data on births and population (US Census Bureau 2017c) from the 2009 to 2015 single-year ACS. First, mothers and women were classified according to their country of birth or citizenship on the basis of the citizenship status variable, which allows us to determine whether a woman or a mother was (1) born in the United States; (2) born in Puerto Rico, Guam, the US Virgin Islands, or the Northern Marianas; (3) born abroad to American parent(s); (4) a US citizen by naturalization; or (5) not a citizen of the United States. To ensure that this data is compatible with the European data, our group of native-born women and mothers includes only those born in the United States (i.e., in the 50 states or the District of Columbia), while the remainder of the women are classified as foreign-born. The noncitizen population includes all women who are not US citizens (legal permanent residents, temporary migrants, humanitarian migrants, and unauthorized migrants), while the citizen population includes all other women.
In line with other studies (Livingston and Cohn 2012; US Census Bureau 2014), we weighted the ACS data on the female native-born population on the basis of the population intercensal estimates for 2009 (US Census Bureau 2017a) and of the Vintage 2016 population estimates for 2010 to 2015 (US Census Bureau 2017b) to reflect the annual estimates of the resident population of native-born women aged between 15 and 49 by five-year age groups. The native-born population was then subtracted from the Vintage 2016 estimate to obtain the foreign-born population.
A two-stage procedure was used to estimate the number of births to native-born mothers. First, the proportions of births to native-born women within five-year age groups from the 2009–2015 ACS data were applied to the births to all mothers provided by the NCHS (Martin et al. 2017) to create the number and the five-year age patterns of
the births to native-born mothers. Second, the computed five-year age pattern was applied to the total number of births to native-born mothers (born in the 50 states or the District of Columbia), as calculated by the NCHS and provided by Livingston (2016) and Livingston and Cohn (2012), to obtain the number of births to native-born women by five-year age groups for 2009 to 2015.5 The births to nonresident mothers (i.e., to
mothers whose reported state of residence was not one of the 50 states or the District of Columbia) were excluded from the estimations. In addition, given the problem reported by the US Census Bureau for the fertility variable in the 2012 ACS (US Census Bureau 2012), data from that particular year was not used for our analysis.
On the basis of the estimated population and births, age-specific fertility rates by five-year age groups and period TFRs for native-born women aged 15 to 49 were computed for 2009 to 2015. As for the foreign-born women, the age-specific fertility rates and the resulting TFRs were estimated on the basis of the age-specific fertility rates of all women (Martin et al. 2017) and of native-born women, as well as of the percentages of the native-born and the foreign-born women among all women of a given age.6,7,8
We applied the procedure used to estimate the fertility rates for native- and foreign-born women to estimate births, population, and fertility indicators by citizenship.9
As far as Australia is concerned, the analysis is based on data and figures provided by the Australian Bureau of Statistics (ABS): in particular, (a) the estimations relative to the TFRs of foreign- and native-born women (ABS 2018a) and (b) the resident population by country of birth (ABS 2018b).
5 The percentage of births to native-born mothers in 2014 was used to estimate the total number of births to those mothers in 2015.
6 In fact, the age-specific fertility rates of all women at every given age is equal to (SI xFI) + (SN xFN), where FIandFNare the age-specific fertility rates of native-born and foreign-born women, respectively; and SIand SNare their percentages in the population at every given age, respectively (see also Equation 16 in the next session).
7 Alternatively, fertility indicators to born women could be estimated on the basis of births to foreign-born mothers – computed by subtracting births to native-foreign-born mothers from births to all mothers – and of the foreign-born population.
8 In order to check our estimations, we have computed TFRs for native- and foreign-born women on the basis of the same definitions as those used in the US Census Bureau for the base year 2014 of the population projections for 2014–2060 (US Census Bureau 2014). Our computed TFRs of 1.72 for native-born women and of 2.58 for foreign-born women in 2014 are similar to US Census estimates of 1.71 and 2.59, respectively (Colby and Ortman 2015a).
2.2 Methodological insights for assessing the impact of foreign-born or noncitizens on childbearing in the host countries
2.2.1 Estimation of the contribution of foreign-born or noncitizens to the TFR of the total population in a single year
Let f be the age-specific fertility rates; I and N indicate migrants and nonmigrants, respectively;B express births;P refer to population;S refer to the share of (migrant or nonmigrant) women; andx signify the age of the individuals.
Then, the total contribution or the total effect of the migrant population and migrant fertility on a country’s TFR ( ) in a single year can be expressed, in absolute terms, as the sum across ages of the product of the share of migrant women
( ) multiplied by their age-specific fertility rates ( ) at every given age, or, alternatively, as the sum across ages of the ratio of the number of migrant births( ) to the total population( ) at every given age:
=∑ = ∑ = ∑ (1). Thus, the relative total effect of migration on the overall level of TFR is
= ∑
∑ ≈ ∑ (2),
which is quite close to the proportion of births to foreign-born or noncitizen women in the total number of births.
Moreover, the relative total effect of migration on the ASFR of the total population at agex is
= = (3),
which corresponds to the proportion of births to migrant women at agex.
Accordingly, in a situation with migration, the absolute total effect of the native-born (or citizen) population and native-native-born (or citizen) fertility on the TFR of the total population is given by
We suggest that the total effect of the migrant population and migrant fertility on the TFR of a host country can be broken down into two separate effects. The first effect, which is cited frequently in demographic literature (Basten, Sobotka, and Zeman 2013; Goldstein, Sobotka, and Jasilioniene 2009; Héran and Pison 2007; Sobotka 2008), is the so-called net effect of migration on the overall TFR (Goldstein, Sobotka, and Jasilioniene 2009; Sobotka 2008). Given that the TFR of foreign-born (or noncitizen) women usually exceeds that of native-born (or citizen) women, the net (positive) effect, estimated as the difference in the overall TFR with and without migration (i.e., the difference between the TFR of all and of native-born or citizen women), expresses the contribution of migration to the increase in the country’s TFR in a single year.
The second effect is the neutral effect of migration on the TFR of the receiving country. This effect results from the fact that when migrants are present, the contribution of nonmigrants to their country’s overall TFR is lower than the nonmigrants’ own TFR simply because they account for less than 100% of the total population of reproductive ages. Meanwhile, the migrant population and migrant fertility initially contribute to the overall TFR up to a level that is equal to the TFR of the country without migration (i.e., the TFR of the nonmigrant women) and later boost the country’s TFR through the aforementioned net effect.
The neutral effect is frequently neglected by demographers since it does not modify the TFR of the total population beyond the level of the nonmigrants’ TFR. Although this effect is neutral in terms of its influence on the overall TFR, it is far from neutral in terms of its influence on births or, as will be shown below, in terms of its influence on the trends in the TFR of the receiving country.
The net effect and the neutral effect on the TFR of the total population can be formulated as follows:
=∑ = ∑ [( )– ( ) + ( )] =
= ∑ [ ( – )] + ∑ (5). The first component of Equation 5 reflects the net effect in absolute terms:
∑ [ ( – )] = ∑ [ − ] =∑ [ − ]
=∑ [ − ] =∑ [ − − ]
=∑ [ − (1 + )] =∑ [ − ( )]
which in relative terms is given by
(7). We note that the net effect depends on differentials in age patterns of fertility, particularly the higher fertility of foreign-born or noncitizen women relative to that of native-born or citizen women, and the shares by age of foreign-born or citizen women. It is easily estimated as the difference between the TFRs of the total and the nonmigrants populations.
The net effect is usually of rather limited importance (Sobotka et al. 2015; Toulemon, Pailhé, and Rossier 2008) because it constitutes only part of the excess fertility of migrant women relative to that of nonmigrant women. This proportion can be easily estimated in terms of TFRs (i.e., for the overall age group 15 to 49) by the ratio of the net effect to the excess of the TFR of foreign-born or noncitizen women over the TFR of native-born or citizen women:
(8).
This expresses how much of the excess fertility of migrant women relative to that of nonmigrant women is added to the TFR of the total population by increasing its level; it is very close but not necessarily equal to the real share of foreign-born or noncitizen women for the entire 15 to 49 age group. It should be noted that the above proportion is not simply a population share, as it summarizes the differences in the population shares and fertility age patterns of migrants and nonmigrants. Let us call this proportion the net share of excess fertility. The findings on this share are presented below in the results section.
The second component of Equation 5 refers to the neutral effect of migration on the overall level of TFR, which is given by the sum of the migrants’ total effect on the country’s TFR plus the nonmigrants’ TFR minus the overall level of the country’s TFR: ∑ = − net effect = + − (9). To clarify the impact of the migrant population and fertility on the TFR of the total population and on the total number of births, we present the net effect, the excess fertility of migrant women relative to that of nonmigrant women, and the neutral effect in terms of births. The number of births implying the net effect is
The number of births corresponding to the excess of migrant fertility over nonmigrant fertility is
∑ ( − ) = ∑ ( − ) (11), and the number of births related to the neutral effect is
∑ = ∑ (12). Equations 10–12 indicate that the number of births to foreign-born or noncitizen women associated with a neutral effect on the TFR of the total population is significantly higher than the number of births related to the excess of the fertility of foreign-born or noncitizen women over that of native-born or citizen women or to the number of births to foreign-born or noncitizens that would lead to an increase in the TFR of the total population (net effect). In other words, despite the upturn in the total number of births caused by births to migrants, the impact on the overall TFR is much smaller than would have been expected by the rising number of total births because the largest part of the births to migrants simply serves to maintain the country’s TFR at its level without migration.
A final point worth noting is that in a situation in which migration is occurring, differences in the shares of migrant and nonmigrant women determine the proportion of the TFRs of migrants and nonmigrants that will be added to the overall TFRs. This proportion, which we may call the fertility coefficient, can be easily estimated for the whole 15 to 49 age group by the total effect of foreign-born or noncitizens (equally native-born or citizens) on the country’s TFR divided by their corresponding TFR:
= (13)
and
= (14).
Consequently, the TFR of the total population can be expressed as
The fertility coefficient is quite close, but not necessarily equal, to the real shares of migrant and nonmigrant women of the whole 15 to 49 age group. In addition, the fertility coefficients of the two groups do not necessarily sum to 100%.
2.2.2 Decomposing the contribution of foreign-born or noncitizens to changes in the TFR and in the total number of births between two years: Changes in fertility vs. changes in population
Since Kitagawa’s (1955) work, decomposition and standardization analyses of the components of trends in fertility have been widely used in demography (e.g., Canudas Romo 2003; Cho and Retherford 1973; Nisén et al. 2014). The most common standardization method consists of estimating the expected variation in fertility that would have resulted from the component under consideration if this component had remained constant over the period examined. It can then be inferred that the difference between the real and the expected variation in fertility reflects the impact of that component on changes in the TFR. A disadvantage of this approach is that it does not allow us to separate the impact of each component on trends in fertility from the impact due to interactions between components. In practice, the interaction effects may be important when three or more components are taken into consideration and when changes in these components are quite pronounced.
factor measuring the interaction effects between the main factors is estimated; this allows us to better assess the significance of every single factor.
Thus, given that the TFR of the total population is
= ∑ +∑ (16), then the decomposition of its change (∆) between two particular years (e.g., 2009 and 2015) is simply reflected by
∆( ) = ∑ ∆( ) +∑ ∆( ) (17) and
∆( ) = ∑ ∆( ) +∑ ∆( ) + ∑ ∆( ) ∆( )
+∑ ∆( ) +∑ ∆( )
+ ∑ ∆( ) ∆( ) (18). Note that in Equation 18, the rates and proportions refer to the initial year (i.e., to the year 2009), whereas their changes (∆) refer to those that occur between 2009 and 2015. This equation includes three distinct factors reflecting changes in the TFR of the total population and one factor reflecting the interaction effects.
Two factors are related to the impact of the shifts in the fertility of migrant and nonmigrant women (fertility effects) on the changes in the overall TFR. Specifically,
∑ ∆( ) (19)
is the fertility effect due to changes in the fertility of foreign-born or noncitizen women, and
∑ ∆( ) (20)
Second, the contribution of the fertility of migrants to the changes in the country’s TFR is expected to be less pronounced than that of the fertility of nonmigrants since the shares of migrants in the population are typically smaller than the shares of nonmigrants. In practice, if the fertility of migrants and nonmigrants had an equal effect on the shifts in the country’s TFR, the ratio of the changes in the TFR of migrants to the changes in the TFR of nonmigrants would have to have been equal to the ratio of the share of native-born to the share of migrant women in the 15 to 49 age group, or, alternatively, between the former and the ratio of the nonmigrant to the migrant women of reproductive ages. Nevertheless, this precondition is seldom fulfilled, even in the case of receiving countries where the shares of foreign-born or noncitizens of reproductive ages are high (around 25%). Indeed, for the fertility of migrants and nonmigrants to have contributed equally to the changes in the TFRs of those countries, a change in the migrant TFR that was four times that of the change in the nonmigrant TFR would have been required. Obviously, this observation helps to explain previous findings indicating that the fertility of nonmigrant women contributes more than the fertility of migrant women to trends in the TFR of the total population. The aforementioned precondition can, however, occur in a context of adverse socioeconomic circumstances, such as those that prevailed during the recent period of economic hardship.
The third factor, which is related to the population component, is obtained by summing the respective effects due to changes in shares of migrant and nonmigrant women, or
∑ ∆( ) +∑ ∆( ) (21). Given that in every given agex,
+ = 1 (22),
the above Equation 21 can be written as
∑ ( − ) ∆( ) (23),
relies not only on the changes in the shares of migrants between two particular years but also on the excess of migrant fertility over nonmigrant fertility in the initial year.
In addition, the interaction effect (i.e., the impact of simultaneous shifts in the fertility rates of nonmigrant and migrant women and in the shares of migrant women on changes in country’s TFR) is
∑ ∆( ) ∆( ) + ∑ ∆( ) ∆( ) (24), which, by taking into account Equation 22, can be expressed as
∑ {[∆( )− ∆( )] ∆( )} (25). A final significant point is that the contribution of migration to trends in the overall TFR, which is related to both the changes in the migrant population and in the fertility of migrants, is given by adding the migrants’ fertility effect and the population composition effect, like so:
∑ ∆( ) +∑ ( − ) ∆( ) (26). Let us now formulate the contribution of migration to trends in the total number of births. The total number of births in the host country is given by
= + =∑ +∑ (27). Then the decomposition of the change (∆) in the total number of births between 2009 and 2015 is
∆( ) = ∑ ∆( )+∑ ∆( ) (28)
and
∆( ) = ∑ ∆( ) +∑ ∆( ) + ∑ ∆( ) ∆( )
In line with our findings for trends in the country’s TFR, there are two factors related to the impact of the shifts in the fertility of migrant and nonmigrant women on the changes in the total number of births:
∑ ∆( ) (30)
is the fertility effect due to changes in the fertility of foreign-born or noncitizens, and
∑ ∆( ) (31)
is the fertility effect attributable to changes in the fertility of natives native-born or citizens.
The population component refers to changes in the numbers of migrant and nonmigrant women.10 These effects are given by
∑ ∆( ) (32)
and
∑ ∆( ) (33)
for migrants and nonmigrants, respectively.
Additionally, the interaction effects (i.e., the impact of simultaneous shifts in the fertility of nonmigrants and migrants and in the numbers of migrant and nonmigrant women on changes in the country’s total number of births) is estimated by
∑ ∆( ) ∆( ) + ∑ ∆( ) ∆( ) (34). Lastly, by considering the Equations 19, 20, 30, and 31 – which reflect the fertility component of the effect of foreign- and native-born women on changes in country’s TFR and in the total number of births respectively – we notice that the significance of migrant fertility, relative to that of nonmigrant fertility, is rather similar to whatever the trends in the overall fertility or in the total number of births are considered.
To simplify, we took the ratio of the fertility component of migrants to that of nonmigrants in regard to the shifts in fertility at a single agex (ratio of Equation 19 to Equation 20):
∆( )
∆( ) (35),
then
∆( )
∆( )
(36)
and
∆( )
∆( ) (37).
We notice that Equation 37 is equal to the ratio of the fertility component of migrants to that of nonmigrants regarding the changes in the total number of births (ratio of Equation 30 to Equation 31) at agex, which means that generally
∑ [ ∆( )]
∑ [ ∆( )] ≈
∑ [ ∆( )]
∑ [ ∆( )] (38).
In other words, the difference in the effect of migrants and nonmigrants on changes in the overall fertility or in the total number of births is not related to the fertility component but to the population component. In the case of shifts in the overall fertility, the population component is reflected by the shares of population, whereas for the total births it is reflected by the number of women.
3. Results
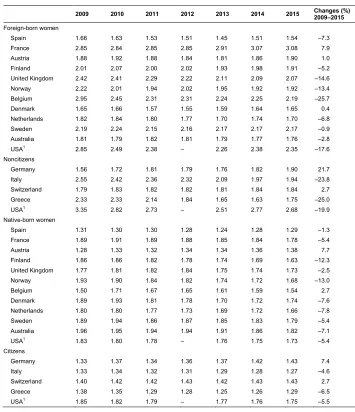
At the same time, the excess fertility of migrants relative to the fertility of nonmigrant women ranged from a negligible level of 2% in the Netherlands to 73% in France – a share that is twice as high in the United States (Table 1, column a). We also note the noticeable exceptions of Denmark and Australia, where the average fertility of native-born women excess was greater than that of foreign-born women by 5% and 3%, respectively.11 Geographical heterogeneity is also found in the shares of foreign-born
women in the population (Table 1, column b): In Switzerland, more than one in three women of reproductive age were born outside the country, compared to just one in ten in Finland.
Table 1: Indicators1 on the fertility contribution of foreign-born women to
selected European countries, the United States, and Australia, 2015
Excess fertility of foreign-born women relative to that of native-born women (%) Shares of foreign-born women aged 15 to49 in the total population of reproductive age (%) Foreign-born women’s net effect on countries’ TFRs (%) Foreign-born women’s total effect on countries’ TFRs (%)
Births induced a neutral effect of foreign-born women on the level of countries’ TFRs (as % of the total number of births to foreign-born women) Net share of excess fertility (%) Fertility coefficients of foreign-born women (%)
a b c d e f g
Spain 19 19 3 24 95 17 21
France 73 13 10 22 60 13 14
Austria 38 24 8 33 77 21 25
Finland 17 10 1 12 90 7 11
United Kingdom 20 20 4 26 85 22 23
Norway 14 21 3 28 91 18 25
Italy 41 16 5 23 82 13 17
Belgium 42 22 9 31 73 21 24
Denmark –5 17 –2 20 – – 21
Netherlands 2 17 0.3 20 98 14 19
Sweden 21 22 3 28 88 15 24
Switzerland 29 36 8 46 86 26 38
Greece 24 17 3 20 91 12 17
Australia –3 31 –1 34 – – 34
USA 36 19 6 23 74 18 18
Source: Own calculations.1 The Eurostat data allows for the estimation of fertility indicators for native- and foreign-born women for
2013 to 2015 for Italy and Greece and for 2015 for Switzerland but not Germany. In 2015, the TFR of foreign- and native-born women is estimated at 1.80 and 1.28, respectively, in Italy; at 1.59 and 1.29, respectively, in Greece; and at 1.85 and 1.43, respectively, in Switzerland.
All the abovementioned differences in fertility and population shares are reflected in the magnitude of the contribution of migration to the overall TFR. We provide below empirical evidence on certain aspects of this contribution, as well as on the impact of migration on the differences in the TFRs of countries in 2015. First, the (relative) net effect of foreign-born women on a country’s TFR ranged from a negative figure (–2%) in Denmark (Table 1, column c) to nonnegligible levels of 10% and 9% in France and Belgium, respectively, and of 8% in Austria and Switzerland. Second, the (relative) total effect of migration on the TFR of the host countries – or, alternatively, the percentage of births to migrants – varied between 12% in Finland and 46% in Switzerland (Table 1, column d). Third, without foreign-born migration, total period fertility – which in the absence of foreign-born women equals the natives’ TFR – would have reached lowest-low levels12 in Spain (1.29), Greece (1.29), and Italy (1.28) and
declined to well below replacement levels in France (1.78) (see Appendix Table A-1 and Note 1 in Table 1). Fourth, migration does not seem to be a significant determinant of the differences in the overall TFRs of countries. Indeed, when those differences are ‘decomposed’ into the sum of the differences in the TFRs of native women plus the differences in the net effects of foreign-born women (Table 2), we find that the differentials in the overall TFRs between the United States and countries such as Spain, Greece, Italy, Austria, and Switzerland are driven more by differences in the TFRs of native-born women than in the net effects of women born abroad. Obviously, we find similar results – which are not presented here in detail – when France is compared with the countries mentioned above. However, when the United States are compared to Australia, we notice that the effect of migration on the overall TFR in the United States contributes to equalize the United States’ with Australia’s TFR, and that this finding holds true throughout the 2009‒2015 period.
Table 2: Differences in the overall TFRs of the United States, selected European countries,1 and Australia attributable to the net effect of
foreign-born women and to the TFR of native-born women, 2015
Differences in:
Overall TFR TFR of native-born women Net effect of foreign-born women
Spain 0.51 0.44 0.07
Greece 0.51 0.44 0.07
Italy 0.49 0.45 0.04
Austria 0.35 0.36 0.00
Switzerland 0.30 0.30 0.00
Australia 0.03 –0.09 0.12
Source: Own calculations.1 Only European countries with an overall TFR that is more than 15% lower than that of the US TFR are
retained for the analysis.
These findings call for some additional observations. First, we notice that there is a striking contrast between the large total effect and the limited net effect of migration on the TFR of the total population, which results from the large neutral effect of births to migrants on the country’s TFR. It is worth noting that the percentage of births to foreign-born women leading to a neutral effect on the overall TFR (Table 1, column e) ranged from 60% in France to 95% and 98% in Spain and in the Netherlands, respectively.
Second, we observe that the narrow net share of excess fertility (Table 1, column f) results in a small net effect of migration on the TFRs, which contrasts with the significantly higher levels of fertility among foreign- than native-born women. This issue, which has also been raised in previous studies (Héran and Pison 2007; Toulemon, Pailhé, and Rossier 2008), explains why in 2015 in France – where the net share of excess fertility was 13% – the relative increase in the overall TFR due to migration was quite limited (at 10%) compared with the pronounced excess fertility of migrants relative to that of natives (73% in relative terms). In 2015, the net share of the excess fertility of foreign-born women was lowest in Finland (7%) and highest in Switzerland (26%). This variation also suggests that the differences between countries in the excess fertility of migrants relative to the fertility of nonmigrant women is not necessarily the most robust indicator of differences in the effect of migration on the overall TFRs of the host countries. For instance, because of the significant difference in the net shares of excess fertility of foreign-born women in 2015 in Finland and in Switzerland (7% and 26%, respectively), the difference in the net effect of migration on each of these countries (1% and 8%, respectively) was larger than the gap in the corresponding excess fertility of foreign-born relative to that of native-born women (17% in Finland and 29% in Switzerland).
The latter observation challenges the idea that high fertility levels among migrant women can compensate for the low overall fertility levels in the receiving countries. While this issue will also be addressed in the last section, it is important to keep in mind that a country’s TFR reflects a share of the TFR of migrant women (fertility coefficient) and that the effect of this share varies widely between countries depending on the share of migrants in the population. It is interesting to note that in 2015, the fertility coefficient for foreign-born women ranged from 11% in Finland to 34% and 38% in Australia and Switzerland, respectively (Table 1, column g), which means that the overall TFR in Finland reflects 11% of the TFR of foreign-born women, while the overall TFR in Australia and Switzerland reflects 34% and 38%, respectively, of the TFR of foreign-born women. We also find that the US fertility coefficient (18%) is lower than that of the majority of the European countries under study.
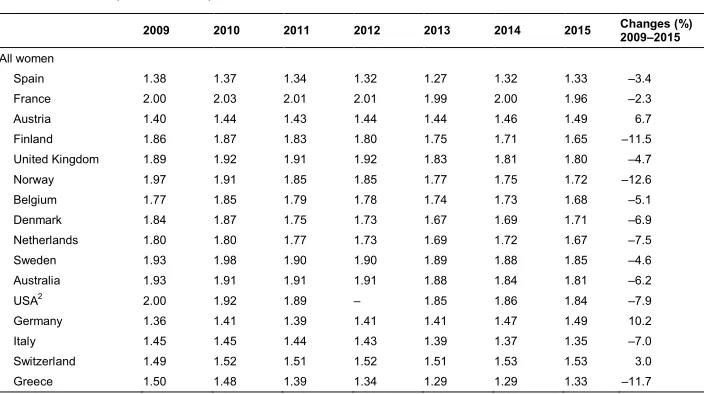
economic downturn. We first note that shifts between 2009 and 2015 in the overall TFRs of countries differed considerably. The TFRs of the total population declined in Spain, France, Italy, Greece, Finland, the United Kingdom, Norway, Sweden, Denmark, Belgium, the Netherlands, Australia, and the United States but increased in Austria, Germany, and Switzerland (see Appendix Table A-1, last column). We also observe that, generally, during the recent economic downturn, the fertility of migrants and nonmigrants (or of noncitizens and citizens) moved in the same direction, albeit along different paths. For fertility decline in particular, we find that the greater socioeconomic vulnerability of migrants did not necessarily lead to a more pronounced decline in fertility among migrants than among nonmigrants during the recent period of economic hardship. Thus, the fertility of migrants decreased faster than the fertility of nonmigrants in Spain, Greece, Italy, the United Kingdom, and the United States. However, we also find that over this period the opposite fertility trends occurred in Finland, Sweden, Denmark, Australia, and to a lesser extent in the Netherlands and that the fertility of both population groups decreased at a similar path in Norway. France seems to record a different pattern since the increase in the TFR of the foreign-born women contrasts with a decreasing trend for the native-born.
For the period from 2009 onward, we observe a rather similar pattern across countries of shifts in the foreign-born and the native-born populations (or noncitizens and citizens) of reproductive ages. However, this pattern deviates sharply from the pattern of changes in fertility among the two population groups described above. For example, the results of an analysis, not presented here in detail, of women of prime reproductive ages (aged 20 to 39) indicate that the increase in the foreign-born (or noncitizen) population was accompanied by any of the following: a reduction in the native-born (or citizen) population, as was the case for the majority of the European countries, or a stronger increasing trend among the foreign- than native-born population (Finland, Sweden, and Australia) or among foreigners than among citizens (Switzerland). Three of the countries in our study sample deviate from this pattern: Spain and Greece, where both population groups decreased and the changes were more pronounced among the foreign- than native-born women, and the United States, where the number of women increased more among the native- than foreign-born population. Consequently, over the period under consideration, the share of the foreign-born (or noncitizens) population aged 20 to 39 increased in all of the countries under study but decreased mainly in Greece and to a lesser extent in Spain and the United States.
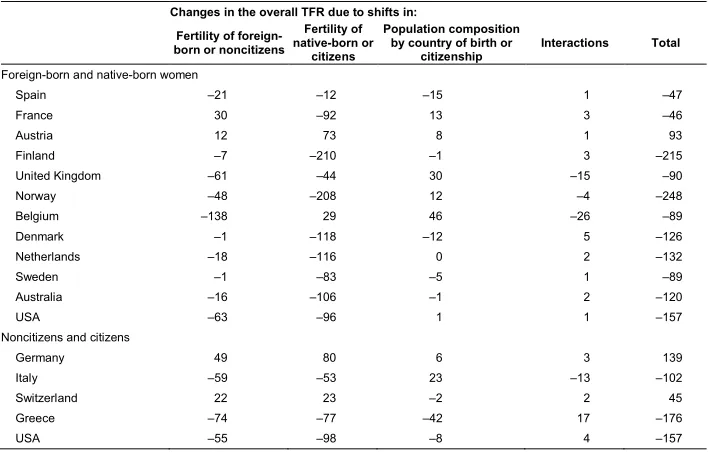
native-born women or citizens was the driving force in the changes in the overall TFR in the majority of countries under consideration, regardless of whether the overall TFR in a given country was decreasing (France, Norway, Finland, Denmark, Sweden, the Netherlands, Australia, and the United States) or was increasing (Austria and Germany). For example, the TFR in Finland decreased by –215 per 1,000 over the period of the recent economic recession, and almost the entire change is attributable to a decline in the fertility rates of native-born women (–210/1,000). Conversely, in Belgium, Spain, and the United Kingdom, the decline in fertility among foreign-born women had a greater effect than the decline in fertility among native-born women. Meanwhile, in Switzerland, Greece, and Italy, the fertility rates of citizens and noncitizens had equal effects on, respectively, the downturn and the upturn in the overall TFR. In the United Kingdom in particular, the decline in the overall TFR by –90 per 1,000 was largely attributable to the fertility effect (–61 per 1,000) associated with the decrease in the fertility rate of foreign-born women and to a lesser extent to the effect (–44/1,000) associated with the decrease in the fertility rate of native-born women. We also find that even though changes in population composition generally had only a limited impact on the TFRs of the countries, this effect was not negligible in Spain, Belgium, the United Kingdom, Greece, and Italy. In particular, we find that in Greece and Spain, the decline in the share of foreign-born women in the population led to a decrease in overall fertility of –42 and –15 per 1,000, respectively; for Spain in particular, it is a figure that is higher than the estimated effect attributable to the decline in native fertility (–12/1,000). On the other hand, the increase in the proportions of migrants in the populations of Belgium, the United Kingdom, and Italy attenuated the decrease in the TFR associated either with the decline in the fertility of both migrants and nonmigrants in the last two countries or with the diverging trends in foreign- and native-born fertility in Belgium.
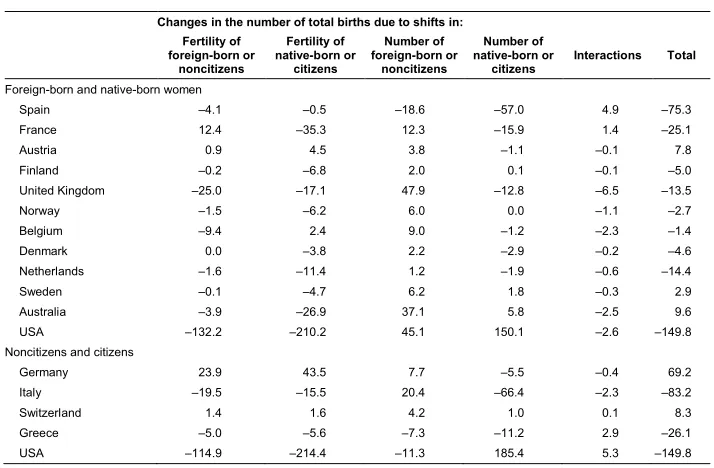
consideration, the trends in the total number of births are more attributable to shifts in fertility than to changes in the population, the opposite holds true in several other cases. In this respect, Spain and Greece offer notable exceptions of countries where the decrease in the total number of births was mainly driven by the decline in both the native- and foreign-born populations rather than by the decrease in fertility. Sweden, Australia, Italy, and Switzerland are also countries where changes in total births results in more from shifts in population than in fertility. Overall, the population component accelerated either the decline (Spain, Greece, and Italy) or the increase (Switzerland, Sweden, and Australia) in the total number of births. Shifts in the population also served to offset the decline in the total number of births associated with the decrease in fertility in Finland, Norway, the United Kingdom, Belgium, and the United States. However, the sources of these mitigating effects differed between the United States and the European countries: Population change attenuated the decline in the total number of births due to an increase in the native-born population in the United States and due to an increase in the foreign-born population in the European countries.
Table 3: The decomposition of changes in the overall TFR of selected European countries, the United States, and Australia between 2009 and 2015 (in 1,000)
Changes in the overall TFR due to shifts in:
Fertility of foreign-born or noncitizens
Fertility of native-born or
citizens
Population composition by country of birth or
citizenship Interactions Total
Foreign-born and native-born women
Spain –21 –12 –15 1 –47
France 30 –92 13 3 –46
Austria 12 73 8 1 93
Finland –7 –210 –1 3 –215
United Kingdom –61 –44 30 –15 –90
Norway –48 –208 12 –4 –248
Belgium –138 29 46 –26 –89
Denmark –1 –118 –12 5 –126
Netherlands –18 –116 0 2 –132
Sweden –1 –83 –5 1 –89
Australia –16 –106 –1 2 –120
USA –63 –96 1 1 –157
Noncitizens and citizens
Germany 49 80 6 3 139
Italy –59 –53 23 –13 –102
Switzerland 22 23 –2 2 45
Greece –74 –77 –42 17 –176
USA –55 –98 –8 4 –157
Lastly, we detect significant differences in the impact of migration (fertility and population combined) on shifts in the total number of births between the countries under consideration. Although these shifts are driven by migration in Austria, Sweden, Switzerland, Australia, and the United States – a finding which contrasts to the limited importance of migration for changes in the overall fertility – the role of migration for changes in total births is insignificant in countries such as the Netherlands and Italy. Additionally, the United States differs from the other countries with a pronounced effect of migration on changes in total births since this effect originates more from trends in the migrant fertility than in the population of migrants.
Table 4: The decomposition of changes in the total number of births of selected European countries, the United States, and Australia between 2009 and 2015 (in 1,000)
Changes in the number of total births due to shifts in: Fertility of
foreign-born or noncitizens
Fertility of native-born or
citizens
Number of foreign-born or
noncitizens
Number of native-born or
citizens Interactions Total
Foreign-born and native-born women
Spain –4.1 –0.5 –18.6 –57.0 4.9 –75.3
France 12.4 –35.3 12.3 –15.9 1.4 –25.1
Austria 0.9 4.5 3.8 –1.1 –0.1 7.8
Finland –0.2 –6.8 2.0 0.1 –0.1 –5.0
United Kingdom –25.0 –17.1 47.9 –12.8 –6.5 –13.5
Norway –1.5 –6.2 6.0 0.0 –1.1 –2.7
Belgium –9.4 2.4 9.0 –1.2 –2.3 –1.4
Denmark 0.0 –3.8 2.2 –2.9 –0.2 –4.6
Netherlands –1.6 –11.4 1.2 –1.9 –0.6 –14.4
Sweden –0.1 –4.7 6.2 1.8 –0.3 2.9
Australia –3.9 –26.9 37.1 5.8 –2.5 9.6
USA –132.2 –210.2 45.1 150.1 –2.6 –149.8
Noncitizens and citizens
Germany 23.9 43.5 7.7 –5.5 –0.4 69.2
Italy –19.5 –15.5 20.4 –66.4 –2.3 –83.2
Switzerland 1.4 1.6 4.2 1.0 0.1 8.3
Greece –5.0 –5.6 –7.3 –11.2 2.9 –26.1
USA –114.9 –214.4 –11.3 185.4 5.3 –149.8
4. Conclusions and discussion
By combining births and population data, we have estimated childbearing indicators by country of birth or citizenship in the United States, Australia, and in selected European countries over the 2009–2015 period. In particular, we have investigated the contribution of migration to the levels and trends in the TFRs and in the total numbers of births of the receiving countries. In examining the impact of migration on childbearing levels and trends, we have highlighted the importance of population composition, in addition to the differences in the fertility of foreign-born (or noncitizen) and native-born (or citizen) women.
In practice, we should seek to better understand the effect of migration on childbearing trends. It is evident that if the impact of migration on the childbearing patterns of the host countries is measured exclusively by its contribution to the increase in the TFR of the total population in a single year, then the role of migration will always be seen as limited since its net effect makes up only a part (the net share of excess fertility) of the overall excess of fertility of foreign-born or noncitizens relative to that of native-born or citizens. What is misleading in this context is not necessarily the view that birth rates among migrants significantly affect overall fertility rates (Basten, Sobotka, and Zeman 2013; Héran 2004) but the expectation that this effect will be large given the relatively small share of migrants compared to the share of nonmigrants in the population and the tendency to look at this impact only via the differences in the TFRs of migrant and nonmigrant women. If, however, the impact of migration on a country’s TFR is examined as part of the overall TFR attributable to the foreign-born or citizen women and to their fertility combined (the total effect), then it becomes clear that the contribution of migration to the country’s TFR is large and almost equal to the share of births to migrants. Obviously, this last observation is evidence of the apparent contradiction between the sizeable percentages of births to migrants and the negligible effects of migration on increases in the TFRs of the receiving countries. As we have shown, the reason for this contradiction is that the largest share of births to migrants is neutral to the increase in the overall TFR.
recent period of the economic recession in six countries: namely, Belgium, Spain, the United Kingdom, and – albeit to a lesser extent – Greece, Italy, and Switzerland. Thus, in these countries over this period, the effect of the fertility of migrants on childbearing trends (overall fertility and total number of births) was either larger than or equal to the effect of the fertility of nonmigrants.
Additionally, the analysis highlights that the effect of migration on changes in the overall fertility may significantly differ from that on changes in the total number of births in a host country. Thus, although migration (population and fertility combined) is the driving force behind shifts in the total number of births in countries such as Australia, the United States, Sweden, and Austria, it is of limited importance for changes in the overall fertility in these countries. This at first glance contradictory finding lies to the neutral effect of migration on the TFR of the receiving country as well as to the different way in which the migrant population component affects changes in the overall fertility (as the share of migrant women) or in the total number of births (as the number of migrant women).
Our findings also show that in general, the fertility of migrants is a far smaller determinant than the fertility of nonmigrants of differences in the overall TFRs of countries. Thus, our results indicate that in 2015, the TFRs in France and the United States were higher than the TFRs in the majority of the European countries under study primarily because of the TFRs of native-born women rather than because of the net effect of the TFRs of foreign-born women on the overall TFRs. This finding is quite telling for France in particular, as the net effect of migration on the average level of total fertility is highest for this country. However, the results also highlight that the average fertility of the United States and Australia remain at similar levels because of the effect of migration on the US TFR.
attributable the TFR of foreign-born women (fertility coefficients). This means that to achieve replacement-level fertility (2.1) in the United States in 2015 entirely via migration, one of the following two illustrative scenarios would be necessary: The TFR of foreign-born women would have to be 3.8 combined with their 2015 population share or the share of foreign-born women in the population would have to be increased to almost 27% in conjunction with a TFR of around 3.1.
Nevertheless, migration remains a decisive factor in current and future population change, both directly through positive net migration flows and indirectly through the contributions of migrants to the overall fertility rate and the total number of births in the receiving country. This secondary effect might be large, especially if there are significant differences in the fertility of migrants and of nonmigrants. As was shown by Jonsson and Rendall (2004), the excess fertility of migrant relative to that of nonmigrant women is likely to be the main source of any rejuvenation of the US population. While the excess fertility of migrants is factored into US population projections (Colby and Ortman 2015b), it has yet to be fully explored in Europe (Lanzieri 2011; Norman, Rees, and Wohland 2014). However, factoring the fertility contributions of migrants into future population changes would require the use of alternative approaches – such as those proposed by Jonsson and Rendall (2004) – that go beyond the conventional methods used in population projections.
Our investigation of the contribution of migrants to childbearing trends supports the suggestion that the notion of replacement-level fertility should be reconsidered (Smallwood and Chamberlain 2005; Sobotka 2008). Relevant studies (Ediev, Coleman, and Scherbov 2014; Lanzieri 2013b; Wilson et al. 2013) have found that differences in the fertility rates of migrant and nonmigrant women can be relevant inputs for extending the aforementioned notion to the concept of intergenerational replacement and for assessing the role of migration in shifts in the extent of replacement for birth cohorts. Issues related to the impact of migration on childlessness patterns (Kreyenfeld and Konietzka 2017) also seem to represent a prominent area for further research.
In this paper, we relied on the TFR to estimate levels and trends in the fertility of migrant and nonmigrant women. Our decision to use the TFR, which was mainly related to data availability, can be seen as a weakness of the study since the TFR can be subject to tempo rather than quantum effects. In addition, this indicator does not take into account the discontinuity in the life history events of migrant women in particular (i.e., their fertility before and after migration; Toulemon, Pailhé, and Rossier 2008). Thus, the TFR does not capture some variables that can be relevant for the fertility behavior of migrant women, such as the duration since migration or the age at arrival in the host country (Robards and Berrington 2016; Toulemon 2006). However, the TFR is a widely used fertility indicator that is easily estimated when data is available and reflects with a fair degree of accuracy childbearing trends in population groups.
5. Acknowledgments
References
ABS (Australian Bureau of Statistics) (2018a). 3301.0: Births, Australia, 2017: Data cubes: Table 6: Births, Country of birth of parent, Australia: 2017 [electronic resource]. Canberra: ABS. http://www.abs.gov.au/AUSSTATS/[email protected]/ DetailsPage/3301.02017?OpenDocument (accessed December 7, 2018).
ABS (Australian Bureau of Statistics) (2018b). Estimated resident population, country of birth, age and sex: As at 30 June 1996 to 2017 [electronic resource]. Canberra: ABS. http://stat.data.abs.gov.au/Index.aspx?DatasetCode=ERP_COB (accessed December 7, 2018).
Alho, J.M. (2008). Migration, fertility, and aging in stable populations. Demography
45(3): 641–650.doi:10.1353/dem.0.0021.
Bagavos, C. and Tragaki, A. (2017). The compositional effects of education and employment on Greek male and female fertility rates during 2000–2014.
Demographic Research 36(47): 1435–1452.doi:10.4054/DemRes.2017.36.47. Bagavos, C., Verropoulou, G., and Tsimbos, C. (2018). Assessing the contribution of
foreign women to period fertility in Greece, 2004–2012.Population 73(1): 115– 130.doi:10.3917/popu.1801.0119.
Basten, S., Sobotka, T., and Zeman, K. (2013). Future fertility in low fertility countries. Vienna: Vienna Institute of Demography (VID Working Papers 5). https://www.oeaw.ac.at/fileadmin/subsites/Institute/VID/PDF/Publications/Wor king_Papers/WP2013_05.pdf.
Bélanger, A. and Gilbert, S. (2002). The fertility of immigrant women and their Canadian-born daughters. In: Statistics Canada (ed.). Report on the demographic situation in Canada 2002. Ottawa: Statistics Canada: 127–152. https://www150.statcan.gc.ca/n1/en/pub/91-209-x/91-209-x2002000-eng.pdf? st=wotQqz7I.
Camarota, S. and Zeigler, K. (2015). The declining fertility of immigrants and natives. Washington, D.C.: Center for Immigration Studies. http://cis.org/sites/cis. org/files/camarota-declining-fertility.pdf.
Canudas Romo, V. (2003). Decomposition methods in demography [PhD thesis]. Groningen: Rijksuniversiteit Groningen.
Cho, L.J. and Retherford, R.D. (1973). Comparative analysis of recent fertility trends in East Asia. In: IUSSP (ed.). Proceedings of the 17th General Conference of the
Colby, S.L. and Ortman, J.M. (2015a). New population projections account for differences in fertility of native- and foreign-born women [electronic resource]. Washington, D.C.: US Census Bureau. https://www.census.gov/newsroom/ blogs/random-samplings/2015/03/new-population-projections-account-for-differences-in-fertility-of-native-and-foreign-born-women.html (accessed January 10, 2017).
Colby, S.L. and Ortman, J.M. (2015b). Projections of the size and composition of the US population: 2014 to 2060. Washington, D.C.: US Census Bureau (Current Population Reports P25-1143). https://www.census.gov/content/dam/Census/ library/publications/2015/demo/p25-1143.pdf.
Coleman, D.A. (2006). Immigration and ethnic change in low-fertility countries: A third demographic transition.Population and Development Review 32(3): 401– 446.doi:10.1111/j.1728-4457.2006.00131.x.
Coleman, D.A. and Dubuc, S. (2010). The fertility of ethnic minorities in the UK, 1960s–2006. Population Studies 64(1): 19–41. doi:10.1080/0032472090339 1201.
Ediev, D., Coleman, D., and Scherbov, S. (2014). New measures of population reproduction for an era of high migration. Population Space and Place 20(7): 622–645.doi:10.1002/psp.1799.
Espenshade, T.J. (1986). Population dynamics with immigration and low fertility.
Population and Development Review 12(Supplement): 248–261. doi:10.2307/ 2807908.
Espenshade, T.J. (1994). Can immigration slow US population aging?Journal of Policy Analysis and Management 13(4): 759–768.doi:10.2307/3325496.
Eurostat (2015). Demography report. Luxembourg: European Commission (Short Analytical Web Note 3/2015).http://ec.europa.eu/eurostat/documents/3217494/ 6917833/KE-BM-15-003-EN-N.pdf/76dac490-9176-47bc-80d9-029e1d967af6. Eurostat (2017a). Population and social conditions: Demography and migration:
Fertility: Live births by mother’s age and country of birth (demo_facbc) [electronic resource]. Luxembourg: Eurostat. http://ec.europa.eu/eurostat/ data/database (accessed February 23, 2017).
Eurostat (2017c). Population and social conditions: Demography and migration: Population: Population on 1 January by age, sex and broad group of country of birth (migr_pop4ctb) [electronic resource]. Luxembourg: Eurostat. http://ec.europa.eu/eurostat/data/database (accessed February 23, 2017).
Eurostat (2017d). Population and social conditions: Demography and migration : Population: Population on 1 January by age, sex and broad group of citizenship (migr_pop2ctz) [electronic resource]. Luxembourg: Eurostat. http://ec.europa. eu/eurostat/data/database (accessed February 23, 2017).
Eurostat (2019a). Population and social conditions: Demography and migration: Fertility: Live births by mother’s age and newborn’s sex (demo_fasec) [electronic resource]. Luxembourg: Eurostat. http://ec.europa.eu/eurostat/data/ database (accessed March 8, 2019).
Eurostat (2019b). Population and social conditions: Demography and migration: Fertility: Fertility rates by age (demo_frate) [electronic resource]. Luxembourg: Eurostat.http://ec.europa.eu/eurostat/data/database (accessed March 8, 2019). Farnsworth Riche, M. (2000). America’s diversity and growth: Signposts for the 21st
century.Population Bulletin 55(2): 1–43.
Gabrielli, G., Paterno, A., and Strozza, S. (2007). Dynamics, characteristics and demographic behaviour of immigrants in some South-European countries. Paper presented at the International Conference on Migration and Development, Moscow, Russia, September 13–15, 2007. http://scholar.google.ca/citations? view_op=view_citation&hl=en&user=jLXomFsAAAAJ&citation_for_view=jL XomFsAAAAJ:2osOgNQ5qMEC.
Gebremariam, W. and Beaujot, R. (2010). Fertility behavior of immigrants in Canada: Converging trends. London: Populations Studies Centre, University of Western Ontario (PSC Discussion Papers Series 10-05). https://ir.lib.uwo.ca/cgi/ viewcontent.cgi?article=1138&context=pscpapers.
Giannantoni, P. and Strozza, S. (2015). Foreigners’ contribution to the evolution of fertility in Italy: A re-examination of the decade 2001–2011. Rivista Italiana di Economia Demografia e Statistica 69(2): 129–140.
Goldstein, J.R., Sobotka, T., and Jasilioniene, A. (2009). The end of ‘lowest-low’ fertility? Population and Development Review 35(4): 663–699. doi:10.1111/ j.1728-4457.2009.00304.x.
Héran, F. and Pison, G. (2007). Two children per woman in France in 2006: Are immigrants to blame?Population and Societies 432: 1–4.
INSEE (2019). Les naissances en 2017: Tableaux de séries longues: T37TER: Nés vivants selon le lieu de naissance des parents [electronic resource]. Paris: INSEE. https://www.insee.fr/fr/statistiques/3576462?sommaire=3576483&q= N%C3%A9s+vivants+selon+le+lieu+de+naissance+des+parents (accessed March 7, 2019).
Jonsson, S.H. and Rendall, M.S. (2004). Fertility contribution of Mexican immigration to the United States.Demography 41(1): 129–150.doi:10.1353/dem.2004.0006. Kitagawa, E.M. (1955). Components of a difference between two rates.Journal of the
American Statistical Association 50(272): 1168–1194. doi:10.1080/01621459. 1955.10501299.
Kreyenfeld, M. and Konietzka, D. (2017). Childlessness in Europe: Contexts, causes, and consequences. Cham: Springer Open.
Lanzieri, G. (2011). Fewer, older and multicultural? Projections of the EU populations by foreign/national background. Luxembourg: Eurostat (Eurostat Methodologies and Working papers).doi:10.2785/17529.
Lanzieri, G. (2013a). Towards a ‘baby recession’ in Europe? Differential fertility trends during the economic crisis. Luxembourg: Eurostat (Statistics in Focus 13). http://ec.europa.eu/eurostat/documents/3433488/5585916/KS-SF-13-013-EN.PDF/a812b080-7ede-41a4-97ef-589ee767c581.
Lanzieri, G. (2013b).Old and new measures of population replacement: A comparative review with application to European countries. Paper presented at the XXVII IUSSP International Population Conference, Busan, South Korea, August 26–31, 2013. https://www.researchgate.net/publication/258208913_Old_and_New_ Measures_of_Population_Replacement_-_A_Comparative_Review_with_Appli cation_to_European_Countries.
Livingston, G. (2016). Births outside of marriage decline for immigrant women. Washington, D.C.: Pew Research Center. https://www.pewsocialtrends.org/ 2016/10/26/births-outside-of-marriage-decline-for-immigrant-women/ (accessed October 10, 2016).
Martin, J.A., Hamilton, B.E., Osterman, M.J.K., Driscoll, A.K., and Mathews, T.J. (2017). Births: Final data for 2015. Atlanta: Centers for Disease Control and Prevention (National Vital Statistics Reports 66-1). https://www.cdc.gov/nchs/ data/nvsr/nvsr66/nvsr66_01.pdf.
McDonald, P. and Bélanger, A. (2016). A comparison of fertility in Canada and Australia, 1926–2011. Canadian Studies in Population 43(1–2): 5–22. doi:10.25336/P6R016.
Murphy, M. (2016). The impact of migration on long-term European population trends, 1850 to present. Population and Development Review 42(2): 225–244. doi:10.1111/j.1728-4457.2016.00132.x.
NCHS (National Center for Health Statistics) (2017). User guide to the 2017 Natality Public Use file. Atlanta: Centers for Disease Control and Prevention. https://www.cdc.gov/nchs/data_access/vitalstatsonline.htm.
Nisén, J., Martikainen, P., Silventoinen, K., and Myrskylä, M. (2014). Age-specific fertility by educational level in the Finnish male cohort born 1940‒1950.
Demographic Research 31(5): 119–136.doi:10.4054/DemRes.2014.31.5. Norman, P., Rees, P., and Wohland, P. (2014). The use of a new indirect method to
estimate ethnic-group fertility rates for subnational projections for England.
Population Studies 68(1): 43–64.doi:10.1080/00324728.2013.810300. OECD (2015). Indicators of immigrant integration: Settling in. Paris: OECD.
ONS (Office for National Statistics) (2016). Total Fertility Rates (TFR) for UK and non UK born women in the UK, 2004 to 2015 [electronic resource]. Newport: Office for National Statistics.https://www.ons.gov.uk/peoplepopulationandcommunity/ birthsdeathsandmarriages/conceptionandfertilityrates/adhocs/006295totalfertility ratestfrforukandnonukbornwomenintheuk2004to2015 (accessed November 4, 2016).
PAA (2002). Why is US fertility so high? Comparative perspectives. Session 141 of the 2002 Annual Meeting of the Population Association of America, Atlanta, USA, May 9–11, 2002.
Robards, J. and Berrington, A. (2016). The fertility of recent migrants to England and Wales. Demographic Research 34(36): 1037–1052.doi:10.4054/DemRes.2016. 34.36.