Vol. 10, No. 3, 2018 Article ID IJIM-00965, 8 pages Research Article
Network Data Envelopment Analysis Models For Measuring
Efficiency Of a Four-Stage Supply Chain With Returned Outputs
M. Vaez-Ghasemi ∗†, Z. Moghaddas ‡, B. Rahmani Parchekolaee§
Received Date: 2016-10-30 Revised Date: 2017-09-27 Accepted Date: 2017-10-22 ————————————————————————————————–
Abstract
In this paper, while data envelopment analysis (DEA) technique has been used, four-stage DEA model mooted in order to consider the situation in which there exist returned products. These products are neither final products nor inputs of the next sub-process. These returned products are the inputs of previous sub-processes that need to be processed again due to existence of flaws. Here a supply chain with four stages as supplier, manufacture, distributor and retailer with intermediate and return products has been considered and a DEA model formulated for analyzing it. Also, with an application validity of the proposed model has been demonstrated.
Keywords: Data Envelopment Analysis; Supply chain; Returned products; Efficiency.
—————————————————————————————————–
1
Introduction
I
nattention, for those firms would like to in-competitive market what gains an important crease quality and decreasing costs, is selecting the best supplier. Thus in any supply chain man-agement supplier selection is a fundamental as-pect. Any supply chain can be managed from different methods. Therefore, many companies try to better evaluate and select suppliers. As stated in literature, DEA is a mathematical based technique for performance evaluation of a set of Decision Making Units (DMUs) which use∗Corresponding author. [email protected], Tel: +(98)9128168162
†Department of Mathematics, Rasht Branch, Islamic Azad University, Rasht, Iran.
‡Department of Mathematics, Qazvin Branch, Islamic Azad University, Qazvin, Iran.
§Department of Mathematics, Central Tehran Branch, Islamic Azad University, Tehran, Iran.
multiple resources to produce multiple outputs. One of the first models presented in this tech-nique has been discussed in the CCR paper by Charnes et al. [4], and then this model developed by various researchers, as what banker et al. [1] have done. This method computes the relative efficiency of a set of DMUs.
In literature many researches considering supply chain and other techniques, to address a few con-sider the following.
In a paper Cakravastia et al. [2], for designing a supply chain network, developed an analytical model of the supplier selection process. It needs to note that the constraints on the capacity of each potential supplier are considered in the pro-cess.
In their paper Castro-Lacouture et al. [3] ad-dressed the purchase of construction materials as the last component in the supply chain.
Xu et. al [10] studied the supply chain
mance evaluation of a furniture manufacture in-dustry. Moreover, they have identified them a in uncertainty factors affecting evaluation process, and using our rough data envelopment analysis (RDEA) formulate and analyze them. Also, they have created rough DEA by integrating classical DEA and rough set theory.
Lee and Farzipoor Saen [7] provided a new model, based on data envelopment analysis technique, for performance evaluation of corporate sustain-ability. They employed cross efficiency in the presence of dual role factors. Thus, introduced a new model for measuring corporate sustainabil-ity management. Their findings made a great contribute in literature of corporate sustainabil-ity management.
Kuo and Lin [6] presented a supplier selection method. The provided method considers consid-ers green indicators due to environmental pro-tection issues, while utilizing data envelopment analysis (DEA) and also analysis network pro-cess (ANP). The important feature of presented model is that it can provide accurate results while considering a few DMUs.
As discussed formerly DEA is a mathematical technique for performance evaluation of set of DMUs with multiple inputs and outputs. It needs to be noted that presence of units with conflict-ing data make evaluation more complex thus a technique with great ability is needed. Supply chain (SC) performance evaluation is also a com-plex problem, involving various criteria therefore due to this fact considering DEA for evaluating such problem is suitable. In DEA literature there exist models considered for undesirable or bad outputs in production system. Lozano [9] pro-vided a linear model for assessing a general net-work with bad outputs foe efficiency evaluation of each stages, overall efficiency, and target DMUs. Liu et. al. [8] constructed a two-stage DEA mod-els with undesirable indexes.
Khalili-Damghani and Shahmir [5] considered un-desirable outputs into model formulation as well as uncertainty in data and proposed approach for efficiency assessment.
In this paper a new network models for achiev-ing correct efficiency of a supply chain with four stages as supplier, manufacture, distributor and retailer with intermediate and return products
is presented. Bad, and undesirable outputs are considered in evaluation process in theory and reseach in different fields, in this study one of great feature is considering returned output as this is very common in real world problems. Re-turned outputs are those outputs need to be re-paired they are not bad or undesirable. These kind of outputs are neither final outputs nor in-dependent inputs, they are intermediate output of a sub-process that need to be processed again, thus considered as inputs.
The current article proceeds as follows: At first some preliminaries about DEA and supply chain have been reviewed. In section 3 the main idea has been mooted, in section 4 an application of the proposed model has been performed for clar-ity. Section 5 concludes the paper.
2
DEA Priliminaries
Data envelopment (DEA) is a mathematical based programming for assessing a set of ho-mogenous Decision Making Units (DMUs). Charnes et. al. [4] presented the fundamental model, called CCR after the name of the au-thors, which considers constant returns to scale technology. After that many DEA models have been presented each of which deals with specific issues and helps managers for better decision making. While considering DEA technique DMUs are classified into two subsets, efficient and inefficient DMUs. Those DMUs performs efficiently construct DEA frontier, through a comparison prossed with which relative efficiency of other units, those inefficient ones that are not located onto this frontier, obtained. Moreover, those efficient DMUs located onto the frontier can also be considered as benchmark units. In regard of these benchmarks managers can better guide system in future.
min θ−ε(1S−+ 1S+)
s.t. Xλ+S− =θXo,
Y λ−s+ =Yo,
λ≥0.
(2.1)
The dual of the above model which is called multiplier form is as follows:
max UtYo
s.t. VtXo = 1,
UtYj−VtXj ≤0, ∀j,
U ≥0, V ≥0.
(2.2)
In the above- mentioned model v and u are the input and output weight vectors.
Both of the aforesaid models are in input ori-entation where the input reduction is due to maximized. The above models can be written in output orientation where the output shortfall is due to minimized.
2.1 Supply Chain Management
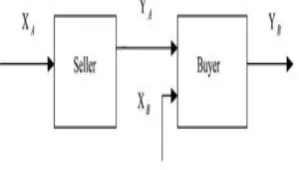
Consider figure 1 in which the famous buyer-seller supply chain is depicted. In regards of this chain XA is the input vector of the seller, and
YA is corresponding output vector. Consider YA
and XB as the input vector of the buyer andYB
as the output vector the buyer.
In accordance to the above mentioned
informa-Figure 1: A DMU with two processes
tion suppose there exist n such supply chains. The CCR DEA efficiency of the supply chain is measured as what has been provided by Charnes
et. al. [4]:
max Ut YBo
Vt (X
Ao, YBo)
s.t. Ut YBj
Vt (X
Aj,‘YBj) ≤1, ∀j,
U ≥0, V ≥0.
(2.3)
In this modelU andV are corresponding weights of outputs and inputs, respectively.
As indicated in Zhu [11], model (2.3) suffers from describing the performance of supply chains accurately. The reason is that in this model only inputs and outputs of the supply chain have been accounted for and it pays no attention to
YA related to supply chain members. In order
to remove such difficulty Zhu [11] considered
YA as input of the buyer and output of the
seller. Moreover, he discussed that for better analyzing the system, supply chain, efficiency of each individual supply chain members needs to be computed. As it is obvious, performance of the whole system relates to performance of each and every members. A supply chain would be efficient in which all of the members performs efficiently. Now consider the following model in which the average efficiency of the buyer and seller considered as the objective function. The objective of this model is to maximize average efficiency of the buyer and seller, while each of the inequality constraints control efficiency of each member not to exceed one.
max 12(UAt YAo
Vt
A XAo +
Ut B YBo
Vt
B (XBo,XAo))
s.t. UAt YBj
VAt XAj ≤1, j= 1, ..., n, ,
Ut B YAo
Vt
B (XBo,XAo) ≤
1, j= 1, ..., n, ,
UA≥0, VA≥0, UB≥0, VB≥0.
(2.4) One important issue about this model is that although it considers YA, as output of the seller
and input of the buyer, it attributed different weights for it. WhenYA is an input,
correspond-ing value is defined byVB and when it considered
as output, corresponding weigh is UB. Under
not be accurately considered.
In following section a DEA model will be pre-sented in which relation between stages as well as performance of the chain has been considered accurately.
3
Network
DEA
for
Supply
chain
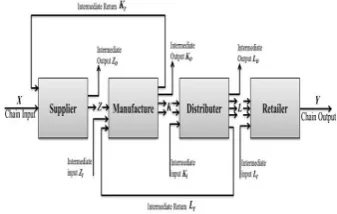
In order to obtain the efficiency of a supply chain, a general case of a supply chain with four stages, as portrayed in Figure 2, has been accounted for.
For better managing supply chains, efficiency of each supply chain should be considered and these measures should be considered as a criterion for selecting the best chain. This means if a supply chain is active in previous periods, then according to its efficiency further decisions for making changes should be made. Along with, if a chain performs inefficiently, then reasonable decisions should be taken for continuing cooper-ation with this unit. In doing so a mathematical model based on DEA technique provided for efficiency evaluation of a supply chain with four stages. Moreover, inn presented model every cases which may happen in a supply chain have been accounted for. Thus in this case it is possible to make minor changes in order to use it for other problems. Therefore, for every stages inputs, intermediate products and returned output have been considered. In reality, return from the distributor to manufacture is a common happening. As depicted, in Figure 2, a return as the output of the distributor to be the input of manufacture has been considered.
Assume that each of the units has sub process like the following figure. In the above figure X is the input vector andZoare the output vectors of
the supplier. Z, ZI andLr are the input vectors
(Lr is the return product from distributor), K
and Ko are the outputs of the manufacture.
K and KI are the input vectors, L, Lo and
Lr are the output vectors of the distributor.
In the retailer L and LI are the input vectors
and Y is the output vector. It should be paid attention that each sub process can have outputs considered as the output of the system and it can
have inputs from the previous section and those which can be considered as independent inputs.
Assume there exist a DMU with four stage series
Figure 2: A Four-stage supply chain.
structural sub-processes (members). Consider a four-stage process as shown in Figure 1. In this system Y is the final output, Zo, Ko and
Lo are the outputs of the first, second and third sub-processes, respectively. Moreover, X is the input of the first subprocess, ZI, KI and LI
are the inputs of the second, third and fourth sub-processes, respectively. Meanwhile, let us assume that in the third subprocess the produced output divided into Lo and LR. Where, Lo is
the produced output of the third subprocess that can be used or even sold and it can be viewed as the output of the system. LRis an output which
should be returned to be processed again thus is considered as the input of the second stage. Also, as depicted in Figure1, in the second sub-process the produced output divided into Ko and KR. Considering the second sub-process, Ko is the produced output of which can be used or even sold, moreover, it can be viewed as the output of the system. KR is an output returned to be processed again thus is considered as the input of the first stage. Therefore, efficiency score relates to each subprocess and aggregate efficiency will be obtained via the following equations.
e1p = W Zp+W oZo
p
V Xp+µRKR p, e2
p =
µKp+µoKo p−µRKRp
W Zp+WIZpI+λRLR p e3p = λLp+λ
oLo p−λRLRp
µK+µIKI p e4p = U Yp
λLp+λILI p eap =
W Zp+WoZpo+µKp+µoKop−µRKpR+λLp+λoLop−λRLRp+U Yp
V Xp+µRKR
As regards to the above-mentioned definitions the relative efficiency score of DM Up will be
obtained by solving the following model:
M ax eap =
W Zp+WoZo
p+µKp+µoKpo−µRKpR+λLp+λoLop−λRLRp+U Yp
V Xp+µRKR
p+W Zp+WIZpI+λRLRp+µK+µIKpI+λLp+λILIp
eaj =
W Zj+WoZo
j+µKj+µoKjo−µRKjR+λLj+λoLoj−λRLRj+U Yj
V Xj+µRKR
j+W Zj+WIZjI+λRLRj+µK+µIKIj+λLjp+λILIj
≤1, j= 1, ..., n,(a)
e1j = W Zj+W oZo
j
V Xj−µRKjR ≤
1, j= 1, ..., n,
e2j = µKj+µ oKo
j−µRKjR
W Zj+WIZjI+λRLR j ≤
1, j= 1, ..., n,
e3j = λLj+λ oLo
j−λRLRj
µK+µIKI
j ≤
1, j = 1, ..., n,
e4
j = U Yj
λLj+λILI j ≤
1, j= 1, ..., n,
V ≥1ε, U ≥1ε,
W ≥1ε, Wo ≥1ε, WI ≥1ε,
λ≥1ε λo≥1ε, λI ≥1ε, λR≥1ε,
µ≥1ε, µo≥1ε, µI≥1ε.
(3.6)
Theorem 3.1 The aggregate efficiency of
DM Up is equal to one if and only if efficiency
score of each sub-processes of DM Up equals one.
Proof. As regards to this fact that the aggregate efficiency score is the convex combination of the efficiency scores of sub-processes, which means:
∃λ¯≥0; ea
p = ¯λ1e1p+ ¯λ2ep2+ ¯λ3e3p+ ¯λ4e4p
where
¯
λ1+ ¯λ2+ ¯λ3+ ¯λ4= 1
thus:
eap = 1⇔e1p = 1, e2p = 1, e3p = 1, e4p = 1
According to what has been proved it is evident that in the following model the bundle of con-straints (a) are redundant. Therefore, it is possi-ble to be omitted, and corresponding linear coun-terpart of this model will be as follows:
M ax eap =
U Yp+WoZpo+µ oKo
p+λ oLo
p+W Zp+WoZpo+µKp
+µoKo
p−µRKpR+λLp+λoLop−λRLRp +U Yp
S.t V Xp+µRKpR+W Zp+WIZpI+λRLRp
+µK+µIKpI+λLp+λILIp= 1,
e1
j =
W Zj+WoZjo−V Xj−µRKjR≤0, j= 1, ..., n,
e2j =
µKj+µoKjo−µRKjR−W Zj−WIZjI−λRLRj ≤0,
j= 1, ..., n, e3j =
λLj+λoLoj−λRLRj −µK−µIKjI ≤0,
j= 1, ..., n, e4
j =
U Yj−λLj−λILIj ≤0, j= 1, ..., n,
V ≥1ε, U ≥1ε,
W ≥1ε, Wo≥1ε, WI ≥1ε,
λ≥1ε λo≥1ε, λI ≥1ε, λR≥1ε,
µ≥1ε, µo≥1ε, µI ≥1ε.
(3.7)
4
Numerical example
material. Also, Wastes of manufacture or re-turned raw materials in production step of man-ufacture will return to supplier.
In regards of mentioned situations the problem
Table 1: First stage data (Supplier)
X Zo Z ZI KR
Input Output Output Output input 1 0.18 12.05 52.38 1125 20.39 2 0.17 11.94 22.88 1192 24.37 3 0.18 12.08 45.00 1344 15.88 4 0.06 12.09 22.05 1489 13.93 5 0.19 11.99 43.70 420 16.39 6 0.21 13.54 48.30 333 1.10
will be as follows. Consider Table1through4, in which corresponding data of supplier, manufac-ture, distributor and retailer have been gathered.
Table 2: Second stage data (Manufacture) Z Zo Lr K Ko KR
z }| { K1 K2
Input Input Input Output Output Output 1 52.38 12.05 0.0768 571 1325 83 20.39 2 22.88 11.94 0.0111 501 1183 56 24.37 3 45.00 12.08 0.0148 537 1222 49 15.88 4 22.05 12.09 0.0043 394 904 35 13.93 5 43.70 11.99 0.0176 904 395 30 16.39 6 48.30 13.54 0.0183 395 333 9 1.10
Table 3: Third stage data (Distributor)
K KI LO L Lr
z }| { L1 L2 L3
Input Input Output Output Output 1 1325 0.0319 0.0313 0.2893 0.0325 0.2396 0.0768 2 1183 0.0361 0.0341 0.4540 0.0321 0.2000 0.0111 3 1222 0.0334 0.0325 0.2600 0.0341 0.2100 0.0148 4 904 0.0341 0.0332 0.3320 0.0312 0.2930 0.0043 5 395 0.0339 0.0325 0.4450 0.0343 0.2420 0.0176 6 333 0.0350 0.0337 0.7900 0.0374 0.3400 0.0183
By using above data and model (3.5) we can calculate aggregate efficiency of chain and the result of this model is listed as below.
As we mentioned above, aggregate efficiency of a network is a convex combination of each stage efficiency and this aggregate efficiency will be efficient if and only if, all of stages be efficient, separately. Consider any DMU, by improving corresponding inefficient stages, it is possible to improve aggregate efficiency of a chain. In order to analyze a supply chain efficiency score of each stage needs to be computed, separately, to investigate the extend of inefficiency of each
Table 4: Forth stage data (Retailer) L LI Y
Input Input Output
1 2.80 20 3.60 2 2.80 20 3.60 3 2.80 20 3.60 4 2.80 20 3.60 5 2.80 20 3.60 6 2.35 28 3.68
Table 5: Aggregate result Chain1 Chain2 Chain 0.9839 0.9699 0.9401
Chain4 Chain5 Chain6 1.0000 0.9666 1.0000
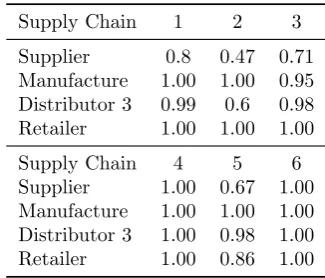
chain. Here, you can see each stage efficiency scores separately in below table.
Table 6: Stages efficiencies
Supply Chain 1 2 3
Supplier 0.8 0.47 0.71 Manufacture 1.00 1.00 0.95 Distributor 3 0.99 0.6 0.98 Retailer 1.00 1.00 1.00
Supply Chain 4 5 6
Supplier 1.00 0.67 1.00 Manufacture 1.00 1.00 1.00 Distributor 3 1.00 0.98 1.00 Retailer 1.00 0.86 1.00
On the other hand, units 1, 2, 3 and 5, respec-tively, gain best aggregate efficiency which can be easily analyzed due to inefficiency of different stages of the chain.
In supply chains, inefficiency in the first stages ia much more better than in final ones. In fact, inefficiency in the first stages of a supply chain can be easily removed and improved by decreas-ing inputs. Indeed, if distributor is inefficient it must decrease its input more than the increase of manufacture output thus inputs of distributor will be decreased. On the other hand, for increas-ing efficiency by increasincreas-ing the output, it must increase its output and also decrease undeniable returned output which does not lead to an in-crease in returned input for manufacture. Noted that increasing output of distributor will result in increasing the input of retailer. Thus this increase must be performed to the extent which does not decrease the efficiency of retailer. As discussed above, it is better to have inefficiency in the firsts stages of a supply chain which can be improved with less complexity.
Analyzing other chains can be performed likewise. In deed, inefficiency in a chain s depends on the type of operations that take place within it. Con-sidering the proposed model it is possible to inves-tigate stage and aggregate efficiencies accurately. Having such information it is possible to make changes and improvements in a supply chain.
5
Conclusion
As stated formerly performance evaluation of a set of supply chains by DEA model had a lot of errors. Some models are provided for overcoming such difficulty. In this paper the aim is to for-mulate a model which can deal with real world problems. Here a model presented which evalu-ate efficiency of a supply chain along with effi-ciency scores of corresponding four sub-processes (members). Here a supply chain with four stages as supplier, manufacture, distributor and retailer with intermediate and return product has been considered. Moreover, as it is so common in re-ality, returned outputs are also incorporated in presented model. This is the case that may hap-pen frequently. With an application the ability of presented model has been demonstrated. Also,
for further discussion can develop this model by share inputs and outputs.Benchmarking for an in-efficient chain or subprocess can be one of the further discussions.
References
[1] R. D. Banker, A. Charnes, W. W. Cooper, Some models for estimating technical and scale inefficiencies in data envelopment anal-ysis,Manag Sci 30 (1984) 1078-92.
[2] A. Cakravastia, Isa S. Tohab, N. Nakamur, A two-stage model for the design of supply chain networks,Int. J. Prod Econ 80 (2002) 231-248.
[3] D. Castro-Lacouture, A. L. Medaglia, M. Skibniewski, Supply chain optimization tool for purchasing decisions in B2B construction marketplaces, Autom in Const (2006)
[4] A. Charnes, W. W. Cooper, E. Rhodes, Mea-suring the efficiency ofdecision making units,
Euro J of Oper Res 2 (1978) 429-444.
[5] Kaveh Khalili-Damghani, Zohreh Shahmir, Uncertain network data envelopment anal-ysis with undesirable outputs to evaluate the efficiencyof electricity power production and distribution processes Author links open overlay panel,Comp &Indus Eng 88 (2015) 131-150.
[6] R. J. Kuo, Y. J. Lin, Int J of Prod Res 50 (2012) 2852-2863.
[7] K. Lee, R. Farzipoor Saen, Measuring corpo-rate sustainability management: A data en-velopment analysis approach. Int J of Prod Econo 140 (2012) 219-226.
[8] W. Liu, Z. Zhou, C. Ma, D. Liu, W. Shen, Two-stage DEA models with undesir-able input-intermediate-outputs, Omega 56 (2015) 74-87.
[9] S. Lozano, Slacks-based inefficiency ap-proach for general networks with bad out-puts: An application to the banking sector,
[10] J. Xu, B. Li, D. Wu, Rough data envelop-ment analysis and its application to supply chain performance evaluation, Int. J.Produ Econ. 112 (2009) 683-699.
[11] J. Zhu, Quantitative Models for Performance Evaluation and Benchmarking: Data Envel-opment Analysis with Spreadsheets,Boston: Kluwer Academic Publishers (2003).
Mohsen Vaez-Ghasemi is an assis-tant professor at the Department of Mathematics, Rasht Branch, Islamic Azad University, Rasht, Iran. His research interests include operation research and data envel opment analysis.
Zohreh Moghaddas is an assis-tant professor at the Department of Mathematics, Qazvin Branch, Islamic Azad University, Qazvin, Iran. Her research interests include operation research and data envel-opment analysis.