Iranian Chemical Society
Anal. Bioanal. Chem. Res., Vol. 4, No. 1, 171-187, June 2017.
Combination of Experimental Design and Desirability Function as a Genuine
Method to Achieve Common Optimal Conditions for the Adsorption of Pb(II) and
Cu(II) onto the Poplar Tree Leaves: Equilibrium, Kinetic and Thermodynamic
Studies
Salma Jadali, S. Maryam Sajjadi*, Hassan Zavvar Mousavi and Maryam Rajabi
Faculty of Chemistry, Semnan University, Semnan, Iran(Received 13 November 2016, Accepted 3 March 2017)
In this study, the ashes of poplar tree leaves are applied as an efficient, accessible and inexpensive biosorbent for the removal of heavy metals Pb2+ and Cu2+ in aqueous solutions. In the adsorption processes, the success of the ions removal highly depends on the level of several experimental factors such as pH, contact time, adsorbent dosage and temperature. Therefore, a genuine statistical experiment design
method is required to achieve the common experimental conditions at which both ions have been removed from the aqueous solutions to a great degree. Here, the desired common optimal conditions are obtained by the combination of experimental design and desirability
function methods. For a mixture of Pb2+ and Cu2+, the following optimal conditions were achieved at: pH of 5.4, contact time of 23 min, adsorbent dosage of 0.14 g, and temperature of 28°C; at 150 mg l-1 of Pb2+ and 120 mg l-1 Cu2+.Theremoval efficiencies of Pb2+ and Cu2+
were 92.8% and 94.9%, respectively, indicating the applicability of this biosorbent for the ions removal. Moreover, the equilibrium and kinetic behavior of the adsorption processes are investigated and then thermodynamic parameters, ΔG°(kJ mol-1), ΔH (kJ mol-1)°, and ΔS°
(kJ mol-1), are evaluated, revealing that both processes are endothermic and spontaneous.
Keywords: Desirability function, Biosorption, Heavy metals, Kinetic, Thermodynamic parameters
INTRODUCTION
Heavy metals are stable and persistent in environment because they are not degradable. They can endanger the environment and humans even in a small amount in water and waste waters [1] Pb(II) is one of the most hazardous materials whose toxicological effects in humans include inhibition of hemoglobin formation (anemia), sterility, hypertension, learning disabilities, abortion, kidney damage and mental retardation [1,2]. The permissible level of lead in drinking water is 0.05 mg l-1; therefore, the removal of lead from water is crucial to protect human and environmental health [3,4]. Copper(II) is another heavy metal ion which is harmful to human as the accumulation of
*Corresponding author. E-mail: [email protected]
this ion in human body can cause liver and brain damage, stomach upset and ulcer, skin and heart diseases, and so on [5]. The acceptable concentration of copper in drinking water is 1.3 mg l-1, so reduction of the ion concentration in aqueous solutions at least up to this acceptance level is crucial.
However, the success of adsorption process is highly dependent on the selection of experimental conditions leading to a maximum analyte adsorption. Additionally, the kinetic and thermodynamic studies of these processes depend on the optimal conditions of the process.
One-factor-at-a time (OFAT) is a traditional optimization method in which the effect of one factor at a time on an experimental response is monitored. Indeed, only one parameter is changed while keeping the other factors at fixed level. Its main drawback is that the interaction effects of the parameters are ignored among the factors studied. Therefore, this method does not depict the complete effects of the parameters on the response, which may lead to inaccurate optimal conditions. Another disadvantage of this technique is the large number of experiments needed to conduct the research. Indeed, it requires a lot of resources such as material, reagent and time. Experimental design methods and response surface methodology (RSM) [11,12] have been widely used to study the effects of factors simultaneously and to find the combination of factors producing the optimal conditions as well. Using these methods is advantageous, as it allows obtaining desirable condition with smaller number of systematic experiments; thus, saving time and expenses. However, when several responses of interest get involved in the analysis, the obtained results from response surface methodology are hardly analyzed. It is so because the optimal values for each response may be localized in different regions of the response surfaces; therefore it is difficult to find the conditions in which all responses are satisfied simultaneously. The more distant of these optimum regions is, the more difficulty is to find the common desirable conditions. An approach to overcome this problem is the use of a multi-criteria methodology. Harrington [13] introduced the desirability function as one of the multi-criteria approaches which was later improved and popularized by Derringer and Suich [14].
Recently, an immense research has focused on using different biomaterials as sorbents for the removal of heavy metals from aqueous solutions. Natural biomaterials are widely applied because of their relative abundance and low commercial value [15]. In addition, agricultural byproducts and plant wastes are used as biosorbents [16].
In this study, given that copper and lead are the common
contaminants of wastewater from various industries [17], activated carbons obtained from poplar leaves as an efficient, accessible and inexpensive biosorbent is used for the removal of Pb2+ and Cu2+ from aqueous solutions for the first time. The adsorption process is monitored with flame atomic absorption spectrophotometry due to its low cost, operational facility and high sample throughout. The main goal is achieving the maximum removal of the ions by investigating the effective experimental variables such as pH, biosorbent dose, contact time and temperature. The central composite design (CCD) combined with response surface methodology (RSM) using the desirability function (DF) is used as an efficient statistical method to find the common optimal conditions of the analyte adsorption. This kind of optimization helps us overcome synergic effect between Pb2+ and Cu2+ if it occurs [17]. Moreover, if the analytes are optimized individually, the number of required experiments increases twice. Therefore, the applied statistical method allows us obtaining sufficient information about this system with low number of experiments. Finally, for a mixture of ions, the equilibrium, kinetic and thermodynamic of ions adsorption process are elucidated at the common optimal conditions.
EXPERIMENTAL
Instruments and Reagents
All the chemicals and reagents and nitrate ions used in the present study were of analytical grade and used without further purification. They were purchased from Merck (Darmstadt, Germany). The pH of solutions was adjusted by the addition of either 0.1 M HCl or 0.1 M NaOH solutions. Double distilled water was used throughout the experiments and the stock solutions 1000 mg l-1 of nitrate ions were subsequently diluted with distilled water.
The Design-Expert, a statistical package software version 7.0.0 was used for experimental design analysis and their subsequent regression analysis. In this software, the model-fitting is done by the QR decomposition algorithm [18] on the design matrix to compute model coefficients. It also employs Nelder-Mead Simplex method (McKinnon 1999) for the optimization.
The linear fitting of the kinetic and equilibrium data was carried out through the “Linest” function embedded in Excel
software. This function helps us compute the linear parameters and their uncertainty as well [19].
Preparing and Characterizing the Adsorbent
Poplar autumnal leaves were collected from Semnan city and washed with tap water followed by distilled water to remove dirt. Then, they were dried in outdoors. Next, they were grinded and cut into small pieces (lower than 1 1 cm). Afterwards, they were put into an incinerator at 550 °C for 8 h to produce ashes. Finally, the ashes were washed with distilled water and dried in an oven at 90 °C for 24 h and kept for further studies.
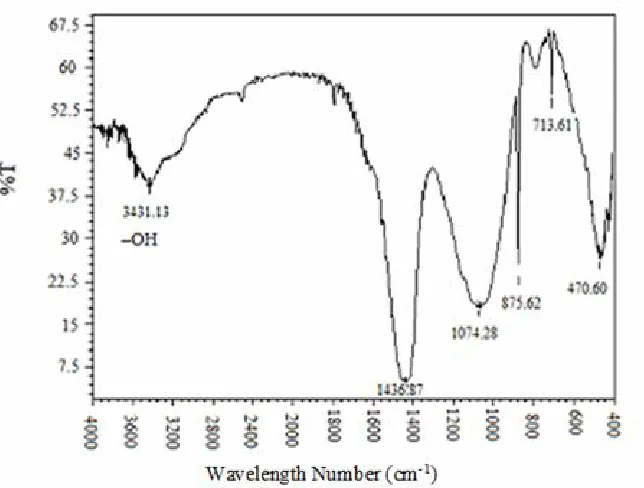
To identify some characteristic functional groups which are responsible for the sorption of the metal ions, Fourier transform infrared spectrum of the ashes is recorded and illustrated in Fig. 1.
The broad band at 3431 cm-1 are assigned to the amine and hydroxyl groups. The strong peak at 1436 cm-1 is attributed to NH stretching vibrations [20]. As reported in [21], Pb and Cu form strong binding with the ligands containing OH and NH groups. In poplar leaves, OH and NH groups enhance the removal of Pb2+ and Cu2+ ions from aqueous solutions.
Batch Adsorption Studies
To optimize the experimental factors such as pH, contact time, sorbent dose, and temperature on the removal of the binary system of Pb2+ and Cu2+ ions, twenty nine experimental conditions were defined based on central composite design (CCD). By preliminary experiments, a mixture solution of Pb2+ (150 mg l-1) and Cu2+ (120 mg l-1) with 50 ml volume was selected and examined at 30 experimental conditions. The following procedure was for each experiment: (1) the pH of solution was adjusted using 0.1 M HCl or NaOH solutions, (2) the temperature of
solution was adjusted, (3) a weighted amount of adsorbent was added to this solution, (4) the solution was transferred into 125 ml Erlenmeyer flasks, and was shaken in a thermostatic incubator at 200 rpm.
It should be mentioned that in the first step of the procedure, we do not conduct experiments in buffer media, because the cations of buffer may be adsorbed on the bioserbent leading to decrease the active surface of the biosorbent.At each experiment, the removal percentage of each ion, Pb2+ and Cu2+, was calculated as follows:
( ) 100
Re % 0 0 C C C
moval e (1)
where C0 (mg l-1) and Ce (mg l-1) are the initial and equilibrium ion concentrations.
The thermodynamic and isotherm parameters of the adsorption were determined by analyzing adsorbate concentration at various concentrations over different temperatures. The adsorption capacity at equilibrium state, qe (mg g-1), and time t, qt (mg g-1), were calculated as follows: W V C C q e e ) ( 0
(2)
where V (L) is the volume of the solution and W (g) is the mass of adsorbent. C0 (mg l-1) and Ce (mg l-1) are the same as in Eq. (1),
W V Ct C qt ) ( 0
(3)
where Ct (mg l-1) is the ion concentration at time t, and the other parameters are the same as in Eq. (2).
THEORETICAL BACKGROUND
Adsorption Isotherms
Langmuir Isotherm
The Langmuir adsorption, the monolayer adsorption, depends on these assumptions [22]:
Adsorption takes place at specific homogeneous sites within the adsorbent
Only, once an adsorbate molecule occupies a site without taking place a further adsorption at that site.
All sorption sites are the same and energetically equivalent.
The sorption of each sorbate molecule onto the surface equals to sorption activation energy.
The saturated or monolayer capacity can be expressed as the linear form of the Langmuir equation as follows:
max max
1
q C K q q
C e
L e
e (4)
where Ce is the equilibrium concentration of adsorbate (mg
l-1), qe is the amount of the equilibrium adsorbate per unit weight of the adsorbent (mg g-1), qmax is the monolayer capacity of the adsorbent (mg g-1) and KL is the Langmuir adsorption constant (l mg-1). qmax and KL can be computed by plotting Ce/qevs. Ce
The essential feature of the Langmuir isotherm can be shown by means of dimensionless equilibrium parameter RL defined by:
0
1 1
C K R
L L
(5)
where KL (l mg-1) is the Langmuir constant and C0 (mg l-1)
is the initial ion concentration. Theoretically, RL > 1 RL = 1, 0 < RL < 1 and RL = 0 show that an adsorption process is unfavorable, linear, favorable and irreversible, respectively.
Freundlich isotherm. The Freundlich equation is an empirical equation employed to describe the adsorption process. The linear form of the Freundlich equation can be represented as:
e F
e C
n K q ln 1ln
ln (6)
where qe is the equilibrium ion concentration on adsorbent (mg g-1), Ce is the equilibrium ion concentration in solution (mg l-1); KF (l g-1) and n are Freundlich constants. KF and n indicate the adsorption capacity of the adsorbent and a
measure of the deviation from linearity of the adsorption, respectively. When lnqe is plotted vs. lnCe, KF and n can be calculated from the intercept and slope of the regression model.
Tempkin isotherm. The Tempkin isotherm equation can be expressed as below:
qe = Bln(Ace) (7)
The linear form of it can be written as:
qe = BlnA + BlnCe (8)
where B = RT/b and A (l mg-1) are Tempkin constants representing the equilibrium binding and they can be determined from plotting of qevs. lnCe.
Adsorption Kinetics
While designing and optimizing a wastewater treatment, it is important to predict the removal rate of pollutants from aqueous solutions. There are four most common kinetic models for interpreting the adsorption process as described below.
Pseudo-first order kinetic model. In 1898, Lagergren proposed a pseudo-first-order equation, based on solid capaciy, for the sorption of liquid/solid systems. Accordingly, the rate of change occurred in sorbate uptake with the passage of time is directly proportional to the difference in the saturation concentration and the rate of solid uptake with time. The general Lagergren equation can be shown as:
ln(qe - qt) = lnqe - k1t (9)
where qe (mg g-1) and qt (mg g-1) are the same as in Eqs. (2) and (3). K1 is the first-order rate constant. Using the linear plot of ln(qe - qt) against time‘t’, the model parameters can be obtained.
Pseudo-second-order kinetic model. The sorption of Pb2+ and Cu2+ ions onto poplar leaves ashes following pseudo-second-order kinetics can be represented as:
t q q K q t e e t 1 1 2 2
(10)
where qt and qe are the same as in the above equation and k2 (g mg-1 min-1) is the pseudo-second- order rate constant for an adsorption process. The linear plot of ln(qe - qt) against time ‘t’ gives the parameters of the model.
Elovich kinetic model. Elovich equation is expressed as follows: q t t ln 1 ) ln( 1
(11)
where (mg g-1 min-1) is the initial adsorption rate and (g mg-1) is the desorption constant related to the extent of surface coverage and activation energy for chemisorption. The slope and the intercept of the plot of qtvs. lnt result in the determination of the kinetic constants, and.
Intraparticle diffusion kinetic model. To investigate the changes occurring in the concentration of sorbate onto sorbent with shaking time, the kinetic data of Pb2+ and Cu2+ ions sorption onto poplar leaves ashes were fitted into the following equation:
i id
t K t C
q 2
1
(12)
where qt is the same as mentioned previously. Kid is the rate constant of Morris-Weber transport calculated using the
slope of the linear plot of qt vs.. 2
1
t .
Adsorption Thermodynamics
The dependency of the biosorption process to the temperature is associated with several thermodynamic parameters such as Gibbs free energy change (ΔG°), enthalpy change (ΔH°) and entropy change (ΔS°) which can be obtained from the following equations:
ΔG° = -RTlnKc (13)
Kc = CAe/Ce (14)
Kc can also be expressed in terms of ΔH° (kJ mol-1) and ΔS° (J mol-1 K-1) as a function of temperature:
RT H R S Kc
ln (15)
ΔH° and ΔS° can be estimated from the slope and intercept of the plot of lnKcvs. 1/T.
RESULTS AND DISCUSSION
In this study, the ions adsorption process is optimized
via statistical experimental design methods, and then the quilibrium, kinetic and thermodynamic behaviors of the system were investigated at the optimal conditions.
Achieving
the
Optimal
Conditions
of
the
Adsorption Process
To obtain the optimal experimental conditions for the simultaneous removal of Pb2+ and Cu2+ ions from aqueous solutions, two steps of statistical methods were used. First, twenty nine experiments were designed based on CCD, and then (RSM), the relationship between the factors and the removal percentage of each ion were investigated using response surface methodology. Although RSM can optimize univariate responses, it does not lead to common optimal conditions for multivariate responses. Therefore, multiple response surface methodology based on desirability function was used to obtain the common optimal condition of both ions removal.
Central composite design and response surface methodology. Several classes of RSM, such as central composite design (CCD), Box-Behnken design and three-level factorial design, have different properties and characteristics. Amongst the three, CCD is the most popular technique in the estimation and evaluation of the main and interaction effects of variables with the least number of experiments.
A central composite design (CCD) is composed of N experiments as in the following equation:
N = 2k + 2k + k0 (16)
where k is the number of variables and k0 is the number of
center points [12] (Brown et al. 2009). In this work, according to the preliminary studies, four factors were considered in the optimization. The total experimental trials with one blocked design and 6 replicates was 30. The factors and their levels have been reported in Table 1. The behavior of this system is explained by the following empirical second order polynomial model equation:
j k i k j i ij i k i ii i k iiX X X X
Y 1 1 2 2 1 1
0
(17)
where Y is the response; i.e., the removal percentage of each ion. xis represent the variables, 0 is the constant term; is and iis show the coefficients of the linear and quadratic parameters, respectively. ijs are the coefficients of the interaction parameters xi and xj and ε is the residual associated to the experiments. The adequacy of the model is tested by the analysis of variance method (AVOVA). Based on ANOVA analysis, the following equations were defined to show the relationship between the removal percentage of each ion and experimental real factors:
Ypb = 44.29 – 16.45X1 – 0.35X2 + 140.08X3 + 0.87X4 + 0.13X1X2 + 112.06X1X3 (18)
YCu = -55.38 + 38.11X1 + 0.17X2 + 442.6X3 - 6.13X4 - 8.12X2X3 + 0.05X2X4 + 31.62X3X4 – 3.57X21 + 0.05X24 (19)
indicating a reasonable correlation between the response and the independent variables for both analytes. Although for both analytes, R2 values are not high, they are still reasonable. Also, adjusted regression coefficients R2adj = 0.66 and 0.83 for Pb2+ and Cu2+, respectively, are in
reasonable agreement with their counterparts R2, indicating the significance of the proposed model.
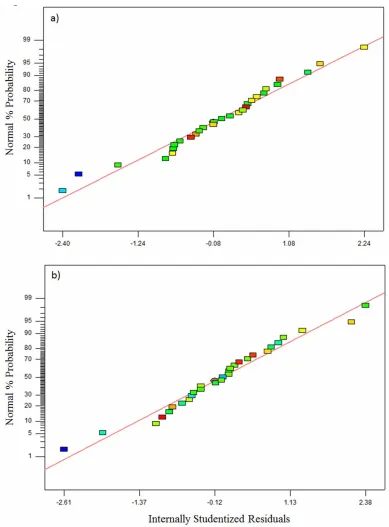
The normality the residuals plots of (Fig. 2) of responses for both ions as a diagnostic test confirmed both the suggested models.
Table 1. Factors and Their Levels in CCD Design with = 2
Factors Real levels and their coded values in parenthesis
Axial (-) Low (-1) Central (0) High (+1) Axial (+)
X1: pH 2.00 3.05 4.40 5.15 6.20
X2: Time (min) 10 30 50 70 90
X3: Adsorbent dose (g) 0.040 0.065 0.090 0.115 0.140
X4: Temperature (°C) 5 11 18 24 30
Table 2. Analysis of Variance (ANOVA) Result for the Model of Pb2+
Source of variation Sum of square Dfa P-value
Model
X1
X2
X3
X4
X1X2
X1X3
Residuals
Lack of fit (LOF)
Pure error
Total
7933.79
2.45
313.82
4730.48
633.04
176.23
198.32
3263.92
2796.01
467.91
11366.51
6
1
1
1
1
1
1
23
18
5
29
<0.0001
0.08921
0.1343
<0.0001
0.0380
0.2565
0.2296
0.3456
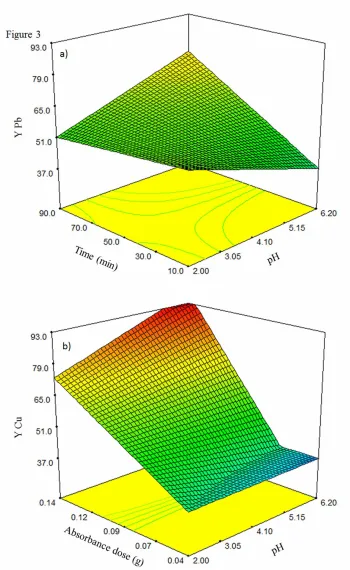
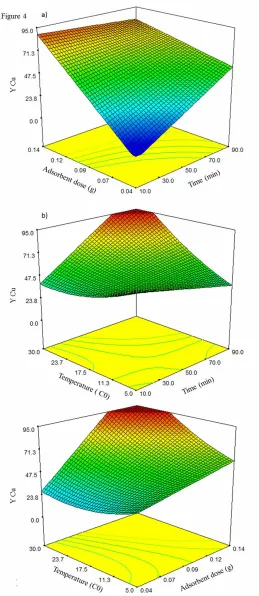
To portray the interaction effects in the models of ions, the three-dimensional (3D) response surfaces were plotted based on Eqs. (18) and (19) for Pb2+ and Cu2+, respectively; when the amount of two factors are fixed at the central point and the others are allowed to vary. For example, Fig. 3a shows a 3-D plot of Pb+2 removal versus pH and time other factors are fixed: the adsorbent dose = 0.09 g l-1 and temperature = 18 °C. Figures 3 and 4 illustrate the different response surfaces of Pb2+ and Cu2+, respectively. In these figures, the curvatures of the plots indicate the interaction between the factors. The existence of interaction means that the factors may affect the response interactively and not independently. So their combined effect is greater or less sharper than that of what is expected for the straight addition of the effects.
As seen in Figs. 3 and 4, the shapes of the responses of analytes are different, so the conditions where the maximum recovery of the analytes occurs cannot be achieved by RSM. Also, according to Tables 2 and 3, and model Eqs. (18) and
(19), number of the significant factors is not the same for the analytes. Moreover, the effect of the factors and their interactions are different. So it is not supposed the individual optimization to be equivalent to simultaneous optimization. Here, the goal of this study is finding experimental conditions in which both Pb2+ and Cu2+ ions can be removed from aqueous solutions with high efficiency, a fact which is not possible using RSM. This problem can be overcome by using multiple response surface methodology (MRS) as will be described in the following section.
Multiple response surface methodology. One of the most widely used methods in MRS for optimization studies is desirability function [12-14] in which multiple responses ae reduced to a single aggregated function and then solved as a single objective optimization.
Desirability Function (DF)
In this method, each individual response predicted is
Table 3. Analysis of Variance (ANOVA) Result for the Model of Cu2+
Source of variation Sum of square Dfa P-value
Model
X1
X2
X3
X4
X2X3
X2X4
X3X4
X21
X24
Residuals
Lack of fit (LOF)
transformed to a partial desirability function (dfi) which varies from zero (undesirable response) to one (optimal
response) based on the Derringer and Suich equation as follows (Derringer 1980) [14]:
R R df wi i ,
dfi = 1, R >
dfi = 0, R < (20)
where and are the lowest and highest values of ith response, respectively, and wi is the weight of each response. DF as the overall optimization function is computed by geometric mean of different dfi values as follows:
...
, 0 1( 1,2,..., )1 2
2 1
1 df df vi i n
df
DF vn n
n v v
(21)
n i i 1 1 where dfi indicates the individual desirability of the response Ri (i = 1,2,3, ... ,n) and vi shows the importance of ith response. Indeed, DF is the collected measure of all responses Ri’s and it is optimized over the independent variable domain by any existing univariate search technique. Here, the goal of optimization is finding the conditions in which the maximum removal of both Pb2+ and Cu2+ occurs; therefore, the desirability function was maximized. Figure 5 illustrates the desirability plot as a function of time (min) and pH at a fixed level of adsorbent dose=0.14g, corresponding to (+α) level of this factor, and temperature = 28 °C for the simultaneous removal of Pb2+ and Cu2+. Finally, the optimal experimental conditions for simultaneous removal of Pb2+ and Cu2+ was achieved at factor vales: pH = 5.43, contact time = 23 min, adsorbent dosage = 0.14 g and temperature 28 °C.
This condition was used to investigate the equilibrium and kinetic models of the adsorption process of metal ions to determine the thermodynamic and kinetic parameters of the system.
Adsorption Isotherms
In this study, the equilibrium experimental data for adsorbed Pb2+ and Cu2+ on poplar leaves ashes were
analyzed using three isotherm models (Eqs. (4)-(8)). Each model was examined at four levels of temperature to find the most superior and robust model.
Isotherm constants and R2 of each model were calculated and reported in Table 4. As seen in this table, Freundlich and Tempkin isotherms represent low value of R2 indicating that none of the adsorption processes can be interpreted by this models. However, a high R2 value of Langmuir isotherms shows the superiority of this model to interpret the adsorption processes of Pb2+ and Cu2+ ions. Moreover, the values of RL varies between 0 and 1, indicating a favorable adsorption for Pb2+ and Cu2+ onto the poplar leaves ashes. Meantime, the results showed that the maximum adsorption capacity can vary in the range of 67.11-70.13 mg g-1 and 52.25-6273 mg g-1 for Pb2+ and Cu2+, respectively. Alslaibi applied olive stone activated carbon (OSAC) for the removal of heavy metals that the highest value of adsorption capacity on the OSAC was obtained 23.47 mg g-1 and 22.73 mg g-1 for Cu2+ and Pb2+, respectively [23]. Moreover, in our work, the removal efficiencies of Pb2+ and Cu2+ were 92.8% and 94.9%, respectively, which are in good agreement with the reported results in [23]. Their results showed 98.55% removal of Cu2+ and 98.83% of Pb2+. The comparison of the present results with the previous ones indicated the successful application of poplar leaves ashes as a biosorbent for the removal of Cu2+ and Pb2+.
Adsorption Kinetics
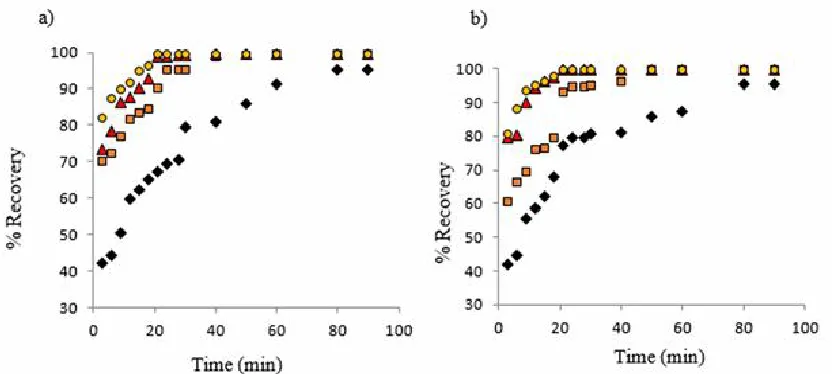
To study the robust kinetic models of the adsorption process of Pb2+ and Cu2+ onto poplar leaves ashes, the experimental data were obtained at the optimum concentration of the ions and four levels of temperature. 50 ml of solution of Pb2+ (150 mg l-1) and Cu2+ (120 mg l-1), in optimal conditions (pH = 5.68, dose of adsorbent = 0.14) was shaken for 3, 6, 9, 12, 15, 18, 21, 24, 28, 30, 40, 50, 60, 80 and 90 min in a thermostatic incubator at 200 rpm. These batch experiments were conducted at four temperatures 284.15 K, 291.15 K, 297.15 K and 303.15 K, and the corresponding data are shown in Figs. 6a and b for Pb2+ and Cu2+, respectively.
and reported in Table 5.
Based on the R2 coefficient values, it can be inferred that the pseudo-second-order model agrees with the experimental data. The kinetic parameters, qe and k2 and their uncertainties were calculated and reported in Table 6 for Pb2+ and Cu2+. The uncertainty of qe was computed based on the standard deviation of the slope, while the uncertainty of k2 was calculated based on the standard deviation of slope and intercept because of the error propagation. Moreover, It can be seen that for both analytes calculated qe and experimental qe are in good agreement, further evidencing that the analytes adsorptions obey the pseudo-second-order kinetic model.
The rate constant of this model can be expressed as a function of temperature by the following Arrhenius relationship:
RT E A
k a
ln
ln 2 (22)
where Ea (kJ mol-1) is the Arrhenius activation energy of adsorption, A is the Arrhenius factor, R and T are the same
as in Eq. (19). The linear plots of lnk2 vs. 1/T for the adsorption of Pb2+ and Cu2+ ions onto poplar leaves ash were constructed to generate the activation energies from the slope (-Ea/R). The calculated Ea (kJ mol-1) values were 0.57 (±0.16) and 0.62 (±0.13) for Pb2+ and Cu2+, respectively.
The chemical (chemisorption) or physical (physisorption) adsorption mechanisms are often important indicator to explain the type of interactions between adsorbate and adsorbent. The magnitude of an activation energy is indicative of the nature of adsorption, whether physical or chemical. Activation energies ranging between 5-40 kJ mol-1 and 40-800 kJ mol-1 are attributed to the physisorption and chemisorption, respectively. The result obtained for the adsorption of Pb2+ and Cu2+ ions onto poplar leaves ash indicate that the adsorption has a low potential barrier and it may correspond to a physisorption mechanism for both analytes.
Adsorption Thermodynamics
The experimental results at different temperatures for both analytes showed that the higher temperature, leads to
the more biosorption capacity for poplar leaves ash (Table 4). It might be due to either increase in the number of active sites present on the surface of the biosorbent or the increase of the attractive forces between the metal ions and the biosorbent. The correlation between temperature and the
biosorption capacity indicates that adsorption of Pb2+ and Cu2+ are endothermic in nature.
For both ions, the equilibrium constants Kcs, were calculated at different Ts and ΔG° (kJ mol-1) based on Eqs. (13) and (14), as reported in Table 7. The negative values of
Table 4. Isotherm Constant Parameters and Correlation Coefficients for the Adsorption of Pb2+ and Cu2+ at Different Temperatures
Isotherm
models
Parameters Pb2+ Cu2+
Temp. (K) 284.15 291.15 297.15 303.15 284.15 291.15 297.15 303.15
Freundlich R2 0.9742 0.8805 0.7492 0.6960 0.9162 0.9165 0.9299 0.8885
Tempkin R2 0.9779 0.8957 0.7751 0.7242 0.8754 0.9248 0.9417 0.9024
R2 0.9978 0.9982 0.9984 0.9982 0.9809 0.9945 0.9989 0.9994
KL 0.526 1.644 2.854 9.714 0.547 1.049 2.733 23.143
qmax (calc.) 67.11 69.93 72.99 73.53 55.25 58.82 60.98 61.73 Langmuir
RL 0.011 0.003 0.002 0.001 0.013 0.007 0.003 0.0003
Table 5. Correlation Coefficients (R2) in Pb2+ (150 mg l-1) and Cu2+ (120 mg l-1) Adsorption for Different Kinetic Models at Different Temperatures
R2 at different temperature
(K) Kinetic models
284.15 291.15 297.15 303.15
Pseudo-first order 0.9109 0.9595 0.8875 0.7645
Pseudo-second order 0.9904 0.9992 0.9994 0.9998
Elovich 0.9671 0.9116 0.8310 0.8191
Pb2+ adsorption
intraparticle diffusion 0.8981 0.5976 0.5010 0.4142
Pseudo-first order 0.9133 0.9105 0.9269 0.7870
Pseudo-second order 0.9938 0.9976 0.9998 0.9999
Elovich 0.9609 0.8812 0.7562 0.7636
Cu2+ adsorption
ΔG° reveal that the sorption of Pb2+ and Cu2+ onto the poplar leaves ash is a spontaneous process and thermodynamically favorable under the experimental conditions. The Gibbs free energy (ΔG°) is small and negative, but it increases with the raising temperature. ΔH° and ΔS° were estimated from the slope and intercept of the plot of lnKcvs. 1/T (Eq. (15)), as reported in Table 8. The positive values of ΔHo suggest that the
biosorption of Pb2+ and Cu2+ onto the poplar leaves ash are endothermic. The negative values of ΔS° indicate the decreased randomness of adsorbate ions on the solid surface than in solution.
Poplar tree leaves as an inexpensive, accessible and suitable adsorbent were successfully used for the simultaneous removal of Pb(II) and Cu(II) from aqueous solutions in a batch system. The simultaneous optimization
Fig. 6. Experimental data for the kinetic adsorption of (a) Pb2+ (150 mg l-1) and (b) Cu2+ (120 mg l-1), at different temperatures.
Table 6. Parameters of Pseudo-second Order Kinetic Model in Pb2+ (120 mg l-1) and Cu2+ (120 mg l-1) Adsorption at Different Tempretures
Temperature
(K) Ions Parameters
284.15 291.15 297.15 303.15
k2 0.0133 (±0.0047) 0.0187 (±0.0047) 0.0341 (±0.0094) 0.1700 (±0.0450)
qe (exp.) 51.50 53.30 53.70 53.80
Pb2+
qe (calc.) 43.81 (±0.32) 43.89 (±0.21) 43.59 (±0.18) 43.25 (±0.04)
k2 0.0031 (±0.0030) 0.0065 (±0.0042) 0.0302 (±0.0076) 0.0334 (±0.0052)
qe (exp.) 41.70 42.80 43.00 43.20
Cu2+
of the ions adsorption process was performed by means of the CCD and RSM methods coupled with desirability function. Different equilibrium and kinetic models were evaluated for the processes at the optimal conditions obtained from the experimental design. Equilibrium data showed that the adsorption process of both ions follow the Langmuir model and kinetic studies suggested pseudo-second-order kinetic model as the best model for describing the adsorption process. In addition, thermodynamic parameters such as ΔGo, ΔHo and ΔS°were calculated. The ΔGo values were negative, meaning that the processes were spontaneous in nature. The positive values of ΔHo revealed that the adsorption process of both analytes were physiosorption and endothermic in nature. The negative
values of ΔS° implied decreased randomness of adsorbate ions on the solid surface than in solution.
ACKNOWLEDGEMENTS
Financial support from Semnan University is gratefully acknowledged.
REFERENCES
[1] X. Tang, Q. Zhang, Z. Liu, K. Pan, Y. Dong, Y. Li, J. Mol. Liq. 199 (2014) 401.
[2] B. Dumitru, B. Laura, Bioresour. Technol. 129 (2013) 374.
Table 7. Equilibrium Xonstants Kc and ΔG° (kJ mol-1) for the Adsorption Processes of Pb2+ and Cu2+ on Poplar ash Leaves at Different Temperatures
Temperature
(K) Ions Parameter
284.15 291.15 297.15 303.15
Kc 9.70 35.67 71.67 216.00
Pb2+
ΔG◦ (kJ mol-1) -2.33 -3.75 -4.58 -5.88
Kc 7.36 25.38 59.67 89.67
Cu2+
ΔG° (kJ mol-1) -2.04 -3.40 -4.39 -4.92
Table 8. Thermodynamic Parameters for the Adsorption of Pb2+ and Cu2+ onto Poplar Leave Ash
Metal ions Thermodynamic parameters
Pb2+ Cu2+
R2 0.9728 0.9930
ΔS (K mol-1) 0.02 (±2 × 10⁻⁴) 0.04 (±1 × 10⁻⁴)
[3] W. Meng-Wei, K. Chi-Chuan, B.D. Rogel, M.L.P. Dalida, Carbohydr. Polym. 80 (2010) 891.
[4] F. Boudrahem, A. Soualah, F. Aissani-Benissad, J. Chem. Eng. Data 56 (2011) 1946.
[5] Q. Zhong, Q.Y. Yue, Q. Li, B.Y. Gao, X. Xu, Carbohydr. Polym. 111 (2014) 788.
[6] I. Anastopoulos, G.Z. Kyzas, J. Mol. Liq. 209 (2015) 77.
[7] Q. Chang, G. Wang, Chem. Eng. Sci. 62 (2007) 4636. [8] B. Alyüz, S. Veli, J. Hazard. Mater. 167 (2009) 482. [9] A. Shafaei, M. Rezayee, M. Arami, M. Nikazar, Desal.
260 (2010) 23.
[10] D. Riazatia, B. Aibaghi-Esfahani, M. Fayazi, M. Ghanei-Motlagh, Anal. Bioanal. Chem. Res. 2 (2015) 1.
[11] G.E.P. Box, N.R. Draper, Empirical Model-Building and Response Surfaces, Wiley, New York, 1987. [12] S.D. Brown, R. Tauler, B. Walczak, Comprehensive
Chemometrics Chemical and Biochemical Data
Analyses 1 (2009) 346.
[13] E.C. Harrington, Indust. Qual. Cont. 1 (1965) 494. [14] G. Derringer, R. Suich, Qual. Technol. 12 (1980) 214. [15] M. Anbia, M. Khazaei, J. Chem. Chem. Eng. 33
(2014) 29.
[16] N. Kim, M. Park, D. Park, Bioresour. Technol. 175 (2015) 629.
[17] M. Iqbal, R.G.J. Edyvean, Miner. Eng. 17 (2004) 217. [18] J.J. Dongarra, C.B. Moler, J.R. Bunch, G.W. Stewart,
Linpak User’s Guid, e, Chap. 9, Siam, 1979.
[19] A. Naseri, S.R. Nabavi, M. Pirouzmand, S. Sheykhizadeh Mizan, Computer Application in Chemistry. University of Tabriz, Iran, 2016.
[20] N. Kanagathara, P. Shenbagarajan, C.E. Jeyanthi, M. Thirunavukkarasu, Int. J. Pharm. Bio. Sci. 1 (2011) 52. [21] J. Wang, C. Chen, Biotechnol. Adv. 27 (2009) 195. [22] I. Langmuir, J. Am. Chem. Soc. 40 (1918) 1361. [23] T.M. Alslaibi, I. Abustan, M.A. Ahmad, A.A. Foul, J.