*Corresponding author:[email protected] 14
Liquid-Liquid Equilibrium Data Prediction using Large Margin
Nearest Neighbor
M. Pirdashti1*, K. Movagharnejad1, S. Curteanu2, F. Leon3, F. Rahimpour4
1Faculty of Chemical Engineering, Babol University of Technology, PO Box, 484, Babol, Iran
2Department of Chemical Engineering, Faculty of Chemical Engineering and Environmental Protection,“Gheorghe Asachi” Technical University of Iaşi, Str. Prof. Dr. Doc. DimitrieMangeron, nr. 73, 700050, Iaşi, Romania 3Department of Computer Science and Engineering, Faculty of Automatic Control and Computer Engineering,
“Gheorghe Asachi” Technical University of Iaşi, Str. Prof. Dr. Doc. DimitrieMangeron, nr. 27, 700050, Iaşi, Romania
4Biotechnology Research Lab, Chemical Engineering Department, Faculty of Engineering, Razi University,
Kermanshah 67149-67346, Iran
ARTICLE INFO ABSTRACT
Article history: Received: 2015-11-08 Accepted: 2016-02-03
Guanidine hydrochloride has been widely used in the initial recovery steps of active protein from the inclusion bodies in aqueous two-phase system (ATPS). Knowledge of the guanidine hydrochloride effect on the liquid-liquid equilibrium (LLE) phase diagram behavior is still inadequate and no comprehensive theory exists for the prediction of the experimental trends. Therefore, the effect of the guanidine hydrochloride on the phase behavior of PEG4000+potassium phosphate+ water system at different guanidine hydrochloride concentrations and pH was investigated in this study. To fill the theoretical gaps, the typical support vector machines were applied was applied to the k-nearest neighbor method in order to develop a regression model to predict the LLE equilibrium of guanidine hydrochloride in the above mentioned system. Its advantage is its simplicity and good performance, with the disadvantage of an increase in the execution time. The results of our method are quite promising; they were clearly better than those obtained by well-established methods such as Support Vector Machines, k-Nearest Neighbor and Random Forest. It is shown that the obtained results are more adequate than those provided by other common machine learning algorithms.
Keywords:
Liquid-Liquid Equilibrium Aqueous Two Phase System Nearest Neighbor
Large Margin Regression Analysis
1. Introduction
Aqueous two-phase system (ATPS) is formed by mixing certain amounts of two polymers or
Iranian Journal of Chemical Engineering, Vol. 13, No. 4 (Autumn 2016) 15 its multiple advantages including: biologic
compatibility [2], ease of continuous process [3-8], low interfacial tension [9], short processing time[10], low material cost [11,12], low energy consumption [13,14], good resolution [15], high yield [16], relatively high load capacity [17], scaling up feasibility [18-20], selective extraction [21], separation of metal ions [22-25] and efficient procedure for separation of various biological materials such as recombinant proteins and enzymes [26-32].
Inclusion body refolding processes play a major role in the production of recombinant proteins. One step of the general strategy used to recover active protein from inclusion bodies is the solubilization of aggregated inclusion bodies with denaturant such as guanidine hydrochloride and urea [33]. Several articles have been published about applying guanidine hydrochloride and urea in ATPS for the initial recovery step [26,34], but little has been published about the complex problem of how the guanidine hydrochloride (GuHCl) and urea affect the phase diagram behavior and
determine the partition coefficient of
guanidine hydrochloride and urea in ATPS. Novel bio-separation research based on aqueous two-phase systems needs to focus on determining phase diagrams, partition coefficients and other thermodynamic data for the design of industrial-scale processes. Knowledge about the mechanisms involved in the partitioning equilibrium of macromolecules is poor and, consequently, there is no comprehensive theory capable of predicting the experimental trends. The method development is fairly empirical and so, despite these favorable features, ATPSs
have not been extensively adopted in either industrial processes or commercial applications [19,20].
16 Iranian Journal of Chemical Engineering, Vol. 13, No. 4 (Autumn 2016)
range of affected factors such as pH, salt and polymer concentrations. So, many researchers have tried to develop generalized correlations to predict the partition coefficients of chaotropic compounds and their effects on the phase diagram in ATPS systems, especially based on artificial neural networks [43-46]. Also, Pirdashti et al. [47] predicted the partition coefficients of guanidine hydrochloride in PEG–phosphate systems using neural networks developed with differential evolution algorithm. Generally, artificial neural networks have been widely applied, alone or in combination with other artificial intelligence techniques, for modeling and optimization of different complex processes [49-55].
In the present study, the effect of the guanidine hydrochloride on phase behavior of
PEG4000/ phosphate/ guanidine hydrochloride/ water at different guanidine hydrochloride concentrations and pH was investigated experimentally and by simulation. A new regression algorithm was proposed, based on the k-nearest neighbor paradigm where the distance metric is optimized using the large margin concept typical of support vector machines. The optimization problem is solved by means of an evolutionary algorithm. The main advantage of the developed algorithm is that it requires virtually no tuning, and its results are better than those obtained by other regression methods. The downside is its increased execution time,
caused by the heuristic evolutionary
optimization.
The obtained results would be useful to increase the knowledge of aqueous two-phase separation process and improve the yield of
protein refolding.
2. Experimental 2.1. Materials
Polyethylene glycol, with a mass average 4000g/mol, di-potassium hydrogen phosphate and sodium di-hydrogen phosphate were of analytical grade (Merck) and were used without further purification. Guanidine hydrochloride was purchased from Sigma-Aldrich. Distilled water was used in all experiments. All other materials were analytical grade.
2.2. Apparatus and procedure
The flow chart of methodology for processing the experimental data is described in Fig. 1. In the first phase, a mixture of PEG 4000, guanidine hydrochloride and phosphate salt solution at a determined pH was prepared. The top and bottom phases were separated in the next phase. In the third section, the components of each phase were analyzed.
2.2.1. Preparation of the aqueous two-phase systems
Iranian Journal of Chemical Engineering, Vol. 13, No. 4 (Autumn 2016) 17 Figure1. Methodology for measurement of ATPS components in the presence of guanidine hydrochloride.
powder or as stock solution at constant pH and temperature (298.15 K), resulting in a 10 g system. The pH values of the solutions were measured precisely with a pH meter of JENWAY 3345 model. In order to speed up the phase separation, the resulting solution was mixed by vortex test tube vigorously for 2 minutes and centrifuged at 2400 rpm for 10 min. Then, the tubes were placed in 298.15 K for 24 h; after the solution reached equilibrium, the samples of the top and bottom phases were carefully extracted, in order to leave a layer of solution at least 0.5 cm thick above the interface.
2.2.2. Measurement of salt concentration
The analysis methods for salt concentrations (K2HPO4, NaH2PO4) were carried out by
using atomic absorption spectroscopy (AAS), Shimadzu AA-6300 model.
2.2.3. Measurement of guanidine hydrochloride concentration
The concentration of guanidine hydrochloride was determined by conductometer at 298.15K, using a JENWAY 4510 model. Since the conductivity of phase samples depends on both guanidine hydrochloride and salt concentration, but is independent of PEG concentration, calibration plots of conductivity versus guanidine hydrochloride concentration were prepared for different concentrations of salt. An example of calibration plot for
guanidine hydrochloride/K2HPO4/ water
system is shown in Fig. 2.
18 Iranian Journal of Chemical Engineering, Vol. 13, No. 4 (Autumn 2016)
Figure 2. Conductivity calibration curves for PEG (4000) - K2HPO4-water at 298.15K.
2.2.4. Measurement of PEG concentration
The concentration of PEG was obtained by refractive index measurements at 298.15K using an ATAGO-DTM1 model. Since the refractive index of phase samples depends on PEG, guanidine hydrochloride, and salt concentration, calibration plots of refractive index versus polymer concentration were prepared for different concentrations of salt and guanidine hydrochloride.
3. Modeling methodology
Regression analysis includes any technique for modeling different kinds of processes with the goal of finding a relationship between a dependent variable and one or more independent variables, given a set of training instances or vectors in the form of (xi, yi)
pairs, where xi are the inputs and yi is the
output of a sample. There are many regression methods; in addition to analytical models,
where the task is to find adequate values for the coefficients, usually by means of differential optimization; several machine learning techniques such as: neural networks, support vector machines (ε-SVR, ν-SVR), decision trees (M5P, Random Forest, REPTree) or rules (M5, Decision Table), etc. can be mentioned.
k-Nearest Neighbor (kNN) [49] is a simple, efficient way to estimate the value of the unknown function in a query point, using its values in other known points. A more elaborate version of the method considers a weighted average, where the weight of each neighbor depends on its proximity to the query point and it is usually considered as the inverse of the squared Euclidian distance between the query point and its nearest neighbor. However, the classical approach does not take into account any information about a particular problem. Besides the
♦ Salt=10[w/w %] ■ Salt=15[w/w %] ▲ Salt=20[w/w %] ■ Salt=25[w/w %] ● Salt=30[w/w %]
Iranian Journal of Chemical Engineering, Vol. 13, No. 4 (Autumn 2016) 19 common practice of normalizing the instance
values independently on all dimensions, there is little domain knowledge incorporated into the method.
Because of the importance of the distance metric, researchers seek to find ways to adapt it to the problem at hand in order to yield better performance. This is the issue of distance metric learning [50-52, 57]. The idea of a large margin, one of the fundamental ideas of support vector machines, was transferred to the kNN method for classification tasks [58-60], resulting in the large-margin nearest neighbor method (LMNN). In general, distance metric learning aims at finding a linear transformationx'=Lx, such that the distance between two vectors xi
andxjbecomes:
𝑑𝑑𝐿𝐿(𝐱𝐱𝑖𝑖,𝐱𝐱𝑗𝑗) =�𝐋𝐋�𝐱𝐱𝑖𝑖 − 𝐱𝐱𝑗𝑗��2 (1)
Since all the operations in k-nearest neighbor classification or regression can be expressed in terms of square distances, an alternative way of stating the transformation is by means
of the square matrix:
M
=
L
TL
, and thus the square distance is:𝑑𝑑𝑀𝑀(𝐱𝐱𝑖𝑖,𝐱𝐱𝑗𝑗) =�𝐱𝐱𝑖𝑖− 𝐱𝐱𝑗𝑗�𝑇𝑇𝐌𝐌�𝐱𝐱𝑖𝑖 − 𝐱𝐱𝑗𝑗� (2)
For a classification problem, the choice of L, or equivalently M, aims at minimizing the distance between a vector xiand its k target neighborsxj, where a target signifies a neighbor that belongs to the same class. At the same time, the distance between a vector and
the impostors xl, i.e. neighbors that belong to a different class, should be maximized. In order to establish a large margin between the vectors that belong to different classes, the
following relation is imposed:
𝑑𝑑𝑀𝑀(𝐱𝐱𝑖𝑖,𝐱𝐱𝑙𝑙)≥ 1 +𝑑𝑑𝑀𝑀(𝐱𝐱𝑖𝑖,𝐱𝐱𝑗𝑗) (3)
Here, the value of 1 is arbitrary; the idea is to have some minimum value for the margin that separates the classes. However, it is proven that other minimum values for the margin would not change the nature of the optimization problem, but would only result in the scaling of the matrix M.
Overall, the optimization problem is defined as follows:
Min
� 𝜂𝜂𝑖𝑖𝑗𝑗𝑑𝑑𝑖𝑖𝑗𝑗+λℎ� 𝜈𝜈𝑖𝑖𝑗𝑗𝑙𝑙𝜉𝜉𝑖𝑖𝑗𝑗𝑙𝑙 𝑖𝑖𝑗𝑗𝑙𝑙
𝑖𝑖𝑗𝑗
such that �𝐱𝐱
𝑖𝑖− 𝐱𝐱𝑗𝑗�𝑇𝑇𝐌𝐌�𝐱𝐱𝑖𝑖 − 𝐱𝐱𝑗𝑗�=𝑑𝑑𝑖𝑖𝑗𝑗
(𝐱𝐱𝑖𝑖 − 𝐱𝐱𝑙𝑙)𝑇𝑇𝐌𝐌(𝐱𝐱𝑖𝑖 − 𝐱𝐱𝑙𝑙)− 𝑑𝑑𝑖𝑖𝑗𝑗
≥ 1− 𝜉𝜉𝑖𝑖𝑗𝑗𝑙𝑙
𝐌𝐌 ≥ 0, 𝜉𝜉𝑖𝑖𝑗𝑗𝑙𝑙 ≥ 0,∀𝑖𝑖,𝑗𝑗,𝑙𝑙 (4)
whereηij∈{0,1} is 1 only when xj is a target neighbor of xi, νijl =ηij if and only if yi ≠ yl
and 0 otherwise, dij is the distance between xi
and xj, ξijl is the hinge loss [61] and λh ≥0 is
a constant.
The two objectives of minimizing the distance to targets and maximizing the distance to impostors are conflicting. Following an analogy to attraction and repulsion forces in physics, Weinberger et al.(2005) [58] introduce two forces, εpull and
εpush, whose balance is reached by setting the
value of λh. In their work, the authors consider
the importance of these forces to be equal, i.e. λh = 1.
20 Iranian Journal of Chemical Engineering, Vol. 13, No. 4 (Autumn 2016)
Neighbor for Regression (LMNNR) method.
L (and thus M) is considered to be diagonal matrix. This increases the clarity of the results, because in this case the elements mii can be
interpreted as the weights of the problem input dimensions, and are also a form of regularization.
By using the M matrix, the relation between the neighbor weights and the distance is:
𝑤𝑤𝑑𝑑𝑀𝑀(𝑥𝑥,𝑥𝑥′) =
1
𝑑𝑑𝑀𝑀(𝑥𝑥,𝑥𝑥′) =
1
∑𝑛𝑛
𝑖𝑖=1𝑚𝑚𝑖𝑖𝑖𝑖 ⋅(𝑥𝑥𝑖𝑖 − 𝑥𝑥′𝑖𝑖)2 (5)
The optimization problem presented in equation 4 is solved by means of an evolutionary algorithm, with the following parameters: 40 chromosomes in the population, tournament selection with 2 candidates, arithmetic crossover with a probability of 95 % and mutation with a probability of 5 % in which a gene value is reinitialized to a random value in its corresponding domain of definition. Elitism was also used such that the best solution in a generation is never lost. As a stopping criterion, a maximum number of generations, 500 in our case, was used. The number of genes in a chromosome depends on the number of prototypes and the dimensionality of the problem, namely: ng =np⋅ni, where ng
is the number of genes, np is the number of
prototypes and ni is the number of inputs.
The domain of the genes, which represents the elements of L, is [10–3, 10]. All the
operations in the software implementation deal with the elements of M, i.e. their squares. Thus it can be considered that the corresponding values of the M elements lie in
the [10–6, 100] domain.
The fitness function F, which is to be minimized, takes into account 2 criteria:
𝐹𝐹 =𝑤𝑤1𝐹𝐹⋅ 𝐹𝐹1+𝑤𝑤2𝐹𝐹⋅ 𝐹𝐹2 (6)
where the weights of the criteria are normalized:𝑤𝑤1𝐹𝐹+𝑤𝑤2𝐹𝐹 = 1.
In order to simplify the expressions of the Fi
functions, the following notations are made: where dM means the weighted square distance
function using the weights search is made for: 𝑑𝑑𝑖𝑖𝑗𝑗 = 𝑑𝑑𝑀𝑀�𝑥𝑥𝑖𝑖,𝑥𝑥𝑗𝑗�, 𝑑𝑑𝑖𝑖𝑖𝑖 =𝑑𝑑𝑀𝑀(𝑥𝑥𝑖𝑖,𝑥𝑥𝑖𝑖), 𝑔𝑔𝑖𝑖𝑗𝑗 =
�𝑓𝑓(𝑥𝑥𝑖𝑖)− 𝑓𝑓(𝑥𝑥𝑗𝑗)� and 𝑔𝑔𝑖𝑖𝑖𝑖 = |𝑓𝑓(𝑥𝑥𝑖𝑖)− 𝑓𝑓(𝑥𝑥𝑖𝑖)|.
Thus, the first criterion is:
𝐹𝐹1 =�
𝑛𝑛
𝑖𝑖=1�𝑗𝑗∈𝑁𝑁(𝑖𝑖)𝑑𝑑𝑖𝑖𝑗𝑗⋅ �1− 𝑔𝑔𝑖𝑖𝑗𝑗� (7)
Where N(i) is the set of the nearest k neighbors of instance i, in our case k = 3. Basically, this criterion says that the nearest neighbors of i should have similar values to the one of i, and more distant ones should have different values. This criterion tries to minimize the distance between an instance i and its neighbors with similar values. If a neighbor j has a dissimilar value, the second factor, 1− 𝑔𝑔𝑖𝑖𝑗𝑗, becomes small and is no
longer necessary to minimize the distance. The second criterion is expressed as follows:
𝐹𝐹2 = �
𝑛𝑛
𝑖𝑖=1�𝑗𝑗∈𝑁𝑁(𝑖𝑖)�𝑙𝑙∈𝑁𝑁(𝑖𝑖)max (1 +𝑑𝑑𝑖𝑖𝑗𝑗 ⋅
�1− 𝑔𝑔𝑖𝑖𝑗𝑗� − 𝑑𝑑𝑖𝑖𝑖𝑖 ⋅(1− 𝑔𝑔𝑖𝑖𝑙𝑙), 0) (8)
Iranian Journal of Chemical Engineering, Vol. 13, No. 4 (Autumn 2016) 21 Only the real values of the instance outputs
have to be taken into account. The reasoning is the same as for the first criterion, but now the distance to the neighbors has to be minimized with close values (the positive term), while simultaneously trying to maximize the distance to the neighbors with distant values (the negative term). By analogy to equation 4, a margin of at least 1 should be present between an instance with a close value and another with a distant value. The max function is used by analogy to the expression of the hinge loss. If it is considered that j has a close value and l has a distant one, the corresponding hinge loss will be 0 only when dil ≥ 1 + dij. The condition j≠l is implicit
because, when the terms are equal, they cancel each other out.
Overall, the following values were used for the weights of the criteria: 𝑤𝑤1𝐹𝐹 = 𝑤𝑤2𝐹𝐹 = 0.5.
The modeling methodology was implemented in in-house software using the C# programming language.
4. Results and discussion
4.1. Processing the experimental data
In these systems, opposing components were found, considering the lyotropic series H2PO4-
and K+ as so-called structure-making salts,
while guanidine hydrochloride is described as structure breaking agent. The combination of these two competing components on phase separation is very interesting and cannot be predicted. For measuring the concentration of components in bottom and top phases of aqueous two-phase systems, standard calibration curves should be built. The PEG concentration has negligible effect on the
calibration curve of guanidine hydrochloride concentration in PEG/ guanidine hydrochloride/ phosphate/ water system. In the results, the calibration curves were related to the concentrations of salt and guanidine
hydrochloride. A change of PEG
concentration in the range of 10- 50 % (w/w) results in 0.05 ms (mili-Siemens) in conductivity of the solution which is negligible relative to 20 ms changes related to changes in GuHCl concentration. A typical calibration curve for guanidine hydrochloride/ K2HPO4/ water system is shown in Fig. 2. The
22 Iranian Journal of Chemical Engineering, Vol. 13, No. 4 (Autumn 2016)
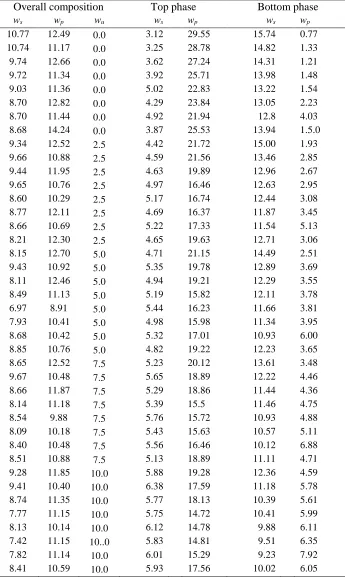
Table 1
Phase Compositions for the PEG4000 + Potassium Phosphate + Water System at 25°C, pH 9.1, and different mass % Urea.
Overall composition Top phase Bottom phase
ws wp wu ws wp ws wp
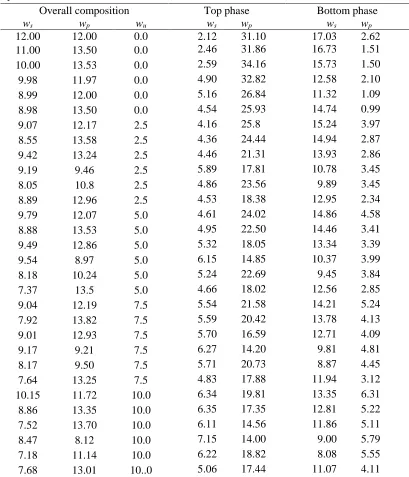
Iranian Journal of Chemical Engineering, Vol. 13, No. 4 (Autumn 2016) 23 Table 2
Phase Compositions for the PEG4000 + Potassium Phosphate + Water System at 25°C, pH 10.8, and different mass % Urea.
Overall composition Top phase Bottom phase
ws wp wu ws wp ws wp
12.00 12.00 0.0 2.12 31.10 17.03 2.62
11.00 13.50 0.0 2.46 31.86 16.73 1.51
10.00 13.53 0.0 2.59 34.16 15.73 1.50
9.98 11.97 0.0 4.90 32.82 12.58 2.10
8.99 12.00 0.0 5.16 26.84 11.32 1.09
8.98 13.50 0.0 4.54 25.93 14.74 0.99
9.07 12.17 2.5 4.16 25.8 15.24 3.97
8.55 13.58 2.5 4.36 24.44 14.94 2.87
9.42 13.24 2.5 4.46 21.31 13.93 2.86
9.19 9.46 2.5 5.89 17.81 10.78 3.45
8.05 10.8 2.5 4.86 23.56 9.89 3.45
8.89 12.96 2.5 4.53 18.38 12.95 2.34
9.79 12.07 5.0 4.61 24.02 14.86 4.58
8.88 13.53 5.0 4.95 22.50 14.46 3.41
9.49 12.86 5.0 5.32 18.05 13.34 3.39
9.54 8.97 5.0 6.15 14.85 10.37 3.99
8.18 10.24 5.0 5.24 22.69 9.45 3.84
7.37 13.5 5.0 4.66 18.02 12.56 2.85
9.04 12.19 7.5 5.54 21.58 14.21 5.24
7.92 13.82 7.5 5.59 20.42 13.78 4.13
9.01 12.93 7.5 5.70 16.59 12.71 4.09
9.17 9.21 7.5 6.27 14.20 9.81 4.81
8.17 9.50 7.5 5.71 20.73 8.87 4.45
7.64 13.25 7.5 4.83 17.88 11.94 3.12
10.15 11.72 10.0 6.34 19.81 13.35 6.31
8.86 13.35 10.0 6.35 17.35 12.81 5.22
7.52 13.70 10.0 6.11 14.56 11.86 5.11
8.47 8.12 10.0 7.15 14.00 9.00 5.79
7.18 11.14 10.0 6.22 18.82 8.08 5.55
7.68 13.01 10..0 5.06 17.44 11.07 4.11
slightly shorter manner. This effect is also seen for urea [63]. It can be related to the structure breaking effect of guanidine hydrochloride on the water or the preferential interaction with aqueous interface [64]. But, it
24 Iranian Journal of Chemical Engineering, Vol. 13, No. 4 (Autumn 2016)
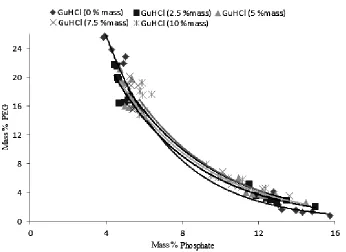
Figure 3. Binodal of PEG 4000/ phosphate systems at 298.15 K and pH 7.2 at different guanidine hydrochloride concentrations.
Iranian Journal of Chemical Engineering, Vol. 13, No. 4 (Autumn 2016) 25 Figure 5. Binodal of PEG 4000/ phosphate systems at 298.15 K and pH 10.8 at
different guanidine hydrochloride concentrations.
force between PEG-GuHCl and water
increases. As a result, the ratio of PEG in the two phases is changed and the two phase region shrinks.Increasing the pH results in a slightly larger two-phase area. With increasing the pH, the charge of salt ions changes and, for a constant PEG concentration, lower concentration of salt is needed.
4.2. Modeling the experimental data
In order to compare different algorithms and models, the cross-validation method was applied with 10 folds. According to this method, the complete dataset is divided into 10 equal groups. One of those groups is considered as the testing set, and the other nine compose the training set. A model is thus built on 90 % of the data, and tested on the remaining 10 %. This procedure is repeated 10 times, each time with a different group as the
testing set. In the end, the quality metric of the whole model is computed as the average of the quality metrics of the 10 models.The coefficient of determination (r2) and the squared coefficient of correlation is used as a metric to compare the performance of different models.
26 Iranian Journal of Chemical Engineering, Vol. 13, No. 4 (Autumn 2016)
close value and another with a distant value (by analogy with the target and impostor instances for classification). With two reference neighbors, the results are far worse than with three, while with more reference neighbors, the computation time greatly increases and the results are no better than in case of three reference neighbors.
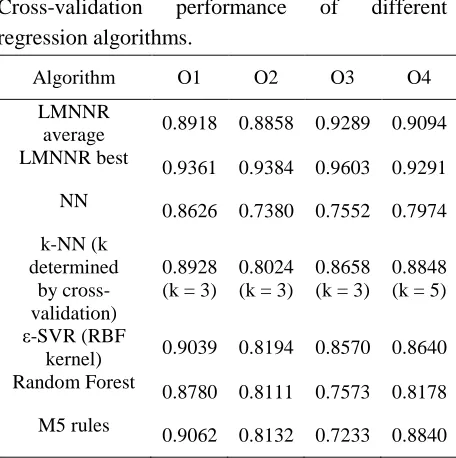
Table 3 presents the results obtained with various algorithms implemented in the popular collection of machine learning algorithms using Weka [65]. The results are given for each of the four outputs of the model, i.e. O1-O4.
The comparison is made with the nearest neighbor algorithm, taking into account one or k nearest neighbors, where the optimal value of k is obtained by cross-validation. Also, the ε-Support Vector Regression algorithm with an RBF kernel is employed. These algorithms were mainly chosen for comparison because of their good results in general. The proposed method, LMNNR, namely the Large Margin
Table 3
Cross-validation performance of different regression algorithms.
Algorithm O1 O2 O3 O4
LMNNR
average 0.8918 0.8858 0.9289 0.9094 LMNNR best
0.9361 0.9384 0.9603 0.9291
NN 0.8626 0.7380 0.7552 0.7974
k-NN (k determined
by cross-validation)
0.8928 (k = 3)
0.8024 (k = 3)
0.8658 (k = 3)
0.8848 (k = 5)
ε-SVR (RBF
kernel) 0.9039 0.8194 0.8570 0.8640 Random Forest 0.8780 0.8111 0.7573 0.8178
M5 rules 0.9062 0.8132 0.7233 0.8840
Nearest Neighbor for Regression, is also based on concepts from both nearest neighbor paradigm and large margin from support vector machines.
Also, the Random Forest algorithm [66] was used because it is also considered to have very good performance in general. It relies on building a certain number of random trees (e.g. 10) using bagging, i.e. each tree is built for a slightly different set of training instances. Finally, after the trees are built, each of them chooses the value of the new instance to be processed.
A representative of the decision rules family was included as well, i.e. the M5 rules algorithm. It generates a decision list for regression problems using the separate-and-conquer method. In each iteration, it builds a model tree using M5 and transforms the best leaf into a rule [67].
In Table 3, regarding the two rows for LMNNR, since an evolutionary algorithm is used for optimization, and this is a heuristic method, finding the best solution is not guaranteed every time. Therefore, several trials are performed for each problem. The row “LMNNR average” contains the average of the results obtained over all these trials. The row “LMNNR best” contains the best result found by our algorithm for each output, i.e. problem. One can see that these values, marked in bold letters, are the best and exceed even the results given by very good algorithms such as the ε-Support Vector Regression or the Random Forest. Also, the results are better than those of the traditional kNN, even when
the optimal number of neighbors k is
determined itself by cross-validation.
Iranian Journal of Chemical Engineering, Vol. 13, No. 4 (Autumn 2016) 27 model, as a nearest-neighbor model, all the
training data is stored. In this paradigm, a good generalization is not obtained by trying to find a model as simple as possible, e.g. with a lower number of parameters, like with polynomial regression or even decision trees relying on homogeneity criteria such as entropy. An increased generalization capability is ensured by maximizing the margin between instances with different output values by learning an appropriate space metric.
After the model is created, it can be applied for new data using the original training set and the parameters learned by solving the optimization problem: mii in equation (5) and,
if the problem requires multiple prototypes, the position vector of the prototypes in the input space and the corresponding mii for each
one.
5. Conclusions
The phase behaviour of PEG4000/phosphate/ guanidine hydrochloride/water system at different guanidine hydrochloride concentrations and pH was investigated. The increase of the guanidine hydrochloride concentration displaced the binodal of the system toward the higher concentrations of the components. The increase of the pH resulted in a slightly larger two-phase area.
A new algorithm, the large margin nearest neighbor regression (LMNNR) is presented and applied for the modelling of the liquid-liquid equilibrium (LLE) of guanidine hydrochloride in the PEG4000/phosphate/ guanidine hydrochloride/water system.
It belongs to the class of instance-based methods, but the distance metric, which is
crucial for the performance of this type of algorithm is not fixed, but depends on the problem at hand. The distance metric is obtained by solving an optimization problem which tries to decrease the distance between the instances with similar output values and increase the distance between the instances with different output values. This process is actually equivalent to maximizing the margin between the instances with different output values. An evolutionary algorithm is used to solve the optimization problem. Its advantage is its simplicity and good performance, with the disadvantage of an increase in the execution time. The results of our method are quite promising: they were clearly better than those obtained by well-established methods such as Support Vector Machines, k-Nearest Neighbour and Random Forest.
Acknowledgment
This work was supported by the “Partnership in priority areas – PN-II” program, financed by ANCS, CNDI - UEFISCDI, project PN-II-PT-PCCA-2011-3.2-0732, No. 23/2012.
References
[1] Albertsson, P. Å., Partition of cell particles and macromolecules, 3rd ed., New York, Wiley, USA, (1986).
[2] Raghavarao, K., Ravganathan, T., Srinivas, N. and Barhate, R., “Aqueous two phase extraction: An environmentally benign
technique”, Clean Technol. Environ.
Policy.,5(2), 136 (2003).
28 Iranian Journal of Chemical Engineering, Vol. 13, No. 4 (Autumn 2016)
PEG4000/CaCl2 ATPS”, J. Chromatogr. B.,
85(1-2),227 (2007).
[4] Cavalcanti, M.T.H., Carneiro-da-Cunha, M. G., Brandi, I.V., Porto, T.S., Converti, A., Lima Filho, J.L., Porto, A.L.F. and Pessoa, A., “Continuous extraction of á- toxin from a fermented broth of Clostridium perfringens Type A in perforated rotating disc contactor using aqueous two-phase PEG–phosphate system”, Chem. Eng. Prog., 47,1771 (2008).
[5] Vázquez-Villegas, P., Aguilar, O. and Rito-Palomares, M., “Study of biomolecules partition coefficients on a novel continuous separator using polymer-salt aqueous two-phase systems”, Sep. Purif. Technol.,
78(1),69(2011).
[6] Rosa, P., Azevedo, A., Sommerfeld, S.,
Bäcker, W. and Aires-Barros, M.,
“Continuous aqueous two-phase extraction of human antibodies using a packed
column”, J. Chromatogr. B.,
880,148(2012).
[7] Rosa, P.A.J., Azevedo, A.M., Mutter, M., Bäcker, W. and Aires-Barros, M.R., “Continuous purification of antibodies form cell culture supernatant with aqueous two-phase systems: From concept to process”, Biotechnol. J., 8 (3),352 (2013).
[8] Espitia-Saloma, E., Vázquez-Villegas, P., Aguilar, O. and Rito-Palomares, M., “Continuous aqueous two-phase systems devices for the recovery of biological
products”, Food Bioprod. Process,92
(2),101 (2014).
[9] Luechaua, F., Ling, T. and ChandLyddiatt, A., “A descriptive model and methods for up-scaled process routes for interfacial partition of bioparticles in aqueous
two-phase systems”, Biochem. Eng. J.,
50(3),122 (2010).
[10] Hu, R., Feng, X., Chen, P., Fu, M., Chen, H., Guo, L. and Liu, B-F., “Rapid, highly efficient extraction and purification of membrane proteins using a microfluidic continuous-flow based aqueous two-phase system”, J.Chromatogr. A., 1218 (1),171 (2011).
[11]Rodrigues, G.D., Teixeira, L.D., Ferreira, G.M.D., da Silva, M.D.H., da Silva, L.H.M. and de Carvalho, R.M.M., “Phase diagrams of aqueous two-phase systems with organic salts and F68 triblock copolymer at different temperatures”, J. Chem. Eng. Data., 55(3),1158(2010).
[12]Rosa, P.A.J., Azevedo, A.M.,
Sommerfeld, S., Bäcker, W. and
Aires-Barros, M.R., “Aqueous two-phase
extraction as a platform in the biomanufacturing industry: Economical and environmental sustainability”, Biotech. Adv., 29(6),559 (2011).
[13]Naganagouda, K. and Mulimani, V.H., “Aqueous two-phase extraction (ATPE): An attractive and economically viable technology for downstream processing of Aspergillusoryzae á-galactosidase”, Process Biochem., 43 (11),1293(2008).
[14]Hatti-Kaul, R., Aqueous two-phase
systems: Methods and protocols, methods in biotechnology, 11, Humana Press, (2000).
Iranian Journal of Chemical Engineering, Vol. 13, No. 4 (Autumn 2016) 29 [16]Rito-Palomares, M., “Practical application
of aqueous two-phase partition to process development for the recovery of biological
products”, J. Chromatogr. B., 807
(1),3(2004).
[17]Asenjo, J.A. and Andrews, B.A.,
“Aqueous two-phase systems for protein
separation: Phase separation and
applications”, J. Chromatogr. A.,
1238,1(2012).
[18]Selber, K., Tjerneld, F., Collén, A., Hyytiä, T., Nakari-Setälä, T., Bailey, M., Fagerström, R., Kan, J., van der Laan, J., Penttilä, M. and Kula, M. R., “Large-scale separation and production of engineered proteins, designed for facilitated recovery in detergent-based aqueous two-phase extraction systems”, Process Biochem., 39
(7),889(2004).
[19]Yan-Min, L., Yan-Zhao, Y., Xi-Dan, Z. and Chuan-Bo, X., “Bovine serum albumin partitioning in polyethylene glycol (PEG)/potassium citrate aqueous two-phase
systems”, Food Bioprod. Process., 88
(1),40 (2010).
[20]Rocha, M.V. and Nerli, B.B., “Molecular features determining different partitioning patterns of papain and bromelain in aqueous two-phase systems”, Int. J. Bio. Macromol., 61,204 (2013).
[21]Rodrigues, G.D., de Lemos, L.R., da Silva, L.H.M. and da Silva, M.C.H., “Application of hydrophobic extractant in aqueous two-phase systems for selective extraction of cobalt, nickel and cadmium”, J. Chromatogr. A., 1279,13(2013).
[22]Wang, Z.H., Song, M. and Ma, Q., “Two-phase aqueous extraction of chromium and its application to speciation analysis of
chromium in plasma”, Mikrochim. Acta.,
134(1),95(2000).
[23]Gao, Y.T. and Wang, W.W., “Distribution behavior and extraction mechanism of gold(III) in polyethylene glycol ammonium sulphate aqueous biphasic system”, Chin. J. Appl. Chem., 19(6),578 (2002).
[24]Patrício, P.R., Mesquita, M.C., da Silva, L.H.M. and da Silva, M.C.H. “Application of aqueous two-phase systems for the development of a new method of cobalt(II), iron(III) and nickel(II) extraction: A green chemistry approach”, J. Hazard Mater.,
193,311(2011).
[25]Bulgariu, L. and Bulgariu, D., “Selective extraction of Hg(II), Cd(II) and Zn(II) ions from aqueous media by a green chemistry procedure using aqueous two-phase systems”, Sep. Purif. Technol.,
118,209(2013).
[26]Rahimpour, F., Feyzi, F., Maghsodi S. and Kaul, R.H., “Purification of plasmid DNA with polymer-salt aqueous two-phase
system: Optimization using response
surface methodology”, Biotech. Bioeng., 95
(4),627 (2006).
[27]Rahimpour, F., Mamo, G., Feyzi, F.,
Maghsoudi, S. and Kaul, R.H.,
“Optimization refolding and recovery of
active recombinant bacillus haloduransxylanase in polymer-salt
aqueous two-phase system using surface response analysis”, J. Chromatogr. A.,
1141(1),32 (2007).
30 Iranian Journal of Chemical Engineering, Vol. 13, No. 4 (Autumn 2016)
human granulocyte-colony stimulating factor (Cys17Ser) in aqueous two-phase systems containing chelated metal ions”, J. Chromatogr B., 852 (1-2),409 (2007). [29]Shahbaz Mohamadia, H. and Omidinia, E.,
“Purification of recombinant phenylalanine dehydrogenase by partitioning in aqueous two-phase systems”, J. Chromatogr. B.,
854(1-2),273 (2007).
[30]Shahbaz Mohamadia, H. and Omidinia, E., “Process integration for the recovery and purification of recombinant Pseudomonas fluorescensproline dehydrogenase using aqueous two-phase systems”, J. Chromatogr. B., 929,11 (2013).
[31]Lan, J. Ch-W., Yeh, C-Y., Wang, C-C., Yang, Y-H. and Wu, H-S., “Partition separation and characterization of the poly hydroxyalkanoates synthase produced from recombinant Escherichia coli using an aqueous two-phase system”, J. Biosci. Bioeng., 116 (4),499 (2013).
[32]Ibarra-Herrera, C., Aguilar, O. and Rito-Palomares, M., “Application of an aqueous two-phase system strategy for the potential recovery of a recombinant protein from alfalfa (Medicago sativa)”, Sep. Purif. Technol., 77 (1),94(2011).
[33]Clark, ED., “Protein refolding for
industrial processes”, Curr. Opin. Biotechnol., 12 (2),202 (2001).
[34]Rämsch, C., Kleinelanghorst, L. B., Knieps, E., Thommes, M. R. and Kula, A. J. “Aqueous two-phase systems containing urea: Influence of protein structure on Protein Partitioning”, Biotechnol. Bioeng.,
69,83 (2001).
[35]Salvi, G., De Los Rios, P. and
Vendruscolo, M., “Effective interactions
between chaotropic agents and proteins”,
protein., 61 (3),492(2005).
[36]Vemić, A., Stojanović, B. J., Stamenković, I. and Malenović, A., “Chaotropic agents in liquid chromatographic method development for the simultaneous analysis of levodopa, carbidopa, entacapone and their impurities”, J. Pharm. Biomed. Anal.,
77,9 (2013).
[37]Parnica, J. and Antalika, M. “Urea and guanidine salts as novel components for deep eutectic solvents”, J. Mol. Liq.,
197,23(2014).
[38]Hagel, P., Gerding, J.J.T., Fieggen, Wand Bloemendal, H., “Cyanate formation in solutions of urea I. Calculation of cyanate concentrations at different temperature and
pH”, Biochim. Biophys. Acta., 243
(3),366(1971).
[39]Cejka, J., Vodražkaand, Z. and Salgk, J., “Carbamylation of globin in electrophoresis and chromatography in the presence of urea”, Biochim. Biophys. Acta., 154(3),589 (1968).
[40]Rämsch, Ch., Kleinelanghorst, L.B., Knieps., E.A., Homes, J. and Kula, M.R., “Aqueous two-phase system containing urea; Influence on phase separation and stabilization of protein conformation by phase components”, Bitechnol. Prog.,
15(3),493(1999).
[41]Rahimpour, F. and Pirdashti, M., “The effect of guanidine hydrochloride on phase diagram of PEG-phosphate aqueous two-phase system”, World Academy of Science,
Engineering and Technology, 1 (5),
29(2007).
[42]Rahimpour, F. and Pirdashti, M.
Iranian Journal of Chemical Engineering, Vol. 13, No. 4 (Autumn 2016) 31 coefficient of guanidine hydrochloride in
the poly ethylene glycol + phosphate + water system at 298.15 K”. Iranian J. Chem. Eng., 7(1),67 (2010).
[43]Gautam, G. and Simon, L. “Prediction of equilibrium phase compositions and â-glucosidase partition coefficient in aqueous two-phase systems”, Chem. Eng. Commun., 194 (1),117 (2007).
[44]Pazuki, G.R., Taghikhani, V. and
Vossoughi, M., “Prediction the partition coefficients of biomolecules in polymer- polymer aqueous two-phase systems using the artificial neural network”, Particulate Sci. Technol., 28 (1),67 (2010).
[45]Pazuki, Gh. and Seyfi Kakhki, S., “A hybrid GMDH neural network to investigate partition coefficients of Penicillin G Acylase in polymer–salt aqueous two-phase systems”, J. Mol. Liq.,
188,131 (2013).
[46]Abdolrahimi, Sh., Nasernejad, B., Pazuki, Gh., “Prediction of partition coefficients of alkaloids in ionic liquids based aqueous biphasic systems using hybrid group method of data handling (GMDH) neural network”, J. Mol. Liq., 191,79(2014). [47]Pirdashti, M., Movagharnejad, K.,
Curteanu, S., Dragoi, E.N., Rahimpour, F., “Prediction of partition coefficients of guanidine hydrochloride in PEG– phosphate systems using neural networks developed with differential evolution algorithm”, J. Ind. Eng. Chem.,
27,268(2015).
[48]Thomas Cover, M. and Hart, P.E., “Nearest neighbor pattern classification”. IEEE T Inform Theory, 13(1),21(1967). [49]Shental, N., Hertz, T., Weinshall, D. and
Pavel, M., “Adjustment learning and relevant component analysis”, Proceedings
of the 7th European Conference on
Computer Vision, ECCV-02,4,776-792, London, UK, Springer-Verlag,776(2002). [50]Shalev-Shwartz, Sh., Singer, Y. and Ng,
A.Y., “Online and batch learning of pseudo-metrics”, Proceedings of the 21st International Conference on Machine Learning, ICML-04, Banff, Canada, pp. 94–101 (2004).
[51]Chopra, S., Hadsell, R. and LeCun, Y., “Learning a similarity metric discriminatively, with application to face verification”, Proceedings of the IEEE Conference on Computer Vision and Pattern Recognition, CVPR-05, San Diego, CA, USA, pp. 349-356 (2005).
[52]ElSehiemy, R., Abou El-Ela, A. and Shaheen, A., ”Multi-objective fuzzy-based procedure for enhancing reactive power management”, IET Gener. Transm. Dis.,
7(12),1453 (2013).
[53]Precup, R.E., Rdac, M.B., Tomescu, M.L., Petriu, E.M. and Preitl, S., ”Stable and convergent iterative feedback tuning of fuzzy controllers for discrete-time SISO systems”, Expert Syst. Appl., 40 (1), 188 (2013).
[54]Khmelev, A. and Kochetov, Yu., ”A hybrid local search for the split delivery vehicle routing problem”, IJ-AI., 13(1), 147(2015).
[55]Kazakov, A. L. and Lempert, A. A., ” On mathematical models for optimization problem of logistics infrastructure, IJ-AI.,
13(1), 200( 2015).
32 Iranian Journal of Chemical Engineering, Vol. 13, No. 4 (Autumn 2016)
thermodynamic model based on group contribution for correlation liquid-liquid equilibria in aqueous two-phase systems of PEG and (K2HPO4 or Na2SO4)”, Fluid
Phase Equilib., 215(2),151 (2004).
[57]Goldberger, J., Roweis, S., Hinton, G. and
Salakhutdinov, R., Neighbourhood
components analysis, Advances in Neural Information Processing Systems, 17, Cambridge, MA, USA, MIT Press, pp.513-520(2005).
[58]Weinberger, K.Q., Blitzer, J. and Saul, L.K., Distance metric learning for large margin nearest neighbor classification, Advances in Neural Information Processing Systems, 18, MIT Press, Cambridge, MA, USA, pp. 1473-1480 (2006).
[59]Weinberger, K.Q. and Saul, L.K., “Fast solvers and efficient implementations for distance metric learning”, Proceedings of
the 25th International Conference on
Machine Learning, Helsinki, Finland, pp. 1160-1167(2008).
[60]Weinberger, K.Q. and Saul, L.K.,
“Distance metric learning for large margin nearest neighbor classification”, J. Mach. Learn Res.,10,207 (2009).
[61]Moore, R.C. and DeNero, J. “L1 and L2 regularization for multiclass hinge loss models”, Proceedings of the Symposium on Machine Learning in Speech and Language
Processing, pp. 1-5 (2011).
[62]Leon, F. and Curteanu, S., “Evolutionary algorithm for large margin nearest neighbour regression”, 7th International
Conference on Computational Collective Intelligence Technologies and Applications, ICCCI, Spain. Madrid, pp. 21-23 (2015).
[63]Estapé, D., Rinas, U., “Optimized procedures for purification and solubilization of basic fibroblast growth factor inclusion bodies”, Biotechnol. Tech.,
10 (7),481 (1996).
[64]Annuziata, O., Asherie, N., Lomakin, A., Pande, J., Ogun, O., Benedek, G.B., “Effect of polyethylene glycol on the liquid-liquid phase transition in aqueous protein solutions”, Proc. Natl. Acad. Sci.,
99 (22),14165(2002).
[65]Hall, M., Frank, E., Holmes, G., Pfahringer, B., Reutemann, P. and Witten, I. H., “The WEKA data mining software: An update”. ACM SIGKDD Explor.,
11(1),10(2009).
[66]Breiman, L., “Random Forests”, Mach. Lear., 45 (1),5 (2001).