Int. J. Industrial Mathematics Vol. 1, No. 2 (2009) 183-195
Eciency Measurement of Multiple Components
units in Data Envelopment Analysis Using
Common Set of Weights
M. Fallah Jelodara, N. Shoja a, M. Saneib, A. Gholam Abria
(a) Department of Mathematics, Islamic Azad University, Firoozkooh Branch,Firoozkooh,Iran. (b) Department of Mathematics, Islamic Azad University, Tehran Center Branch,Tehran,Iran.
||||||||||||||||||||||||||||||| Abstract
The current paper presents a mathematical programming model for use to the measure of eciency where multiple performance measures are needed to examine the performance and productivity changes. In many applications of data envelopment analysis (DEA), the existing models are designed to obtain a single eciency measure. However, in many real situations, the units under consideration may perform several dierent functions or can be separated into dierent components. In these cases, some inputs are often shared among those components and all components are involved in producing some outputs and all components have exclusive inputs and outputs. Therefore, measuring the eciency of each component and measuring the aggregated eciency of each unit are important. In this paper, car factories' eciency is analyzed using data from 19 car factories in Iran. First, a DEA-eciency analysis of multi-component DMUs, which proposed by Cook et al is presented and then by using a "common set of weights (csw)", a new model is proposed to measure the eciency of each component and aggregated eciency of units. One of the most important advantages of this model is that by solving only one linear programming problem all eciency measures may be obtained. Secondly, by grouping the branches according to their organizational designation, their eciency is measured.
Keywords: Data envelopment analysis, Eciency, Multi-component eciency, Aggregated e-ciency, Common set of weights
Corresponding author. Email Address: mehdi.fallah [email protected] and [email protected],
1 Introduction
Data envelopment analysis is a method to determine the relative eciency of a set of orga-nizational units such as schools or bank branches when there are multiple incommensurate inputs and outputs. The applications of DEA present a range of issues relating to the ho-mogeneity of the units under consideration. Eciency measurement using tools such as DEA, as proposed by Charnes et al. [3], has tended to concentrate on achieving a single measure of eciency for each member of a set of decision making units (DMUs). Note that a mathematical programming based method data envelopment analysis has proven an eective tool for evaluating the relative eciency of peer decision making units when multiple performance measures are presented. In most real applications, a single measure of production eciency, provided by DEA methodology, has been an adequate and useful means of comparing units and identifying best performance.
However, in most real situations, the DMU involved, can be separated into dierent com-ponents. In these situations, inputs, in particular resources, are often shared among those components. Also, all components are involved in producing some outputs. In such cases, we have to determine the performance of DMUs in each component. Therefore, measur-ing models that can deal with multiple performance measures and provide an integrated performance measure are needed. The idea of measuring eciency relative to certain com-ponents of a DMU is not new. Fare and Grosskopf [5], for example, looked at a multi-stage process wherein intermediate outputs at one stage can be both nal outputs and inputs to a later stage of production. This application of multi-component eciency measure-ment does not involve shared resources. Cook et al. [4] proposed a method for measuring multi-component eciency, which involved shared inputs.
This paper, rst, addresses a model for deriving an "aggregate measure of eciency" with component measurement based on a common set of weights, and derives a model for measuring the eciency score of each component and aggregated eciency of the units under consideration. Secondly, an application to Iranian car factories is presented. The Iranian car factories, like those of many countries, have undergone considerable change in operational policies in recent years. Because of these changes, the exible evaluation of performance that tells managers whether or not they are "doing things right" has become an important topics to managing reality. This paper is structured as follows:
A summary of basic DEA models and multiple component eciency is given in Section 2. Mathematical models for implementing the measures are presented in Section 3. The fourth section details the analytical results obtained from the application of the model to a real data set involving the data of 19 Iranian car factories. Conclusions appear in the nal section.
2 DEA Background
Consider n DMUs with m inputs and s outputs. The input and output vectors of DMUj,
(j = 1; : : : ; n); are Xj = (x1j; : : : ; xmj)t; Yj = (y1j; : : : ; ysj)t; where Xj 0; Xj 6= 0; Yj
0; Yj 6= 0:
the production possibility set (PPS) is made as follows:
Tc=
8 <
:(X; Y ) : X
n
X
j=1
jXj; Y
n
X
j=1
jYj; j 0; j = 1 : : : ; n
9 = ;
Let DMUo be the DMU under consideration. The envelopment form of the CCR model
in the input-oriented case is as follows:
Min "[Xm
i=1
si +Xs
r=1
s+ r]
s:t:
n
X
j=1
jxij + si = xio; i = 1; : : : ; m
n
X
j=1
jyrj s+r = yro; r = 1; : : : ; s
j 0; j = 1; : : : ; n
(2.1)
and its dual, the multiplier form of the CCR model in the input oriented case is:
Max Xs
r=1
uryro
s:t: Xm
i=1
vixio= 1 s
X
r=1
uryrj m
X
i=1
vixij 0; j = 1; : : : ; n
ur "; r = 1; : : : ; s
vi "; i = 1 : : : ; m
(2.2)
Clearly:
(1) DMUo is ecient in model 1 if and only if =1, S =0 and S+=0. (* means the
optimal solution)
(2) DMUo is ecient in model 2 if and only if there exists (Ut; Vt) > 0 such that
Uty
o=1.
prot eciency and total eciency which are evaluated by standard DEA models, can be discussed in this eld.
For the rst time, Cook et al. [4] published a paper on component eciency in 2001. Also, Beasley [1] conducted a research independently about instructional eciency of London University whose results led to the publication of a paper in 2002. Then, Cook , himself completed his paper. Jahanshahloo et al. [7] considered the shared inputs and outputs as non-discretionary factors. The following subsection contains the organized and modied models that have been presented up to now.
2.1 Measuring the eciency of DMUs with multiple components
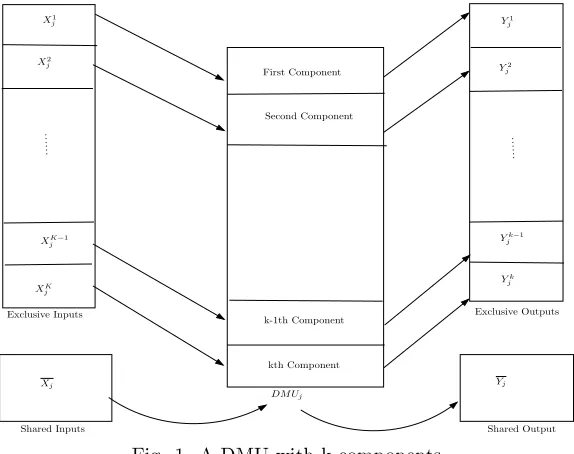
In this subsection, we are going to extend the pervious method for the cases in which the evaluated units have multiple components. In this regard, consider the following gure:
First Component
Second Component
k-1th Component
kth Component
X1
j
X2
j
XK−1
j
XK j
Xj Yj
Y1
j
Y2
j
Yk−1
j
Yk j
Exclusive Inputs
Shared Inputs
Exclusive Outputs
Shared Output
DM Uj
Fig. 1. A DMU with k components
Consider DMUj, and note that xlj = (xl1j; :::; xlmj); l = 1; :::; k is the exclusive input of
the lth component and xj = (x1j; :::; xpj) is the shared input for all components. Also,
yl
j = (yl1j; :::; ysjl ) is the exclusive output of the lth component and yj = (y1j; :::; ytj) is the
shared output for all components. Let i = (i
1; :::; ik) i = 1; :::; p be the contribution of
shared inputs for all components. Now, consider the vector (1
lx1j; :::; plxpj; l = 1; :::; k),
where i
lxij is the contribution of the ith shared input for the lth component. Note that
k
X
l=1
il = 1; il 0; i = 1; :::; p; l = 1; :::; k
For more explanation, consider the following matrix:
= 0 B B @
1
1 12 ::: 1p
2
1 22 ::: 2p
: : ::: :
k
1 k2 ::: kp
1 C C
Note that the sum of each column is one.
Further, let r = (r
1; :::; kr); r = 1; :::; t be the contribution of shared outputs for all
components. Now, consider the vector (1
lyr; :::; kryr); r = 1; :::; t, where lryrj is the
contribution of the rth shared output for the lth component. For more convenience, consider the following matrix:
= 0 B B @
1
1 12 ::: t1
2
1 22 ::: t2
: : ::: :
k
1 2k ::: tk
1 C C
A = [1; ::; t]
Note that the sum of each column of this matrix is also equal to one.
According to the previous statements, the input vector of the lth component is as follows: (xl; x
ji) = (xl1j; :::; xlmj; l1x1j; :::; plxpj); l = 1; :::; k
And the output vector of the lth component is: (yl; yr) = (yl
1j; :::; ysjl ; l1y1j; :::; ltytj); l = 1; :::; k
If we denote the eciency of the lth component by el
j, then:
el j =
s
X
r=1
ulryrjl +
t
X
r=1
urlrlyrj
m
X
i=1
vilxlij+
p
X
i=1
vililxij
; l = 1; :::; k (2.3)
and the aggregated eciency of DMUj is as follows:
ea j =
k
X
l=1 s
X
r=1
ul ryrjl +
k
X
l=1 t
X
r=1
urllryrj
k
X
l=1 m
X
i=1
vl ixlij +
k
X
l=1 p
X
i=1
vililxij
(2.4)
Clearly, the aggregated eciency of each DMU is less than or equal to 1, i.e., ea
j 1. Also,
the aggregated eciency of each DMU is the convex combination of the eciency of all its components, i.e.,
eaj =Xk
l=1
lelj; k
X
l=1
l = 1; l 0; l = 1; :::; k
(See [4,7]). Therefore, the following model is obtained to evaluate DMUo:
Max ea
o
s:t: el
o 1; l = 1; :::; k
ea
j 1; j = 1; :::; n
k
X
l=1
il = 1; i = 1; :::; p
k
X
l=1
rl = 1; r = 1; :::; t
all variables are nonnegative
Clearly, the last problem is not linear. By the following transformation
urllr = eurl; l = 1; :::; k; r = 1; :::; t
vilil = evil; :::l = 1; :::; k; i = 1; :::; p (2.6)
and Charnes-Cooper transformation [2], the following linear programming problem is ob-tained:
Max Xk
l=1 s
X
r=1
ulryrol +Xk
l=1 t
X
r=1
e urlyro
s:t: Xk
l=1 m
X
i=1
vl ixlio+
k
X
l=1 p
X
i=1
e
vilxio= 1
s
X
r=1
ul rylro+
t
X
r=1
e urlyro
m
X
i=1
vl ixlio
p
X
i=1
e
vilxio 0; l = 1; :::; k
k
X
l=1 s
X
r=1
ulryrjl +Xk
l=1 t
X
r=1
e urlyrj
k
X
l=1 m
X
i=1
vlixlij Xk
l=1 p
X
i=1
e
vilxij 0; j = 1; :::; n
ul
r 0; l = 1; :::; k; r = 1; :::; s:
e
url 0; l = 1; :::; k; r = 1; :::; t:
vl
i 0; l = 1; :::; k; i = 1; :::; m:
e
vil 0; l = 1; :::; k; i = 1; :::; p:
(2.7) The eciency of each component is obtained by solving this problem.
3 Proposed model to estimate the multi components
e-ciency
Recall the denitions of the previous section. The authors here proposed the following common set of weights model to obtain the eciency scores of all components:
Max fea
1; :::; eang
s:t: ea
j 1; j = 1; :::; n
el
j 1; j = 1; :::; n; l = 1; :::; k
(3.8)
Max fea j =
k
X
l=1 s
X
r=1
ulryrjl +
k
X
l=1 t
X
r=1
urllryrj
k
X
l=1 m
X
i=1
vilxlij+
k
X
l=1 p
X
i=1
vililxij
: j = 1; :::; ng
s:t:
k
X
l=1 s
X
r=1
ulrylrj+
k
X
l=1 t
X
r=1
urllryrj
k
X
l=1 m
X
i=1
vilxlij +
k
X
l=1 p
X
i=1
vililxij
1; j = 1; :::; n
s
X
r=1
ulryrjl +
t
X
r=1
urllryrj
m
X
i=1
vilxlij+
p
X
i=1
vililxij
1; j = 1; :::; n; l = 1; :::; k
k
X
l=1
il = 1; i = 1; :::; p
k
X
l=1
lr= 1; r = 1; :::; t
ur 0; r = 1; :::; s:
ur 0; r = 1; :::; t:
vi 0; i = 1; :::; m:
vi 0; i = 1; :::; p:
i
l 0; l = 1; :::; k; i = 1; :::; p
r
l 0; l = 1; :::; k; r = 1; :::; t
Min Xn
j=1
zj
s:t:
k
X
l=1 s
X
r=1
ul ryrjl +
k
X
l=1 t
X
r=1
urlrlyrj + zj
k
X
l=1 m
X
i=1
vl ixlij+
k
X
l=1 p
X
i=1
vililxij
= 1; j = 1; :::; n
k
X
l=1 s
X
r=1
ul ryrjl +
k
X
l=1 t
X
r=1
urlrlyrj
k
X
l=1 m
X
i=1
vl ixlij+
k
X
l=1 p
X
i=1
vililxij
1; j = 1; :::; n
s
X
r=1
ulrylrj+
t
X
r=1
urllryrj m
X
i=1
vlixlij +
p
X
i=1
vililxij
1; j = 1; :::; n; l = 1; :::; k
k
X
l=1
i
l = 1; i = 1; :::; p
k
X
l=1
r
l = 1; r = 1; :::; t
ur 0; r = 1; :::; s:
ur 0; r = 1; :::; t:
vi 0; i = 1; :::; m:
vi 0; i = 1; :::; p:
zj 0; j = 1; :::; n:
i
l 0; l = 1; :::; k; i = 1; :::; p
r
l 0; l = 1; :::; k; r = 1; :::; t
then we have
Min Xk
l=1
zl
s:t: Xk
l=1 s
X
r=1
ul ryrjl +
k X l=1 t X r=1
urlrlyrj k X l=1 m X i=1 vl ixlij
k X l=1 p X i=1
vililxij + zj = 0; j = 1; :::; n
k X l=1 s X r=1
ulryrjl +
k X l=1 t X r=1
urlrlyrj k X l=1 m X i=1
vlixlij
k X l=1 p X i=1
vililxij 0; j = 1; :::; n s
X
r=1
ulrylrj+
t
X
r=1
urllryrj m
X
i=1
vilxlij
p
X
i=1
vililxij 0; j = 1; :::; n; l = 1; :::; k
k
X
l=1
i
l = 1; i = 1; :::; p
k
X
l=1
r
l = 1; r = 1; :::; t
ur 0; r = 1; :::; s:
ur 0; r = 1; :::; t:
vi 0; i = 1; :::; m:
vi 0; i = 1; :::; p:
zj 0; j = 1; :::; n:
i
l 0; l = 1; :::; k; i = 1; :::; p
r
l 0; l = 1; :::; k; r = 1; :::; t
(3.11) Now, consider
ul
rlr= eulr; l = 1; :::; k; r = 1; :::; t
vl
iil= evli; l = 1; :::; k; i = 1; :::; p
(3.12)
Therefore, the following linear programming model is obtained:
Min Xn
j=1
zj
s:t: Xk
l=1 s
X
r=1
ul rylrj+
k X l=1 t X r=1 e urlyrj
k X l=1 m X i=1 vl ixlij
k X l=1 p X i=1 e
vilxij+ zj = 0; j = 1; :::; n
k X l=1 s X r=1 ul rylrj+
k X l=1 t X r=1 e urlyrj
k X l=1 m X i=1 vl ixlij
k X l=1 p X i=1 e
vilxij 0; j = 1; :::; n
s
X
r=1
ulrylrj+
t
X
r=1
e urlyrj
m
X
i=1
vilxlij
p
X
i=1
e
vilxij 0; j = 1; :::; n; l = 1; :::; k
ur 0; r = 1; :::; s:
e
url 0; r = 1; :::; t:
vi 0; i = 1; :::; m:
e
vil 0; i = 1; :::; p:
zj 0; j = 1; :::; n:
Clearly, DMUj is ecient if and only if zj = 0. The aggregated eciency of DMUj is as
follows:
ea j =
k
X
l=1 s
X
r=1
ul rylrj+
k
X
l=1 t
X
r=1
e urlyrj
k
X
l=1 m
X
i=1
vl ixlij+
k
X
l=1 p
X
i=1
e vilxij
j = 1; :::; n; l = 1; :::; k (3.14)
and the eciency score of each component is as follows:
el j =
s
X
r=1
ulryrjl +Xt
r=1
e urlyrj
m
X
i=1
vl ixlij +
p
X
i=1
e vilxij
j = 1; :::; n; l = 1; :::; k (3.15)
It is obvious that the aggregated eciency of each DMU is the convex combination of all its components' eciency scores.
4 Example
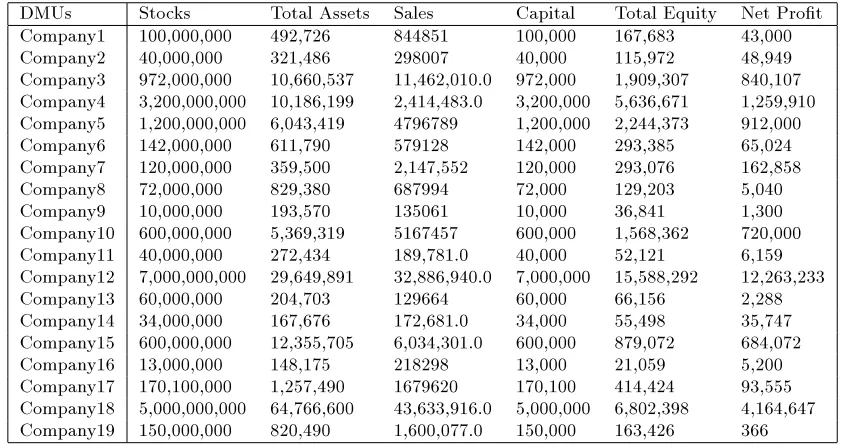
In this section we are going to apply our proposed method to a real data set. In order to do this, consider 19 Iranian car factories with the following data:
Table 1
Inputs and Outputs of Car Factories
DMUs Stocks Total Assets Sales Capital Total Equity Net Prot Company1 100,000,000 492,726 844851 100,000 167,683 43,000 Company2 40,000,000 321,486 298007 40,000 115,972 48,949 Company3 972,000,000 10,660,537 11,462,010.0 972,000 1,909,307 840,107 Company4 3,200,000,000 10,186,199 2,414,483.0 3,200,000 5,636,671 1,259,910 Company5 1,200,000,000 6,043,419 4796789 1,200,000 2,244,373 912,000 Company6 142,000,000 611,790 579128 142,000 293,385 65,024 Company7 120,000,000 359,500 2,147,552 120,000 293,076 162,858 Company8 72,000,000 829,380 687994 72,000 129,203 5,040 Company9 10,000,000 193,570 135061 10,000 36,841 1,300 Company10 600,000,000 5,369,319 5167457 600,000 1,568,362 720,000 Company11 40,000,000 272,434 189,781.0 40,000 52,121 6,159 Company12 7,000,000,000 29,649,891 32,886,940.0 7,000,000 15,588,292 12,263,233 Company13 60,000,000 204,703 129664 60,000 66,156 2,288 Company14 34,000,000 167,676 172,681.0 34,000 55,498 35,747 Company15 600,000,000 12,355,705 6,034,301.0 600,000 879,072 684,072 Company16 13,000,000 148,175 218298 13,000 21,059 5,200 Company17 170,100,000 1,257,490 1679620 170,100 414,424 93,555 Company18 5,000,000,000 64,766,600 43,633,916.0 5,000,000 6,802,398 4,164,647 Company19 150,000,000 820,490 1,600,077.0 150,000 163,426 366
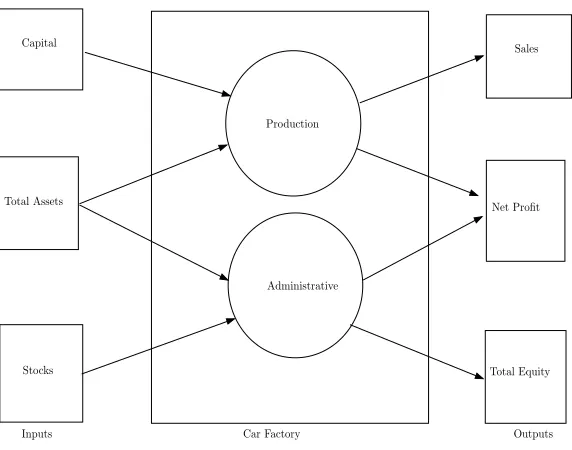
Production
Administrative Capital
Stocks Total Assets
Sales
Net Profit
Total Equity
Inputs Car Factory Outputs
Fig. 2. A Car Factory with two components
Capital and stocks are exclusive inputs of the rst and second components and total assets is the shared input. Also, sales and total equity are exclusive outputs of the components and net prot is the shared output.
By using model (2.7) the following eciency scores are obtained:
Table 2
Eciency Scores
DMUs Aggregated Eciency First Component Eciency Second Component Eciency
Company1 0.640574 0.000635 1
Company2 1 1 1
Company3 0.735246 1 0.709122
Company4 0.704606 0.014023 0.792339
Company5 0.709981 0.010820 0.853510
Company6 0.806255 0.001220 0.950728
Company7 1 1 1
Company8 0.599226 1 0.374097
Company9 1 1 1
Company10 0.939651 1 0.900295
Company11 0.467532 0.077381 0.550223
Company12 1 1 1
Company13 0.444467 0.000253 0.507700
Company14 0.673767 1 0.639217
Company15 0.758871 1 0.713396
Company16 0.938249 1 0.000287
Company17 0.864048 0.170090 1
Company18 0.569334 1 0.501034
Company19 0.595755 1 0.000260
Now, consider company 4. Clearly it is inecient because all of its components have eciency scores less than one. Also, unit 1 is inecient because the rst component has an eciency score less than unity. Of course company 2 is ecient because all of its components are ecient.
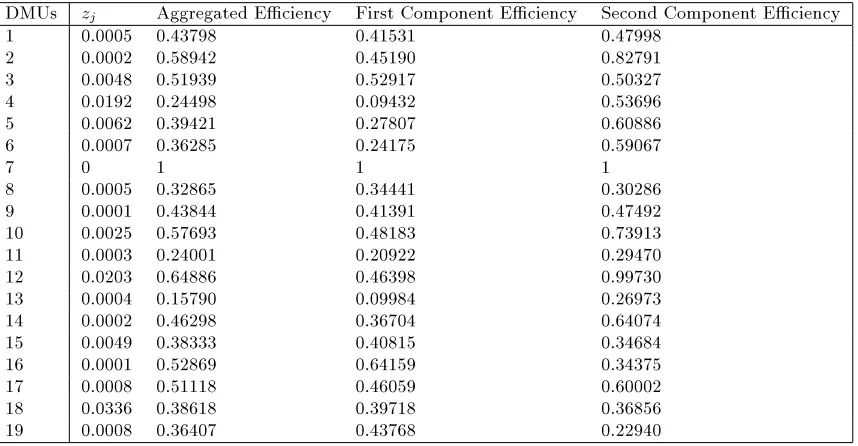
Table 3
Eciency Scores in new model
DMUs zj Aggregated Eciency First Component Eciency Second Component Eciency
1 0.0005 0.43798 0.41531 0.47998
2 0.0002 0.58942 0.45190 0.82791
3 0.0048 0.51939 0.52917 0.50327
4 0.0192 0.24498 0.09432 0.53696
5 0.0062 0.39421 0.27807 0.60886
6 0.0007 0.36285 0.24175 0.59067
7 0 1 1 1
8 0.0005 0.32865 0.34441 0.30286
9 0.0001 0.43844 0.41391 0.47492
10 0.0025 0.57693 0.48183 0.73913
11 0.0003 0.24001 0.20922 0.29470
12 0.0203 0.64886 0.46398 0.99730
13 0.0004 0.15790 0.09984 0.26973
14 0.0002 0.46298 0.36704 0.64074
15 0.0049 0.38333 0.40815 0.34684
16 0.0001 0.52869 0.64159 0.34375
17 0.0008 0.51118 0.46059 0.60002
18 0.0336 0.38618 0.39718 0.36856
19 0.0008 0.36407 0.43768 0.22940
Consider company 7; z7 = 0 so it is ecient, since all of its components have eciency
scores of one. Other units are inecient because their derivation variables are positive. Also, their components have eciency score of less than unity. The number of ecient units is decreased by using the common set of weights.
5 Conclusions
The DEA model presented here, can be used for the analysis of any real situation where a signicant number of inputs and outputs are included and management views the pro-duction process as a multi-stage process. The provision of component eciency facilitates managerial actions only on those components where the DMU is underperforming. The particular application area investigated is that involving the economical functions within Iranian car factories. Using the data from Iranian car factories, this study has measured the multi-component eciency of the economical functions in 19 Iranian car factories. We used a "common set of weights" to propose a new model for measuring the eciency score of multiple component units. One of the most important advantages of this model is that by solving only one linear programming problem, we can obtain the eciency scores of all components and the aggregated eciency of all DMUs. It can be observed that the number of ecient units is decreased by using the common set of weights.
References
[1] J.E. Beasley, Allocating xed costs and resources via data envelopment analysis, Eur. J. Oper. Res. 147 (2003) 197-216.
[3] A. Charnes, W.W. Cooper, E. Rhodes, Measuring the eciency of decision making units, European Journal of Operational Research 2 (6) (1995) 429-444.
[4] W.D. Cook, M. Hababou, H.J.H. Tuenter, Multicomponent eciency measurement and shared inputs in DEA: an application to sales and service performance in bank branches, Journal of Productivity Analysis 14 (2000) 209-224.
[5] R. Fare, S. Grosskopf, Productivity and intermediate products: a frontier approach, Economic Letters 50 (1) (1996) 65-70.
[6] Fuh-Hwa Franklin Liu, Hao Hsuan Peng. Ranking of units on the DEA frontier with common weights. Computers and Operations Research. In press.