R E S E A R C H
Open Access
Genome-wide prediction and analysis of human
tissue-selective genes using microarray
expression data
Shaolei Teng
1, Jack Y Yang
2, Liangjiang Wang
1,3*From
The 2011 International Conference on Bioinformatics and Computational Biology (BIOCOMP
’
11)
Las Vegas, NV, USA. 18-21 July 2011
Abstract
Background:Understanding how genes are expressed specifically in particular tissues is a fundamental question in developmental biology. Many tissue-specific genes are involved in the pathogenesis of complex human diseases. However, experimental identification of tissue-specific genes is time consuming and difficult. The accurate predictions of tissue-specific gene targets could provide useful information for biomarker development and drug target identification.
Results:In this study, we have developed a machine learning approach for predicting the human tissue-specific genes using microarray expression data. The lists of known tissue-specific genes for different tissues were collected from UniProt database, and the expression data retrieved from the previously compiled dataset according to the lists were used for input vector encoding. Random Forests (RFs) and Support Vector Machines (SVMs) were used to construct accurate classifiers. The RF classifiers were found to outperform SVM models for tissue-specific gene prediction. The results suggest that the candidate genes for brain or liver specific expression can provide valuable information for further experimental studies. Our approach was also applied for identifying tissue-selective gene targets for different types of tissues.
Conclusions:A machine learning approach has been developed for accurately identifying the candidate genes for tissue specific/selective expression. The approach provides an efficient way to select some interesting genes for developing new biomedical markers and improve our knowledge of tissue-specific expression.
Background
Understanding how different tissues achieve specificity is a fundamental question in tissue ontogenesis and evolution. Some genes are highly expressed in a particular tissue and lowly expressed or not expressed in other tissues. These genes are generally called tissue-selective genes. The genes are responsible for specialized functions in particular tis-sues, and thus can serve as the biomarkers for specific bio-logical processes. In addition, many tissue-selective genes are involved in the pathogenesis of complex human dis-eases [1], including insulin signaling pathways in diabetes
[2] and tumor-host interactions in cancer [3]. Since the majority of disease genes have the tendency to be expressed preferentially in particular tissues [4], identifying tissue-selective genes is also important for drug target selection in biomedical research. Tissue-specific genes, which are specifically expressed in a particular tissue, are regarded as the special case of tissue selective genes. The identification of tissue-specific genes could help biologists to elucidate the molecular mechanisms of tissue develop-ment and provide valuable information for identifying can-didate biomarkers and drug targets.
Different methods have been used to identify and characterize tissue-specific genes. Traditional experi-mental methods, including RT-PCR and Northern blot, are usually carried out at the single-gene level and thus
* Correspondence: [email protected] 1
Department of Genetics and Biochemistry, Clemson University, Clemson, SC 29634, USA
Full list of author information is available at the end of the article
time-consuming. High-throughput technologies, such as Expressed Sequence Tag (EST) sequencing and DNA microarrays, have the capacity to perform genome-wide analysis with high efficiency. The DNA microarray tech-nology can generate large amounts of gene expression data from various tissues, and provide the useful data source for analyzing tissue-specific genes. Several statis-tical methods have been applied for identifying tissue-specific genes using gene expression data. Kadota and co-workers [5] described an unsupervised method to select the tissue-specific genes using Akaike’s informa-tion criterion (AIC) approach. Another method called ROKU [6] has been developed by the same group for detecting tissue-specific gene expression patterns. The approach used Shannon entropy and outlier detection to scan expression profiles for ranking tissue-specific genes. Liang et al. [7] developed a statistical method based on hypothesis testing procedures to profile and identify the tissue-selective genes. However, the statisti-cal methods for tissue-specific gene prediction suffer from drawbacks. The microarray expression data are generated from different experiments, both biological variations and experimental noise result in significant variations in data quality. The statistical methods usually assigned an equal weight to each observation for predic-tion. Thus, the methods do not work well for non-linear models and may not detect the hidden expression pat-terns from the noisy microarray data. Moreover, the sta-tistical methods do not use biological knowledge for prediction. The simple data-driven analysis may produce some misleading results for further experimental studies. Machine learning can automatically recognize hidden patterns in complex data. It has been shown that machine learning can be used to construct accurate classifiers for tissue-specific gene prediction. Chikinaet al. [8] used Sup-port Vector Machines (SVMs) to predict tissue-specific gene expression inCaenorhabditis eleganswith whole-ani-mal microarray data. The SVM classifiers reached high predictive performances in nearly all tissues. It was shown that the approach outperformed clustering methods and provided valuable information for further experimental studies. However, it is still unknown whether machine learning methods can be used to predict tissue-specific genes in human.
We previously compiled a large microarray gene expres-sion dataset, which contained 2,968 expresexpres-sion profiles of various human tissues, including brain, liver, testis, blood and kidney samples [9]. A computational method was also developed for identifying tissue-selective genes using the integrated microarray dataset. However, the method assigned an equal weight to each expression profile for identification. In this study, a machine learning approach was developed for human tissue-specific/selective gene prediction using the available dataset. According to the
lists of known tissue-specific/selective genes, the gene expression data were extracted from the compiled dataset and used for classifier construction. Random Forests (RFs) and Support Vector Machines (SVMs) were trained with the expression data to construct accurate classifiers. The results indicate that the RF classifiers achieved better pre-dictive performance for tissue-specific gene prediction. The approach generated large numbers of candidate genes for brain and liver-specific expression. The examinations of high scoring genes suggest that our approach can be used to select candidate genes for experimental studies.
Methods
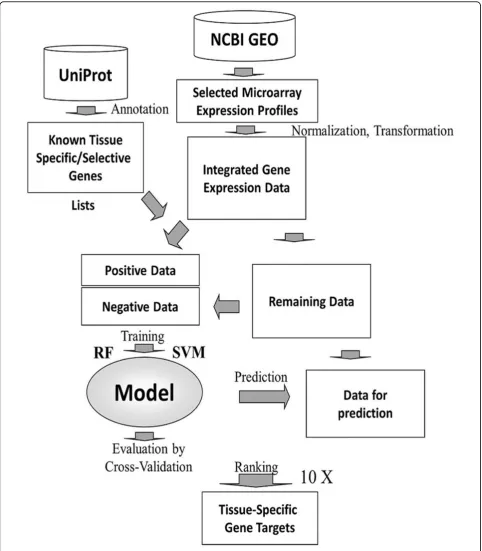
A schematic diagram of the approach used in this study is shown in Figure 1. The microarray expression profiles of various human tissues were compiled from previous studies, and integrated into a single dataset through nor-malization and transformation. The lists of known tissue-specific genes were manually collected from UniProt database. The tissue-specific gene expression data were extracted from the integrated single dataset and labelled as positive training instances. The remaining expression data were randomly divided into two subsets. The nega-tive dataset contained tenfold number of data instances as the positive instances. Random Forests (RFs) and Sup-port Vector Machines (SVMs) were trained with the training instances to construct classifiers. The tenfold cross-validation method was performed to evaluate the classifier performance. The models were then used to score the remaining data instances for prediction. The classifier construction and prediction were repeated ten times, and the candidate genes were prioritized according to their average classifier outputs from ten predictions.
Microarray data collection and integration
Training data preparation
Tissue-selective genes are defined as the genes whose expression is enriched for one or a few similar tissue types. The genes were manually collected from the
UniProt database. The particular tissue name was used as a query and the reviewed human genes were selected for preparation. The tissue-selective genes are defined as the genes that are preferentially expressed in a particular
tissue from the descriptions of their annotations. Most of the genes are identified by the experimental methods, which are independent from the microarray expression data in the list. In this study, 408 brain-selective genes, 96 liver-selective genes, 326 testis-selective genes, 324 blood-selective genes and 45 kidney-selective genes were collected from UniProt database. Tissue-specific genes, whose expression is specific to only one particular tissue type, are considered as the special case of tissue-selec-tive genes. 289 brain-specific genes and 69 liver-specific genes were selected from the corresponding tissue-selec-tive genes with the annotation that their expression is specific to only brain or liver. Tissue specific-genes can be used to construct the highly accurate classifiers. Thus, the tissue specific-gene prediction is the focus of the present study.
According to the known tissue-specific/selective gene lists, the tissue-specific/selective gene expression data was retrieved from the integrated microarray dataset and labelled as the positive training instances. The probe sets with detectable expression signals in corresponding tissue samples were selected for classifier construction. For tis-sue-specific gene prediction, the expression values for 403 probe sets of brain-specific genes and 90 probe sets of liver-specific genes were used for input vector encod-ing. 692 probe sets of brain-selective genes, 150 probe sets of liver-selective, 430 probe sets of testis-selective genes, 456 probe sets of blood-selective genes and 76 probe sets of kidney-selective genes were used for tissue-selective gene prediction.
The negative examples were defined as the genes that do not have preferential expression in particular tissues. For this study, we randomly selected the data instances from the remaining data and labelled as the negative training instances. The number of negative instances was set as tenfold with positive instances to make enough data instances for training. The negative and positive data instances were combined as the training dataset to construct classifiers using machine learning algorithms. The remaining probes were used as the candidate genes for prediction with the classifiers constructed from the training dataset.
Random Forests
The use of 2,968 expression profiles for input vector encoding gives the same number of input variables. One potential problem is model overfitting since there were only a small number of positive instances (probe sets of known tissue-specific genes) available for this study. We thus used the Random Forest (RF) learning algorithm, which could handle a large number of input variables and avoid model overfitting through random feature selection. The randomForest package in R [12] was used in this study for classifier construction. The number of
trees in a classifier (ntree) and the number of variables selected to split each node (mtry) were set to 1000 and 6, respectively. The classifier performance did not show sig-nificant improvement by using other values for themtry
andntreeparameters.
Support Vector Machines
Support Vector Machines (SVMs) are widely used for binary classification [13]. In this study, SVM classifiers were constructed and compared with RF classifiers for identifying human tissue-specific genes. The SVMlight software package (http://svmlight.joachims.org/) was used to construct the SVM classifiers with the linear kernel function [14]. The polynomial and radial basis function (RBF) kernels were also tested for classifier con-struction, but the classifiers did not achieve high predic-tive performances in cross-validation tests.
Classifier evaluation and prediction
In this study, a tenfold cross-validation approach was used to evaluate classifiers with the following perfor-mance measures:
Accuracy (AC) = TP+TN
TP+TN+FP+FN (1)
Sensitivity (SN) = TP
TP+FN (2)
Specificiy (SP) = TN
TN+FP (3)
MCC = TP×TN−FP×FN
(TP+FP)(TP+FN)(TN+FP)(TN+FN)(4)
where TP is the number of true positives; TN is the number of true negatives; FP is the number of false positives; and FN is the number of false negatives. The Receiver Operating Characteristic (ROC) curve [15] and the area under the curve (AUC) [16] were also used for classifier evaluation and comparison.
The classifier construction and prediction were repeated ten times. In each run, classifier performance was evalu-ated using the above measures. The classifier was then used to predict tissue-specific genes in the human genome. The tissue-specific gene targets were sorted according to the average value of classifier outputs from ten predictions, and a higher value might indicate a higher probability of being expressed predominantly in a particular tissue.
Go enrichment and promoter sequence analyses
[17]. The probe names of candidate targets were used as
the inputs, and “GOTERM_BP_FAT”,“
GOTERM_CC_-FAT” and“GOTERM_MF_FAT” were utilized as the
Gene Ontology search option.
The 500 bp upstream sequences of predicted tissue-specific genes were downloaded from the UCSC Table Browser (http://genome.ucsc.edu/cgi-bin/hgTables) with the gene names of candidate targets as the inputs. The promoter sequences were used to identify the regulatory DNA motifs with SCOPE web server (http://genie.dart-mouth.edu/scope/). SCOPE [18] applied three learning algorithms to find different type of sequence motifs, including non-degenerate motifs, degenerate motifs, and bipartite motifs. The candidate regulatory motifs used in this study are the high scoring motifs (motif width≥6) returned from the combination of the prediction results. DiRE [19] (http://dire.dcode.org/) were used to analyse the candidate transcription factors of predicted tissue-specific genes. The gene names of candidate targets were used as the inputs, and the transcription factors for the regulatory elements of candidate targets identified with the Enhancer Identification method were reported.
Results and discussion
Dataset validation
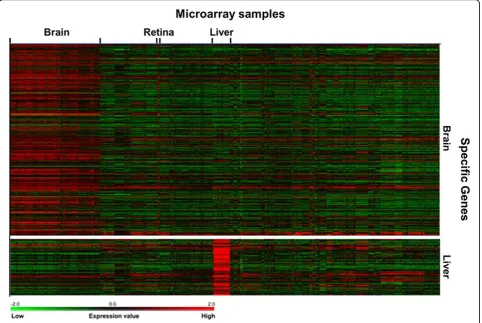
The known tissue-specific genes are expressed predomi-nantly in particular tissues, so the transcripts of the genes were expected to be detected in corresponding tissue samples in the integrated microarray dataset. To visualize the expression patterns of the known tissue-specific genes, TM4 MeV [20] was used to generate the heat maps for brain and liver-specific genes. As shown in Fig-ure 2, the known brain-specific genes have expression patterns in brain as well as retina samples. Since retina shares a common embryonic origin with brain and trans-lates visual images into nerve signals for brain, retina is considered as the sensory part of the brain. Thus, the known brain-specific genes may also have some expres-sion levels in retina samples.
The transcripts of known liver-specific genes are detected clearly in liver samples (Figure 2). The results suggest that the expression data according to our lists of known tissue-specific genes can provide useful informa-tion for classifier construcinforma-tion using machine learning methods. It is noteworthy that some probe sets of known tissue-specific genes have high expression or no expres-sion for all tissue samples. To improve the quality of clas-sifiers, the probes without detectable expression signals in all the samples are excluded from the training dataset.
Prediction of tissue-specific genes
Random Forests (RFs) and Support Vector Machines (SVMs) were used to construct classifiers for predicting brain and liver-tissue specific genes. The results suggest
that RF classifiers reached better predictive performance than SVM models (Table 1 and Figure 3). We identified 1,408 brain-specific microarray probes (1,126 genes) and 493 liver-specific probes (357 genes) using RF classifiers (Additional file 1 and 2), which are more than the tissue-selective genes identified in the previous study (222 brain-selective genes and 69 liver-selective genes) [9]. High scoring gene targets with brain or liver-specific expression have been examined (Tables 2 and 3), and the results suggest that the approach can be used to identify new gene targets for biomedical research. Moreover, it was shown that the transcripts of candidate genes could be detected clearly in corresponding tissue samples (Fig-ure 4), and the functions of the predicted targets were consistent with tissue origins in GO enrichment analysis (Tables 4 and 5). The regulatory DNA motifs were identi-fied based on the promoter sequences of the predicted tissue-specific genes, and the candidate transcription fac-tors were previously shown to regulate the specialized functions in particular tissues (Figure 5).
In this study, we constructed both RF and SVM classifiers for predicting brain and liver-specific genes. 403 probe sets of brain-specific genes and 90 probe sets of liver-spe-cific genes were used for classifier construction. For brain-specific gene prediction, the RF classifier achieved the AUC value at 0.9488 (Table 1), which is significantly higher than the AUC value of SVM classifier (AUC = 0.8937). The RF classifier reached 53.73% sensitivity and 97.43% specificity, and MCC = 0.5676. For liver-specific gene prediction, the SVM classifier gave MCC = 0.8350 and ROC AUC = 0.9854. The RF classifier achieved a similar level of performance with MCC = 0.8290 and ROC AUC = 0.9777. Thus, the results suggest that the RF algo-rithm performs better for predicting tissue-specific genes in this study.
The ROC curves of RF and SVM classifiers for predicting brain-specific genes and live-specific genes have been com-pared in Figure 2. The ROC curves of RF and SVM classi-fiers are not significantly different for the prediction of liver-specific genes (Figure 2b). However, The ROC curve of RF classifier was clearly better than the SVM classifier for the prediction of brain-specific genes (Figure 2a). The results confirm that RF classifier outperforms the SVM models for tissue-specific gene prediction. The possible reason is that RFs can handle a large number of input variables and avoid model overfitting. The use of 2,968 expression profiles for input vector encoding results in the same large number of input variables, which may lead to model overfitting. Inter-estingly, the RF algorithm can handle the situation and show better predictive performance in the present study.
Brain-specific gene expression
structure which contains different regions with specific functions. For example, the hippocampus is involved in spatial navigation and long-term memories, whereas the cerebral cortex plays key roles in language, attention and consciousness. Any damage in these regions results in various mental disorders including Alzheimer’s
dis-ease, Parkinson’s disease and Mood disorder. In this
study, the predicted brain-specific genes are expected to have preferential expression in the brain, and may play important roles in neuron functions such as synaptic transmission and neuronal migration.
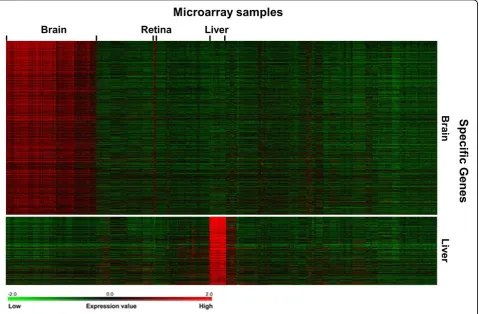
In the study, 1,408 candidate targets with positive scores (the average value of classifier outputs from ten predictions) were predicted as the brain-specific genes (Additional file 1). In Figure 4, the expression patterns of candidate gene targets using RF classifier are visualized with the heat maps generated using TM4 MeV. The pre-dicted targets show clear expression in brain samples, which indicates that our approach is useful for specific gene prediction. Similar to the known brain-specific genes, the transcripts of the predicted targets are also detected in retina samples. GO enrichment analysis
Figure 2Visualization of known tissue-specific gene expression patterns.
Table 1 Comparison of Random Forest and Support Vector Machine classifiers for predicting tissue-specific genes.
Tissue Method AC
(%)
SN (%)
SP (%)
MCC ROC
AUC
Brain SVM 92.07
(± 0.302)
54.23 (± 1.227)
95.82 (± 0.263) 0.5091 (± 0.015) 0.8937 (± 0.003)
RF 93.48
(± 0.240)
53.73 (± 1.485)
97.43 (± 0.153) 0.5676 (± 0.016) 0.9488 (± 0.002)
Liver SVM 97.29
(± 0.421)
84.11 (± 2.281)
98.61 (± 0.309) 0.8350 (± 0.025) 0.9854 (± 0.004)
RF 97.29
(± 0.341)
79.00 (± 1.355)
99.12 (± 0.255) 0.8290 (± 0.0213) 0.9777 (± 0.002)
of the candidate targets demonstrates that many candi-date genes have basic neuron functions (Table 4). For example, neurotransmission is an electrical or chemical signal motion within synapses caused by transmission of a nerve impulse. The predictions are enriched for
neuro-transmission-related GO terms such as “synapse”,
“synapse part”,“transmission of nerve impulse”,“neuron projection”,“synaptic transmission”and“passive
trans-membrane transporter activity”. Some channel-related
GO terms including“ion channel activity”, “substrate specific channel activity”, “gated channel activity” and
“channel activity”are detected in the enrichment analysis of our predictions.
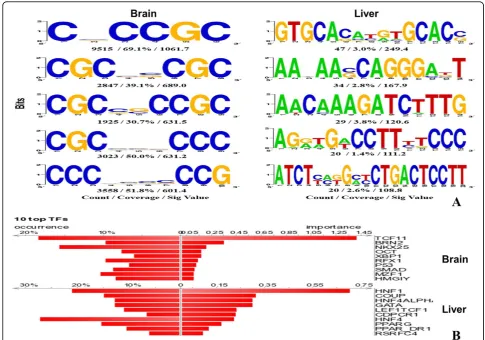
To understand the regulatory signals of human tissue-specific genes, SCOPE [18] was used to search for the overrepresented DNA motifs in the promoters of the pre-dicted brain-specific genes (Figure 5a). Some transcription factors might bind to the DNA motifs in the promoter regions and regulate the tissue-specific gene expression. DiRE [19] was used to identify the candidate transcription factors of the predicted brain-specific genes (Figure 5b). Interestingly, the identified transcription factors might be involved in regulating neuron development and function.
For example,BRN2andOCTbelong to the POU domain
protein family, and are involved in the differentiation and function of neural cells [21,22]. X-box-binding protein
Figure 3ROC curves to compare the performances of RF and SVM classifiers for predicting tissue-specific genes.
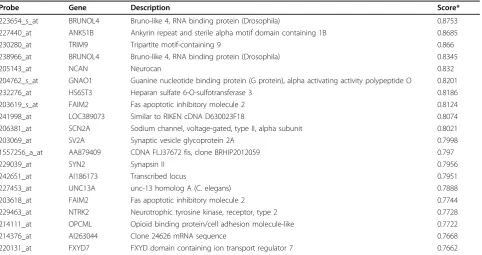
Table 2 List of high-scoring genes with specific expression in the brain.
Probe Gene Description Score*
223654_s_at BRUNOL4 Bruno-like 4, RNA binding protein (Drosophila) 0.8753 227440_at ANKS1B Ankyrin repeat and sterile alpha motif domain containing 1B 0.8685
230280_at TRIM9 Tripartite motif-containing 9 0.866
238966_at BRUNOL4 Bruno-like 4, RNA binding protein (Drosophila) 0.8345
205143_at NCAN Neurocan 0.832
204762_s_at GNAO1 Guanine nucleotide binding protein (G protein), alpha activating activity polypeptide O 0.8201
232276_at HS6ST3 Heparan sulfate 6-O-sulfotransferase 3 0.8186
203619_s_at FAIM2 Fas apoptotic inhibitory molecule 2 0.8124
241998_at LOC389073 Similar to RIKEN cDNA D630023F18 0.8074
206381_at SCN2A Sodium channel, voltage-gated, type II, alpha subunit 0.8021
203069_at SV2A Synaptic vesicle glycoprotein 2A 0.7998
1557256_a_at AA879409 CDNA FLJ37672 fis, clone BRHIP2012059 0.797
229039_at SYN2 Synapsin II 0.7956
242651_at AI186173 Transcribed locus 0.7951
227453_at UNC13A unc-13 homolog A (C. elegans) 0.7888
203618_at FAIM2 Fas apoptotic inhibitory molecule 2 0.7744
229463_at NTRK2 Neurotrophic tyrosine kinase, receptor, type 2 0.7728
214111_at OPCML Opioid binding protein/cell adhesion molecule-like 0.7722
214376_at AI263044 Clone 24626 mRNA sequence 0.7668
220131_at FXYD7 FXYD domain containing ion transport regulator 7 0.7662
Table 3 List of high-scoring genes with specific expression in the liver.
Probe Gene Description Score*
206610_s_at F11 Coagulation factor XI (plasma thromboplastin antecedent) 0.7869 1554491_a_at SERPINC1 Serpin peptidase inhibitor, clade C member 1 0.7737
219465_at APOA2 Apolipoprotein A-II 0.7609
217512_at BG398937 Unknown 0.7559
207102_at AKR1D1 Aldo-keto reductase family 1, member D1 0.7466
207218_at F9 Coagulation factor IX 0.725
210168_at C6 Complement component 6 0.7239
204987_at ITIH2 Inter-alpha (globulin) inhibitor H2 0.7191
209978_s_at LPA/PLG Lipoprotein, Lp(a)/plasminogen 0.7191
214069_at ACSM2 Acyl-CoA synthetase medium-chain family member 2 0.7099
206345_s_at PON1 Paraoxonase 1 0.7004
206651_s_at CPB2 Carboxypeptidase B2 (plasma) 0.6959
241914_s_at ACSM2 Acyl-CoA synthetase medium-chain family member 2 0.6945
206840_at AFM Afamin 0.6846
206410_at NR0B2 Nuclear receptor subfamily 0, group B, member 2 0.6837
214842_s_at ALB Albumin 0.6809
217319_x_at CYP4A11 Cytochrome P450, family 4, subfamily A, polypeptide 11 0.6772
242817_at PGLYRP2 Peptidoglycan recognition protein 2 0.6765
207407_x_at CYP4A11 Cytochrome P450, family 4, subfamily A, polypeptide 11 0.6752
231398_at SLC22A7 Solute carrier family 22, member 7 0.6746
* Score: the average value of RF classifier outputs from ten predictions.
1 (XBP1) is activated in neural development and plays a key role for the unfolded protein response in the
endoplas-mic reticulum [23]. Regulatory factor X1 (RFX1) can
enhance the expression of excitatory amino acid transpor-ters (EAAT) to regulate the glutamate neurotransmission [24]. Thep53protein is important for various cellular pro-cesses, including apoptosis, differentiation, DNA repair and cell-cycle arrest, in neurons [25]. The results suggest that the approach developed in the present study can pro-vide valuable information for studying the regulatory mod-ules of tissue-specific genes.
The predicted targets have not been annotated as brain-specific genes in the UniProt database. However, recent studies suggest that some of the predicted targets, includ-ingBRUNOL4, ANKS1B, TRIM9, NCAN, FAIM2, OPCML
andFXYD7(Table 2), are expressed predominantly in the brain. For example, the RNA-binding protein encoded by
BRUNOL4plays an important role in many cellular pro-cesses including RNA stability, pre-mRNA alternative spli-cing, mRNA editing and translation [26,27]. It was shown that the protein was predominantly expressed in the brain with enrichment in the hippocampus [28]. In this study,
the probes ofBRUNOL4have the highest (223654_s_at,
0.8753) and fourth-ranked (238966_at, 0.8600) scores.
ANKS1B encodes Amyloid-beta protein which can
regulate the nucleoplasmic coilin protein interactions in neuronal cells. Previous studies showed that the protein is mainly expressed in brain and may be implicated in Alzheimer’s disease [29]. Brain-specific E3 ligase encoded byTRIM9 has a high level of expression in the cerebral cortex and may be involved in the pathogenesis of Parkin-son’s disease [30]. Neurocan (NCAN) modulates neuronal adhesion and migration and is expressed preferentially in the brain [31]. The protein encoded byFAIM2could pro-tect cells from Fas-mediated apoptosis and shows a high level of expression in the hippocampus [32]. It was shown thatOPCMLwas expressed predominantly in cerebellum
and cerebral cortex [33], whereasFXYD7was expressed
preferentially in the brain [34].
The other predicted targets were not previously shown to have brain-specific expression. However, some of these
genes, including GNAO1, SV2A, SYN2, UNC13Aand
NTRK2, are involved in basic neuron functions (Table 2).
Guanine nucleotide binding protein (GNAO1) mediates
the physiological effects of various neuronal receptors
[35].SV2A, SYN2 andUNC13Aencode proteins which
are important for synaptic transmission in the central and peripheral nervous system [36,37].NTRK2encodes a neu-rotrophic tyrosine kinase receptor for brain-derived
neuro-trophic factor (BDNF) and is implicated in childhood
Table 4 GO term enrichment analysis of predicted brain-specific genes.
Category Term Count* %* P-Value*
GOTERM_CC_FAT GO:0045202~synapse 103 11.41 1.37E-49
GOTERM_CC_FAT GO:0044456~synapse part 83 9.19 2.68E-45
GOTERM_BP_FAT GO:0019226~transmission of nerve impulse 80 8.86 5.25E-36
GOTERM_CC_FAT GO:0043005~neuron projection 85 9.41 4.00E-35
GOTERM_BP_FAT GO:0007268~synaptic transmission 73 8.08 6.82E-35
GOTERM_MF_FAT GO:0005216~ion channel activity 76 8.42 2.29E-30
GOTERM_MF_FAT GO:0022838~substrate specific channel activity 77 8.53 3.03E-30
GOTERM_MF_FAT GO:0022836~gated channel activity 68 7.53 4.80E-30
GOTERM_MF_FAT GO:0015267~channel activity 77 8.53 3.28E-29
GOTERM_MF_FAT GO:0022803~passive transmembrane transporter activity 77 8.53 3.87E-29
*Count: the number of genes involved in the given GO term; %: the percentage of involved genes in total genes; P-Value: the modified Fisher Exact P-Value.
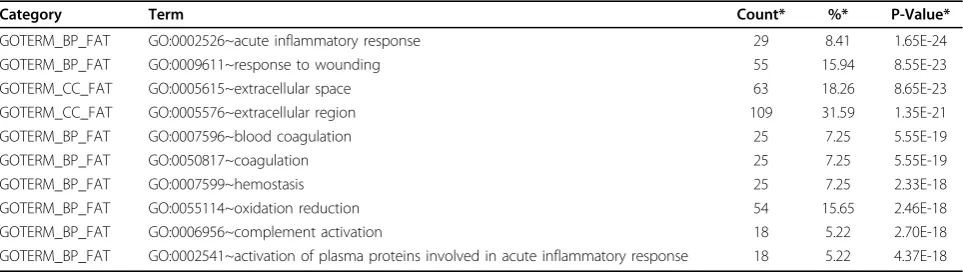
Table 5 GO term enrichment analysis of predicted liver-specific genes.
Category Term Count* %* P-Value*
GOTERM_BP_FAT GO:0002526~acute inflammatory response 29 8.41 1.65E-24
GOTERM_BP_FAT GO:0009611~response to wounding 55 15.94 8.55E-23
GOTERM_CC_FAT GO:0005615~extracellular space 63 18.26 8.65E-23
GOTERM_CC_FAT GO:0005576~extracellular region 109 31.59 1.35E-21
GOTERM_BP_FAT GO:0007596~blood coagulation 25 7.25 5.55E-19
GOTERM_BP_FAT GO:0050817~coagulation 25 7.25 5.55E-19
GOTERM_BP_FAT GO:0007599~hemostasis 25 7.25 2.33E-18
GOTERM_BP_FAT GO:0055114~oxidation reduction 54 15.65 2.46E-18
GOTERM_BP_FAT GO:0006956~complement activation 18 5.22 2.70E-18
GOTERM_BP_FAT GO:0002541~activation of plasma proteins involved in acute inflammatory response 18 5.22 4.37E-18
mood disorder [38]. By contrast, the functions of some high scoring genes in brain remain to be characterized.
HS6ST3encodes a Heparan sulphate sulfotransferase which plays a key role in the modulation of fibroblast growth factor signalling [39]. The protein encoded by
SCN2Aforms a voltage-dependent sodium channel and is associated with generalized epilepsy with febrile seizures plus [40]. The corresponding genes of three cDNA
sequences (LOC389073, AA879409andAI186173) were
not determined, and their functions in the brain are not clear. The results suggest that the machine learning approach developed in the present study can be used to identify some interesting targets for further experimental studies.
Liver-specific gene expression
The liver is a vital organ for human metabolism, and plays key roles in detoxification, plasma protein synthesis, glyco-gen storage and hormone production. For example, liver is the source and target organ of inflammatory mediators in
the pathogenesis of inflammatory response syndrome [41], and it is responsible for the production of coagulation fac-tors. Thus, the liver-specific targets identified in this study might be involved in basic liver functions. We identified 493 liver-specific gene targets with positive scores in the analysis (Additional file 2). The functional analysis of the liver-specific gene targets using RF classifier confirms that many of the predicted targets are enriched for liver-related GO terms (Table 5). For example, the GO terms for
inflammatory response contained“acute inflammatory
response”,“response to wounding”and“activation of plasma proteins involved in acute inflammatory response"; the coagulation-related GO terms included“blood coagu-lation”,“coagulation”and“hemostasis”. The expression patterns of the predicted liver-specific genes are visualized with the heat map (Figure 3). Clearly, the transcripts of the predicted targets are predominantly detected in liver samples. Some DNA motifs overrepresented in the pro-moter regions of predicted liver-specific genes have been identified (Figure 5a), and the candidate transcription
factors may be involved in the regulation of the specialized functions of liver (Figure 5b). For example, Chicken oval-bumin upstream promoter (COUP) can reduce the expres-sion of hepatocyte nuclear factor 4 (HNF4), which plays a key role in blood coagulation and hepatic metabolism [42]. As listed in Table 3, 17 of the top 20 high-scoring genes are involved in the metabolism of human liver.
The genes, including F11, F9, SERPINC1, APOA2,
AKR1D1, ACSM2, ITIH2, PON1, CPB2, AFM, NR0B2, ALB, CYP4A11, PGLYRP2 andSLC22A7, have not been annotated as liver-specific genes in UniProt. However, recent studies suggest that some of these genes are expressed preferentially in the liver. For example,F11, F9 and SERPINC1 are involved in the regulation of
blood coagulation cascade [43].APOA2 encodes
apoli-poprotein which is synthesized mainly in liver and involved in the metabolism of high density lipoprotein
[44]. AKR1D1encodes the aldo-keto reductase
catalyz-ing the reduction of steroid hormones [45], whereas
ACSM2 encodes enzyme catalyzing the activation of medium-chain length fatty acids [46]. The expression and functions of other three predictions (BG398937, C6
andLPA) have not been documented in the literature.
Tissue-selective gene prediction
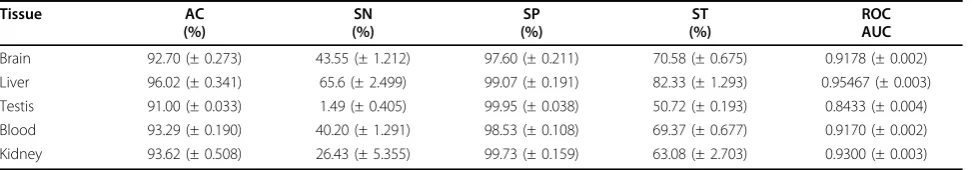
Tissue-specific genes are considered as the special case of tissue-selective genes. Our approach was developed for tissue-specific gene predictions, but its application to tis-sue-selective gene predictions is straightforward. In this study, the RF classifiers were used to predict the genes that are expressed preferentially in the brain, liver, testis, blood and kidney. The RF classifiers reached high predic-tive performance for tissue-selecpredic-tive gene prediction (Table 6 and Additional file 3). For example, the classifier for brain-selective gene prediction shows overall accuracy (AC) at 92.70% with Matthews Correlation Coefficient (MCC) = 0.4925. The classifier for liver-selective gene prediction gave predictive performance with the overall accuracy at 96.02% and MCC = 0.7378. It is noteworthy that the classifiers used for tissue-specific gene prediction achieved higher predictive performance than those for tissue-selective gene prediction. For instance, the AUC value of RF classifier for brain-specific gene prediction
(AUC = 0.9488, Table 1) is higher than that for brain-selective gene prediction (AUC = 0.9178, Table 6), whereas the RF classifier gave better predictive perfor-mance for liver-specific gene prediction (AUC = 0.9777, Table 1) than liver-selective gene prediction (AUC = 0.9547, Table 6). The possible explanation is that the tis-sue-specific genes are expressed specifically in only one particular tissue type, thus the clear expression patterns of the genes may improve the quality of classifiers and result in high predictive performance for predictions.
The RF classifiers gave high predictive performance for predicting genes that have preferential expression in other tissue types. The testis is the male sex gland, which produces sperm, male reproductive cell and sex hormones. The classifier for testis-selective gene predic-tion reached predictive performance with overall accu-racy at 91.00% and ROC AUC = 0.8433. The blood transports oxygen and nutrients to other tissues and carries away waste products from cells. The classifier for blood-selective gene prediction showed overall accuracy at 93.29% with MCC = 0.5109 and ROC AUC = 0.9170. The kidneys play key roles in urinary system. The organs filter waste products from the blood and excrete them in urine. The classifier for kidney-selective gene prediction achieved predictive performance with overall accuracy at 93.62% with MCC = 0.4648 and ROC AUC = 0.9300. The results suggest that our approach can be used to identify the genes that have preferential expression in different types of tissues.
Conclusions
A machine learning approach has been developed in this study for identifying the human tissue-specific gene tar-gets. Random Forests (RFs) and Support Vector Machines (SVMs) were trained separately with the microarray gene expression data to construct classifiers for prediction. It was shown that the RF classifiers out-perform SVM models for tissue-specific gene prediction. 1,408 brain-specific gene targets and 493 liver-specific gene targets were identified using RF classifiers. The predicted targets show clear expression patterns in cor-responding tissue samples, and they have functions and regulatory elements consistent with the tissues in GO
Table 6 Random Forest classifiers for predicting tissue-selective genes.
Tissue AC
(%)
SN (%)
SP (%)
ST (%)
ROC AUC
Brain 92.70 (± 0.273) 43.55 (± 1.212) 97.60 (± 0.211) 70.58 (± 0.675) 0.9178 (± 0.002) Liver 96.02 (± 0.341) 65.6 (± 2.499) 99.07 (± 0.191) 82.33 (± 1.293) 0.95467 (± 0.003) Testis 91.00 (± 0.033) 1.49 (± 0.405) 99.95 (± 0.038) 50.72 (± 0.193) 0.8433 (± 0.004) Blood 93.29 (± 0.190) 40.20 (± 1.291) 98.53 (± 0.108) 69.37 (± 0.677) 0.9170 (± 0.002) Kidney 93.62 (± 0.508) 26.43 (± 5.355) 99.73 (± 0.159) 63.08 (± 2.703) 0.9300 (± 0.003)
enrichment analysis and transcription factor prediction. The analysis of high-scoring candidate genes for brain and liver specific expression suggests that our approach can select some interesting targets for further experi-mental studies. Our approach could also provide useful information for tissue-selective gene prediction. The approach can be used to develop new drug targets for biomedical research and expand our knowledge of tis-sue-specific expression.
Additional material
Additional file 1: List of brain-specific gene targets. The full list of candidate brain-specific genes identified in this study with positive scores.
Additional file 2: List of liver-specific gene targets. The full list of candidate liver-specific genes identified in this study with positive scores.
Additional file 3: Figure S1 ROC curves to show the RF classifier performances for predicting different tissue-selective genes.
Authors’contributions
LW initiated and oversaw the project. ST and LW designed the study. ST conducted the data analysis and drafted the manuscript. JY and LW contributed to result interpretation and manuscript preparation.
Competing interests
The authors declare that they have no competing interests.
Acknowledgements
This work is supported by the CSREES/USDA, under project number SC-1700355.
This article has been published as part ofBMC Medical GenomicsVolume 6 Supplement 1, 2013: Proceedings of the 2011 International Conference on Bioinformatics and Computational Biology (BIOCOMP’11). The full contents of the supplement are available online at http://www.biomedcentral.com/ bmcmedgenomics/supplements/6/S1. Publication of this supplement has been supported by the International Society of Intelligent Biological Medicine.
Author details
1Department of Genetics and Biochemistry, Clemson University, Clemson, SC 29634, USA.2Harvard Medical School, Harvard University, P.O. Box 400888, Cambridge, MA 02115, USA.3J.C. Self Research Institute of Human Genetics, Greenwood Genetic Center, Greenwood, SC 29646, USA.
Published: 23 January 2013
References
1. Lage K, Hansen NT, Karlberg EO, Eklund AC, Roque FS, Donahoe PK, Szallasi Z, Jensen TS, Brunak S:A large-scale analysis of tissue-specific pathology and gene expression of human disease genes and complexes.Proc Natl Acad Sci USA2008,105(52):20870-20875. 2. Saltiel AR, Kahn CR:Insulin signalling and the regulation of glucose and
lipid metabolism.Nature2001,414(6865):799-806.
3. Liotta LA, Kohn EC:The microenvironment of the tumour-host interface.
Nature2001,411(6835):375-379.
4. Goh KI, Cusick ME, Valle D, Childs B, Vidal M, Barabasi AL:The human disease network.Proc Natl Acad Sci USA2007,104(21):8685-8690. 5. Kadota K, Nishimura S, Bono H, Nakamura S, Hayashizaki Y, Okazaki Y,
Takahashi K:Detection of genes with tissue-specific expression patterns using Akaike’s information criterion procedure.Physiol Genomics2003,
12(3):251-259.
6. Kadota K, Ye J, Nakai Y, Terada T, Shimizu K:ROKU: a novel method for identification of tissue-specific genes.BMC Bioinformatics2006,7:294.
7. Liang S, Li Y, Be X, Howes S, Liu W:Detecting and profiling tissue-selective genes.Physiol Genomics2006,26(2):158-162.
8. Chikina MD, Huttenhower C, Murphy CT, Troyanskaya OG:Global prediction of tissue-specific gene expression and context-dependent gene networks in Caenorhabditis elegans.PLoS Comput Biol2009,5(6): e1000417.
9. Wang L, Srivastava AK, Schwartz CE:Microarray data integration for genome-wide analysis of human tissue-selective gene expression.BMC
Genomics2010,11(Suppl 2):S15.
10. Li C, Hung Wong W:Model-based analysis of oligonucleotide arrays: model validation, design issues and standard error application.Genome Biol2001,2(8):RESEARCH0032.
11. Li C, Wong WH:Model-based analysis of oligonucleotide arrays: expression index computation and outlier detection.Proc Natl Acad Sci USA2001,98(1):31-36.
12. Liaw A, Wiener M:Classification and Regression by randomForest.R News 2002,2(3):18-22.
13. Noble WS:What is a support vector machine?Nat Biotechnol2006,
24(12):1565-1567.
14. Joachims T:Learning to classify text using support vector machines.
Boston: Kluwer Academic Publishers; 2002.
15. Swets JA:Measuring the accuracy of diagnostic systems.Science1988,
240(4857):1285-1293.
16. Bradley A:The use of the area under the ROC curve in the evaluation of machine learning algorithms.Pattern Recognition1997,30:1145-1159. 17. Dennis G Jr, Sherman BT, Hosack DA, Yang J, Gao W, Lane HC, Lempicki RA:
DAVID: Database for Annotation, Visualization, and Integrated Discovery.
Genome Biol2003,4(5):P3.
18. Carlson JM, Chakravarty A, DeZiel CE, Gross RH:SCOPE: a web server for practical de novo motif discovery.Nucleic Acids Res2007,35(Web Server): W259-264.
19. Gotea V, Ovcharenko I:DiRE: identifying distant regulatory elements of co-expressed genes.Nucleic Acids Res2008,36(Web Server):W133-139. 20. Saeed AI, Bhagabati NK, Braisted JC, Liang W, Sharov V, Howe EA, Li J,
Thiagarajan M, White JA, Quackenbush J:TM4 microarray software suite.
Methods Enzymol2006,411:134-193.
21. Fujii H, Hamada H:A CNS-specific POU transcription factor, Brn-2, is required for establishing mammalian neural cell lineages.Neuron1993,
11(6):1197-1206.
22. Yamanaka T, Tosaki A, Miyazaki H, Kurosawa M, Furukawa Y, Yamada M, Nukina N:Mutant huntingtin fragment selectively suppresses Brn-2 POU domain transcription factor to mediate hypothalamic cell dysfunction.
Hum Mol Genet2010,19(11):2099-2112.
23. Hayashi A, Kasahara T, Iwamoto K, Ishiwata M, Kametani M, Kakiuchi C, Furuichi T, Kato T:The role of brain-derived neurotrophic factor (BDNF)-induced XBP1 splicing during brain development.J Biol Chem2007,
282(47):34525-34534.
24. Ma K, Zheng S, Zuo Z:The transcription factor regulatory factor X1 increases the expression of neuronal glutamate transporter type 3.J Biol Chem2006,281(30):21250-21255.
25. Tedeschi A, Di Giovanni S:The non-apoptotic role of p53 in neuronal biology: enlightening the dark side of the moon.EMBO Rep2009,
10(6):576-583.
26. Anant S, Henderson JO, Mukhopadhyay D, Navaratnam N, Kennedy S, Min J, Davidson NO:Novel role for RNA-binding protein CUGBP2 in mammalian RNA editing. CUGBP2 modulates C to U editing of apolipoprotein B mRNA by interacting with apobec-1 and ACF, the apobec-1 complementation factor.J Biol Chem2001,276(50):47338-47351. 27. Mukhopadhyay D, Houchen CW, Kennedy S, Dieckgraefe BK, Anant S:
Coupled mRNA stabilization and translational silencing of cyclooxygenase-2 by a novel RNA binding protein, CUGBP2.Mol Cell 2003,11(1):113-126.
28. Yang Y, Mahaffey CL, Berube N, Maddatu TP, Cox GA, Frankel WN:Complex seizure disorder caused by Brunol4 deficiency in mice.PLoS Genet2007,
3(7):e124.
29. Ghersi E, Noviello C, D’Adamio L:Amyloid-beta protein precursor (AbetaPP) intracellular domain-associated protein-1 proteins bind to AbetaPP and modulate its processing in an isoform-specific manner.J
Biol Chem2004,279(47):49105-49112.
Parkinson’s disease and dementia with Lewy bodies.Neurobiol Dis2010,
38(2):210-218.
31. Rauch U, Karthikeyan L, Maurel P, Margolis RU, Margolis RK:Cloning and primary structure of neurocan, a developmentally regulated,
aggregating chondroitin sulfate proteoglycan of brain.J Biol Chem1992,
267(27):19536-19547.
32. Somia NV, Schmitt MJ, Vetter DE, Van Antwerp D, Heinemann SF, Verma IM:
LFG: an anti-apoptotic gene that provides protection from Fas-mediated cell death.Proc Natl Acad Sci USA1999,96(22):12667-12672.
33. Reed JE, Dunn JR, du Plessis DG, Shaw EJ, Reeves P, Gee AL, Warnke PC, Sellar GC, Moss DJ, Walker C:Expression of cellular adhesion molecule
‘OPCML’is down-regulated in gliomas and other brain tumours.
Neuropathol Appl Neurobiol2007,33(1):77-85.
34. Tipsmark CK:Identification of FXYD protein genes in a teleost: tissue-specific expression and response to salinity change.Am J Physiol Regul
Integr Comp Physiol2008,294(4):R1367-1378.
35. Kest B, Smith SB, Schorscher-Petcu A, Austin JS, Ritchie J, Klein G, Rossi GC, Fortin A, Mogil JS:Gnao1 (G alphaO protein) is a likely genetic contributor to variation in physical dependence on opioids in mice.
Neuroscience2009,162(4):1255-1264.
36. Li L, Chin LS, Greengard P, Copeland NG, Gilbert DJ, Jenkins NA:
Localization of the synapsin II (SYN2) gene to human chromosome 3 and mouse chromosome 6.Genomics1995,28(2):365-366.
37. Portela-Gomes GM, Lukinius A, Grimelius L:Synaptic vesicle protein 2, a new neuroendocrine cell marker.Am J Pathol2000,157(4):1299-1309. 38. Adams JH, Wigg KG, King N, Burcescu I, Vetro A, Kiss E, Baji I, George CJ,
Kennedy JL, Kovacs M,et al:Association study of neurotrophic tyrosine kinase receptor type 2 (NTRK2) and childhood-onset mood disorders.
Am J Med Genet B Neuropsychiatr Genet2005,132B(1):90-95.
39. Kamimura K, Fujise M, Villa F, Izumi S, Habuchi H, Kimata K, Nakato H:
Drosophila heparan sulfate 6-O-sulfotransferase (dHS6ST) gene. Structure, expression, and function in the formation of the tracheal system.J Biol Chem2001,276(20):17014-17021.
40. Sugawara T, Tsurubuchi Y, Agarwala KL, Ito M, Fukuma G, Mazaki-Miyazaki E, Nagafuji H, Noda M, Imoto K, Wada K,et al:A missense mutation of the Na+ channel alpha II subunit gene Na(v)1.2 in a patient with febrile and afebrile seizures causes channel dysfunction.Proc Natl Acad Sci USA2001,
98(11):6384-6389.
41. Szabo G, Romics L Jr, Frendl G:Liver in sepsis and systemic inflammatory response syndrome.Clin Liver Dis2002,6(4):1045-1066, x.
42. Schrem H, Klempnauer J, Borlak J:Liver-enriched transcription factors in liver function and development. Part I: the hepatocyte nuclear factor network and liver-specific gene expression.Pharmacol Rev2002,
54(1):129-158.
43. Kalafatis M, Egan JO, van’t Veer C, Cawthern KM, Mann KG:The regulation of clotting factors.Crit Rev Eukaryot Gene Expr1997,7(3):241-280. 44. Zhang T, Yao S, Wang P, Yin C, Xiao C, Qian M, Liu D, Zheng L, Meng W,
Zhu H,et al:Apoa-Ii directs morphogenetic movements of zebrafish embryo by preventing chromosome fusion during nuclear division in yolk syncytial layer.J Biol Chem2011.
45. Charbonneau A, The VL:Genomic organization of a human 5beta-reductase and its pseudogene and substrate selectivity of the expressed enzyme.Biochim Biophys Acta2001,1517(2):228-235.
46. Boomgaarden I, Vock C, Klapper M, Doring F:Comparative analyses of disease risk genes belonging to the acyl-CoA synthetase medium-chain (ACSM) family in human liver and cell lines.Biochem Genet2009, 47(9-10):739-748.
doi:10.1186/1755-8794-6-S1-S10
Cite this article as:Tenget al.:Genome-wide prediction and analysis of human tissue-selective genes using microarray expression data.BMC
Medical Genomics20136(Suppl 1):S10.
Submit your next manuscript to BioMed Central and take full advantage of:
• Convenient online submission
• Thorough peer review
• No space constraints or color figure charges
• Immediate publication on acceptance
• Inclusion in PubMed, CAS, Scopus and Google Scholar
• Research which is freely available for redistribution