Open Access
Research article
Classification of human cancers based on DNA copy number
amplification modeling
Samuel Myllykangas*
1, Jarkko Tikka
2, Tom Böhling
1, Sakari Knuutila
1and
Jaakko Hollmén*
2Address: 1Department of Pathology, Haartman Institute and HUSLAB, University of Helsinki and Helsinki University Central Hospital, P.O. Box
21, FI-00014, University of Helsinki, Helsinki, Finland and 2Department of Information and Computer Science, Helsinki University of
Technology, P.O. Box 5400, FI-02015 TKK, Espoo, Finland
Email: Samuel Myllykangas* - [email protected]; Jarkko Tikka - [email protected]; Tom Böhling - [email protected]; Sakari Knuutila - [email protected]; Jaakko Hollmén* - [email protected]
* Corresponding authors
Abstract
Background: DNA amplifications alter gene dosage in cancer genomes by multiplying the gene copy number. Amplifications are quintessential in a considerable number of advanced cancers of various anatomical locations. The aims of this study were to classify human cancers based on their amplification patterns, explore the biological and clinical fundamentals behind their amplification-pattern based classification, and understand the characteristics in human genomic architecture that associate with amplification mechanisms.
Methods: We applied a machine learning approach to model DNA copy number amplifications using a data set of binary amplification records at chromosome sub-band resolution from 4400 cases that represent 82 cancer types. Amplification data was fused with background data: clinical, histological and biological classifications, and cytogenetic annotations. Statistical hypothesis testing was used to mine associations between the data sets.
Results: Probabilistic clustering of each chromosome identified 111 amplification models and divided the cancer cases into clusters. The distribution of classification terms in the amplification-model based clustering of cancer cases revealed cancer classes that were associated with specific DNA copy number amplification models. Amplification patterns – finite or bounded descriptions of the ranges of the amplifications in the chromosome – were extracted from the clustered data and expressed according to the original cytogenetic nomenclature. This was achieved by maximal frequent itemset mining using the cluster-specific data sets. The boundaries of amplification patterns were shown to be enriched with fragile sites, telomeres, centromeres, and light chromosome bands.
Conclusions: Our results demonstrate that amplifications are non-random chromosomal changes and specifically selected in tumor tissue microenvironment. Furthermore, statistical evidence showed that specific chromosomal features co-localize with amplification breakpoints and link them in the amplification process.
Published: 14 May 2008
BMC Medical Genomics 2008, 1:15 doi:10.1186/1755-8794-1-15
Received: 12 December 2007 Accepted: 14 May 2008
This article is available from: http://www.biomedcentral.com/1755-8794/1/15 © 2008 Myllykangas et al; licensee BioMed Central Ltd.
Background
Alterations that increase DNA copy number are frequently observed in a variety of human cancers [1,2]. An amplifi-cation is a mutation that increases the copy number of a specific DNA segment in a cancer cell [3,4]. A normal dip-loid genome contains two DNA copies, while amplifica-tion increases the DNA copy number [5]. High-level gene amplifications may significantly elevate the gene copy number, e.g., the amplifications of MYC and EGFR onco-genes have been shown to be more than hundred-fold in neuroblastoma [6] and gliomas [7]. Gene amplifications have clinical relevance as targets for therapy and in predic-tive diagnosis. For example, amplification of the ERBB2 gene is an indicator for trastuzumab (Herceptin®) treat-ment of patients with metastatic breast cancer. In general, cancers with DNA copy number amplifications have worse prognosis and poorer survival than cancers that do not manifest amplifications. The amplifications have been shown to associate with adverse clinical outcomes, i.e., high grade and advanced stage, metastasis, and poor response to therapy [8].
The guidelines for classification of tumors have been established by the World Health Organization (WHO) [9]. The WHO classification is based on the evaluation of the primary organ site, morphology, cell type, histology, and malignancy state. In addition, the epidemiological, etiological, clinical, and genetic features of tumors have been evaluated. In a subset of hematologic malignancies, specific mutations and translocations have been used in classification but otherwise tumor classification is based on clinical, histological, and pathological parameters. Although a wide range of cancer subtype-specific genetic abnormalities are known, they are rarely used to classify cancers. Given that genomic changes underlie the cancer phenotype, DNA copy number amplification is a justified foundation for classification. Nonetheless, molecular properties underlie phenotypic changes in cancer cells and contribute to the clinical outcome. Thus, molecular classification of cancers is well-founded. DNA copy number amplifications are suitable classification targets, because they are relatively prevalent in a variety of cancers. Since 1992, it has been possible to screen DNA copy number amplifications in genome-wide coverage using comparative genomic hybridization (CGH) [10] and large amounts of DNA copy number data from different cancers have been published and collected [1,11].
In a previous amplification profiling study, we identified four separate clusters and showed that the clusters based on DNA copy number amplifications comprised anatom-ically similar neoplasms [1]. For example, gastrointestinal adenocarcinomas (gastric cancer, colorectal cancer, and Barrett's adenocarcinoma) clustered together. Similar clustering emerged when amplification-activated
onco-genes were analyzed using hierarchical clustering [8]: can-cers with similar embryonic background (hematopoietic, mesenchymal or epithelial) formed separate clusters. Even though cancer types inside the identified clusters showed similar biological backgrounds, using the profil-ing approach, specific amplifications could not be appointed for specific cancer classes and analytical assess-ment was not plausible. Here, we used probabilistic mod-eling and a collection of DNA copy number amplifications, and identified 111 specific amplification models. Modeling was performed based on mixtures of multivariate Bernoulli distributions (see sub-section of methods entitled "Probabilistic modeling of DNA copy number amplification" for details). Based on the amplifi-cation modeling, the cancer cases were divided into clus-ters. Specific cancer cases, either of the same type or etiology, were shown to associate with specific amplifica-tion model-based clusters. Compact and comprehensible presentations for probabilistic amplification models, amplification patterns, were extracted using maximal fre-quent itemset mining (see sub-section of methods enti-tled "Finite descriptions for continuous DNA copy number amplification models" for details). Amplification patterns represent the ranges and structures of the ampli-cons. We present statistical evidence showing that fragile sites, telomeres, centromeres, and light chromosome bands are enriched at the amplicon boundaries, linking them to the mechanisms of amplification.
Methods
DNA copy number amplification and cancer classification data
exposures. Inflammatory etiologies of neoplasms and underlying conditions were defined according to litera-ture. Tumor behavior was defined according to the stage (cancer, benign, and border line). After the neoplasms were filtered to include only malignant cancers and to dis-card benign, borderline, and non-malignant tumors, the number of cancer types was 82.
Probabilistic modeling of DNA copy number amplification
We applied machine learning techniques to model DNA copy number amplifications. The goal of probabilistic modeling is to estimate an unknown probability distribu-tion based on observadistribu-tions to describe the inherent struc-ture in the data. Finite mixstruc-ture models are powerful and widely used in the estimation of complex probability dis-tributions [13,14]. The advantage of a mixture model is that its components can represent different parts of the true distribution, which would be impossible to estimate by a single parametric distribution. In this work, we con-centrated on the mixtures of multivariate Bernoulli distri-butions, since the representation of our DNA copy number amplification data was binary.
Analysis of DNA copy number amplification data was car-ried out separately for each human chromosome (except chromosome Y). Due to the low number of observations and insufficient resolution, the Y chromosome was excluded from the analysis. The mixture models were con-structed separately for each chromosome, since only 10 percent of the observations showed amplification in more than one chromosome. The observations with amplifica-tion in several chromosomes were included in the analysis of corresponding chromosomes. In brief, DNA copy number amplification data of cancers including N = 4402 cases were used in the modeling. DNA copy number amplification data can be presented as binary vectors x ∈ {0,1}d in which x
i = 1 denotes an amplified chromosome
band and xi = 0 stands for a non-amplified band and d is the number of bands. The probabilities of the outcomes of observation x = (x1,..., xd) were modelled as θi = P(xi = 1),i = 1,..., d. Probability of the observed vector x was esti-mated using the finite mixture of multivariate Bernoulli distributions
,
where denotes the parameters of the
model. The multivariate Bernoulli distributions p(x|θj), j = 1,..., J, also called the component distributions, are parameterized by θj = (θj1,..., θjd) and πj are mixture
pro-portions with the properties πj ≥ 0 and .
Although the finite mixture of multivariate Bernoulli dis-tributions have been shown to be non-identifiable [15], they are useful in practical estimation problems [16].
In the case of N observations xn, n= 1,..., N and J mixture
components, the maximum likelihood estimates of the
parameters are obtained by maximizing the
log-likelihood of the observations
. The
optimiza-tion was carried out using the Expectaoptimiza-tion-Maximizaoptimiza-tion (EM) algorithm [17-19]. The derivation of the EM algo-rithm for the finite mixture of multivariate Bernoulli dis-tributions has been explained in detail by Everitt and Hand [14]. In the E-step, the posterior probabilities that the jth component distribution has generated the data point xn are evaluated. In the M-step, the values of
param-eters are updated using the evaluated
poste-rior probabilities. The iteration between E- and M-steps gives monotonically increasing series of the values for the log-likelihood. The EM algorithm was terminated when the relative change in log-likelihood was smaller than10 -4. According to Carreira-Perpiran and Renals, and Tikka et
al. [16,20], the initial values of parameters θji, j = 1,..., J, i = 1,..., d were selected randomly from range 0.25–0.75 and the initial values of mixture proportions were πj = 1/J.
In order to select a model with an appropriate complexity, the number of component distributions J was selected using 5-fold cross validation [21] that was repeated 10 times varying J from 2 to 30. The selected number of com-ponents maximized the validation log-likelihood, except in five cases, when less complex models were chosen to achieve validation log-likelihood that was in practice as good as the estimated optimum. Less complex models were chosen for chromosomes 3, 7, 8, 17, and 21. The final mixture model, with the number of component dis-tributions based on cross validation, was trained 5 times and the model maximizing the log-likelihood was selected. The repetitions were done to avoid the local maxima in the log-likelihood. The obtained component distributions were regarded as DNA copy number ampli-fication models.
p jp
j J j j j J jix i d ji x i i
x|ΘΘ x|
(
)
=(
)
=(
−)
= = =
−
∑
π∑ ∏
π θ θ1 1 1
1 1
θθ
ΘΘ =
{
{
}
}
=
J j j j
J , π θθ, 1 πj j J = =
∑
1 1 ˆ , ˆπj j
j J
θθ
{
}
=1l n N j j J ji x ji x i d ni ni =
(
−)
= = − =∑
log∑ ∏
1 1 1 1 1 π θ θ ˆ , ˆ
πj j
j J
θθ
Data mining from DNA copy number amplification model-based clusters
We applied data mining techniques and WHO derived cancer classifications as background data to explore the amplification model-based clustering of cancer cases. Cancer cases were divided into separate clusters for each chromosome using the inherent structure of DNA copy number amplification models. The component distribu-tions of mixture model define clusters. Following the probabilistic approach, each observation was allocated to cluster j*, which maximizes the posterior probability according to Bayes's theorem
.
Then, the observations belonging to cluster j were charac-terized by the corresponding component distribution θj. After clustering, the data in each cluster were divided into a test group and a reference group according to the col-lected classification terms. The test group contained those cases that were associated with a specific classification term (e.g., tobacco-related) and the reference group con-tained all other cases (not related to tobacco). Proportions of observations in each cluster fj1 and fj0 were calculated for the test and the reference group, respectively. The dif-ferences in cluster-specific observation proportions were compared by performing a pooled proportions statistical test [22]. The null hypothesis H0 stated that the propor-tions are equal fj1 = fj0 and alternative hypothesis H1 was that the proportion in the test group is larger than that in the reference group fj1 > fj0 or vice versa. The test statistic for the pooled proportions test is defined as
, where and n1
and n0 are the number of observations in the test group and in the reference group, respectively. The test statistic z is approximately normally distributed with zero mean and unit variance. The described test was carried out for each amplification pattern and classification term.
Due to the large number of hypotheses, we used the fol-lowing procedure for control of the false discovery rate
[23]. Let denote the observed ordered
unadjusted p-values, where m is the number of hypotheses (m = 13659). For control of the false discovery rate at level
αsearch .
The null hypotheses are rejected in the case of i ≤i*. In the experiments, we used the significance level α = 0.001, which corresponded to the unadjusted p-value 0.00005. Thus, the alternative hypothesis was accepted, i.e., the dif-ference was regarded statistically significant, when the p -value of the test was lower than 0.00005.
Finite descriptions for continuous DNA copy number amplification models
Fusing of amplification models with relevant genomic mapping data required that continuous models were transformed into compact representations in the original nomenclature of the chromosomal bands. Finite descrip-tions, namely amplification patterns, were formed using maximal frequent itemset mining as presented earlier [24]. For the definitions and notations used in the follow-ing brief technical description of maximal frequent item-sets, we refer to Burdick et al. [25]. In a binary database with xi = {0,1}d and index set I = {1,...d}, an itemset is a
subset of the index set I and a k-itemset is an itemset with cardinality k [25]. Support for an itemset X is defined as the frequency of the rows in the database including the items in X, i.e., how often X occurs in the database. σis a predefined parameter that sets a threshold for selecting frequent itemsets. The mining task is to find all itemsets that have a frequency higher than σ. These are regarded as frequent itemsets. If an itemset X is frequent and no super-set of X is frequent, we say that X is a maximal frequent itemset. The implementation by Burdick et al. [25] inte-grates a depth-first traversal of the itemset lattice with effective pruning mechanisms that significantly improve mining performance. We use maximal frequent itemsets in summarizing the marginal distribution of the clusters in a compact and understandable manner. In mining for the amplification patterns in the clustered data sets, we used a frequency threshold of σ= 0.5, so that the amplifi-cation patterns would be representative of the clusters in question. In simple terms, amplification patterns portray amplification models using finite ranges that capture the chromosomal structure of the amplified DNA element (also referred to as amplicon). The resulting amplification patterns are collections of the largest sets of chromosomal bands that occur jointly (together) in more than half of the data cases. The amplification patterns are thought to be representative of the whole cluster. As such, they repre-sent the most probable amplicon structures and were used to map amplicon boundaries and putative DNA double-strand breakpoints.
Data mining from amplification patterns
A way to investigate the nature of DNA copy number amplification patterns is to compare them with relevant cytogenetic background data. For data mining, amplifica-tion patterns were used to depict the amplicon structures and identify putative ends of the amplified regions. j
j j j ji
x
ji x
i d
p j p j p
i i
∗ −
=
=arg max ( ) ( )( )x| =arg max
∏
(
−)
x π θ 1 θ
1
1
z f j f j
f f n n
= −
−
( )
(
+)
1 0
1 1 1 1 0
ˆ ˆ / /
ˆ
f = f j n1 1n ++f j nn0 0
1 0
pr pr pr
m
1 ≤ 2 ≤ ≤...
i i pri
i m
Cytogenetic features on amplicon boundaries were char-acterized to elucidate the genomic features that predis-pose to DNA double-strand breaks and enable amplification. Mechanistic models of amplification pre-dict that DNA double-strand breaks must occur at the ends of the amplified chromosomal element. Enrichment of specific chromosomal regions in the ends of the ampli-fication patterns (putative amplicons) was tested. The tested chromosomal regions included fragile sites, telom-eres, centromtelom-eres, light and dark G-bands, and variable regions. Fragile sites were mapped according to the National Center for Biotechnology Information database annotations. Chromosome bands mapping to telomeric, centromeric and variable regions, as well as dark and light bands were extracted from the International System for Human Cytogenetic Nomenclature (2005) annotations [26]. We were interested in knowing whether the ends of amplification patterns were involved in an unexpectedly large number of specific chromosomal features, which would provide a possible explanation for DNA breakage associated with amplification. The test statistics were the differences between frequencies of chromosomal features in different sites of a given amplification pattern (borders, inside, and in general). If many patterns are based on one component distribution of the Bernoulli mixture model, they are very likely to overlap. In cases like this, the hypothesis testing includes the band in both sets with equal importance. We executed a permutation test of 10000 iterations to the hypothesis of comparing the pro-portions of chromosomal features. When executing the permutation test, an equal number of random bands to the number of bands of the chromosomal feature that was tested were distributed along the amplification patterns. Then, the corresponding proportions of the randomized sites occurring in the border and inside bands were calcu-lated. This can be seen as a means to obtain empirical samples of the test statistic under the null hypothesis. The difference in proportions of the true test statistic and the randomized reference could then be calculated. The p -value for the one-tailed test was calculated using the dif-ference in the proportions of the test statistic and rand-omized reference values. The threshold for significant findings was p < 0.05.
Results
Probabilistic models of DNA copy number amplification
We identified 111 amplification models (Figure 1). The number of clusters in chromosomes 1–22 and X varied between 2 and 7: chr1 (6), chr2 (4), chr3 (7), chr4 (2), chr5 (5), chr6 (6), chr7 (6), chr8 (7), chr9 (4), chr10 (3), chr11 (7), chr12 (6), chr13 (6), chr14 (3), chr15 (2), chr16 (4), chr17 (7), chr18 (4), chr19 (4), chr20 (6), chr21 (4), chr22 (3), and chrX (5). The Y chromosome was omitted from the analysis due to the low number of cases. Figure 1 shows the number of cancer cases (Nc)
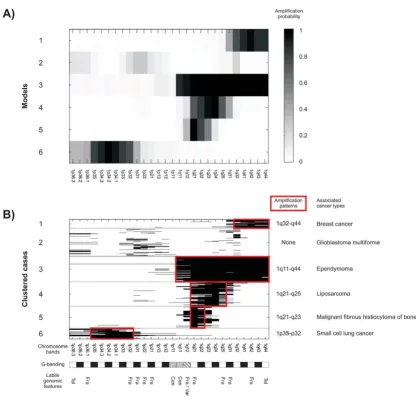
included in each amplification model. Vectors of proba-bility parameters θj represent the resulting amplification models, where each mixture component assigns a contin-uous probability value θji to each chromosome band. One chromosome band may have non-zero probabilities in different components, since components may correspond to different amplicon structures. Figure 2 shows that the clustering based on the probabilistic model of DNA copy number amplification manages to predetermine the struc-ture of amplifications. It represents a typical amplification pattern and the general properties observed in an amplifi-cation, which may encompass additional bystander areas around the target gene locus.
DNA copy number amplification model-based clustering of cancer cases
The identified DNA copy number amplification models can be used to divide cases into clusters with similar molecular aberration. Figure 2 shows the data from chro-mosome 1 for reference. The clusters based on DNA copy number amplification models can be fused with known background data of the cancer types to study the underly-ing specificity of the amplifications.
Classification data of 95 human neoplasms were collected from the literature [see Additional file 1]. The analysis was restricted to malignant cancers of 82 different cancer types. Figure 3 presents the classification distribution based on cell lineages, age, and gender. Classification based on cell lineage contained anatomical system, organ, tissue, differentiation, and embryonic lineages. These attributes were divided into classification terms, e.g., nerv-ous system (anatomical system), brain (organ), and gli-oma (cell). The classification terms can partially overlap with different attributes. Differentiation lineage (e.g., ade-nocarcinoma) refers to the histological type of the malig-nancy. Embryonic lineage divides cases into four main developmental compartments: epithelial, mesenchymal, hematopoietic, and neuroepithelial. The clinical attributes were age (pediatric, young adults, and adults) and gender specifications. In addition, 19 different etio-logical factors were collected (Figure 4). In all, 29 attributes and 100 classification terms were accumulated. Classification terms were appointed for cancers as primary data of individual cases was not available in the amplifi-cation data compilation. The compilation of DNA copy number amplification data was revised regarding the new annotations [12].
Probabilistic models of DNA copy number amplification
Figure 1
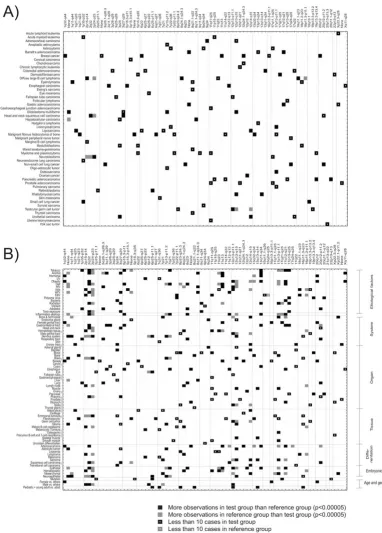
0.00005 and p-values were corrected for multiple testing using the Benjamini-Hochberg false discovery rate method [23]. Statistically significant observations are pre-sented in Figure 5. Individual cancers (Figure 5A) and
sample groups with specific classification terms (Figure 5B) were tested against all other samples. Our results show that a subset of amplifications is associated with specific cancer type, whereas some amplifications are
Amplification models and clustered data from chromosome 1
Figure 2
Distribution of cancer classification attributes and classification terms
Figure 3
Etiological factors of cancers
Figure 4
Associations between DNA copy number amplification models and classification terms
Figure 5
more commonly shared by cancers of similar etiology or cell-lineage. For example, 1q33-q44 amplification is spe-cific to breast cancers and 17q12-q21 region is spespe-cifically amplified in gastric cancer and Barrett's adenocarcinoma (Figure 5A). Similarly, 1q32-q44 amplification is specifi-cally present in cancers associated with hormonal imbal-ance, obesity, female genital tract, breast tissue, and adenocarcinoma as well as cancers with female overrepre-sentation (Figure 5B). On the other hand, 17q12-q21 amplicon is enriched in cancers that associate with tobacco, obesity, diet, bacterial infections, inflammation, gastrointestinal tract, esophagus, stomach, adenocarci-noma, epithelial origin, and ethnic prevalence (Figure 5B).
Pattern description for probabilistic models of DNA copy number amplification
In order to facilitate the interpretation, we generated com-pact and understandable descriptions of the amplification models. The descriptions, i.e., amplification patterns, are local, finite, and plausible representations of the chromo-somal areas of amplification. The amplification patterns were identified as maximal frequent itemsets and the chromosome bands are expressed following the original cytogenetic nomenclature. Amplification patterns depict the structures of the amplicons. One amplification model may result in many patterns. In fact, we extracted 140 maximal frequent itemsets from the 111 amplification models. When multiple patterns were identified for a spe-cific amplification model, the most frequent pattern was chosen. Amplification patters are reported alongside their representative models in Figure 1. Amplification patterns in chromosome 1 are marked in Figure 2.
Mechanisms of DNA copy number amplification
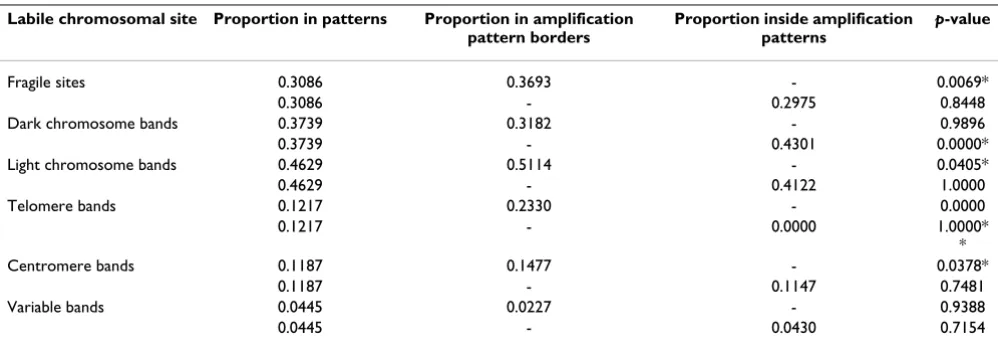
Amplification patterns were used to investigate the mech-anisms of DNA copy number amplification. Our hypoth-esis was that patterns represent the general structures of amplicons and can thus be applied to map amplicon boundaries and genomic loci that are susceptible to DNA double-strand damage. Differences in the proportions of labile chromosomal features in amplification patterns and within border bands or inside amplification patterns were determined using a hypothesis test (Table 1). Note-worthy is that the same band can occur both inside and on the border of the patterns, which can overlap. This is exemplified in Figure 2, where the ends of one pattern are inside another pattern. To be precise, the telomeric ends of the amplification patterns for models four and five (1q23 and 1q25, respectively) are inside the amplification pattern of model three (1q11-1q44). Statistically signifi-cant differences in proportions (p-value < 0.05) were iden-tified when the proportions of fragile sites within the borders of amplification patterns were compared with the proportions of fragile sites in the amplification patterns. Similarly, light chromosome bands, telomeres, and cen-tromeres were more frequent in the border bands than in the patterns in general. Dark chromosome bands inside the amplification patterns were more frequent than those in patterns as a whole.
Discussion
A machine learning approach was utilized to model DNA copy number amplifications in a landscape of cancers. The current modeling approach disregarded the cancer type information and modeled amplifications based on case-specific data vectors. This resulted in identification of 111 amplification models (Figure 1). The identified
mod-Table 1: Hypothesis testing of proportions of labile chromosomal sites within the amplification patterns.
Labile chromosomal site Proportion in patterns Proportion in amplification pattern borders
Proportion inside amplification patterns
p-value
Fragile sites 0.3086 0.3693 - 0.0069*
0.3086 - 0.2975 0.8448
Dark chromosome bands 0.3739 0.3182 - 0.9896
0.3739 - 0.4301 0.0000*
Light chromosome bands 0.4629 0.5114 - 0.0405*
0.4629 - 0.4122 1.0000
Telomere bands 0.1217 0.2330 - 0.0000
0.1217 - 0.0000 1.0000*
*
Centromere bands 0.1187 0.1477 - 0.0378*
0.1187 - 0.1147 0.7481
Variable bands 0.0445 0.0227 - 0.9388
0.0445 - 0.0430 0.7154
The proportion of chromosomal attributes in patterns in general is compared to the proportion of chromosomal attributes on the borders of the amplification patterns as well as inside amplification patterns (excluding the borders). Statistical significance of the difference in proportions was determined using permutation tests and p-values are marked in the table. Significant findings are marked with an asterisk.
*Statistically significant findings (p < 0.05).
els could be viewed as specific cancer classes that allow more refined dissection of amplification processes. Our hypothesis was that cancers with a common amplification model might exhibit dependency on a specific oncogene amplification and therefore share common biological background. We tested this hypothesis by analyzing the distribution of WHO classification terms in the amplifica-tion modeling-based clustering of cancer cases. Specific amplification models were shown to associate with spe-cific cancer types and classification terms (Figure 5). The non-random structure in the spectrum of DNA copy number amplifications in cancer suggests that cancer eti-ology and tumor microenvironment could manifest as specific amplification signatures. According to our results, amplifications are selected according to the anatomical locations and biological background of the cancers. Theo-retically, carcinogenesis could be viewed as an evolution-ary process that involves the selection of cancer cells in the somatic tissue by specific mutations. In the Darwinian perspective, the classification based on DNA copy number amplifications reflects the differences in the selective properties in different anatomical locations and in spe-cific adaptation of cancers with similar biological back-grounds.
DNA copies generated in amplification manifest as con-catenated homogenously staining regions and extra-chro-mosomal acentric DNA fragments, double minutes and episomes [3,27]. Models of DNA amplification mecha-nisms, the breakage-fusion-bridge cycle and excision of extrachromosomal DNA segments, state that two inde-pendent DNA double-strand breaks that flank the ampli-fied region are required to initiate the amplification pathway [28]. Using the amplification modeling and pat-tern discovery approach, presented in the current study, fixing of finite amplicon structures became feasible and amplification patterns, representations of amplicon struc-tures, were determined from the DNA copy number amplification models. The amplification patterns could then be used to identify specific chromosomal sites that associate with amplicon boundaries. By fusing the bound-aries of amplification patterns with cytogenetic annota-tions of the genome it was possible to elucidate the features in the chromosomal structure and genomic archi-tecture that predispose the genome to amplifications. The hypothesis was that specific genomic regions may be dam-age-prone and susceptible to DNA double-strand breaks. The statistical hypothesis testing demonstrated that fragile sites, light chromosome bands, telomeres, and centro-meres were enriched in the ends of the amplicons (Table 1). This suggests that these sites might be associated with the amplification mechanisms and DNA double-strand breakage at amplicon boundaries. Fragile sites are dam-age-prone genomic regions when cells are treated with chemicals that interfere with replication [29], which
makes it likely that they are often found at amplification breakpoints. In addition to fragile sites, chromosome ends are unstable and may produce double-strand DNA breaks due to telomere shortening during replication and cell division [30]. Similarly, centromere regions have been shown to be unstable and damage-prone upon replication stress [31], which might explain the accumulation of amplicon boundaries on them. Light chromosome bands were also enriched at amplicon boundaries. The light bands contain euchromatin and are gene-rich, G/C-rich and late-replicating, whereas dark bands correspond to gene-poor, A/T-rich and early replicating heterochroma-tin. Due to its high gene content, the structure of euchro-matin is more open than that of heterochroeuchro-matin [32], which may affect its physical protection and render euchromatin more susceptible to DNA damage than the gene-poor heterochromatin. We hypothesize that open chromatin reduces the protection of chromosomal DNA and serves as preferential target for DNA damage. Open chromatin might therefore expose light chromosome bands to DNA double-strand breaks that initiate the amplification pathways.
Conclusion
We classified human cancers based on DNA copy number amplification models. Cancer cases were fused with the WHO classification annotations. The inherent structure in the probabilistic clustering suggests that amplifications are non-randomly selected according to biological back-grounds of cancers. Amplification patterns were extracted and probed using cytogenetic annotations. We show sta-tistical evidence that connects fragile sites, telomeres, cen-tromeres, and light chromosome bands to the amplification mechanism. These results suggest that labile chromosomal features are involved in the amplification process by promoting the formation of DNA double-strand breaks at amplicon margins.
Abbreviations
CGH: comparative genomic hybridization; WHO: World Health Organization; EM: Expectation-Maximization.
Competing interests
The authors declare that they have no competing interests.
Authors' contributions
Additional material
Acknowledgements
The authors of this article would like to thank Dr. Outi Monni (Institute of Biomedicine/Biochemistry, Genome-Scale Biology Research Program and Biomedicum Biochip Center, University of Helsinki) and Dr. Kai Puolamäki (Department of Information and Computer Science, Helsinki University of Technology) for critical comments on the manuscript. This work was sup-ported by the Academy of Finland in the SYSBIO (Systems Biology and Bio-informatics) Research Program, the State Appropriations of Helsinki University Central Hospital, the Sigrid Jusélius Foundation, and the Finnish Cancer Organizations.
References
1. Myllykangas S, Himberg J, Böhling T, Nagy B, Hollmén J, Knuutila S:
DNA copy number amplification profiling of human neo-plasms. Oncogene 2006, 25(55):7324-7332.
2. Mitelman F, Johansson B, Mertens F: Catalog of Chromosome
Aberrations in Cancer. Volume 2. New York , Wiley-Liss; 1994.
3. Albertson DG, Collins C, McCormick F, Gray JW: Chromosome
aberrations in solid tumors. Nat Genet 2003, 34(4):369-376.
4. Lengauer C, Kinzler KW, Vogelstein B: Genetic instabilities in
human cancers. Nature 1998, 396(6712):643-649.
5. Brodeur GM, Hogarty MD: Gene amplification in human
can-cers: biological and clinical significance. In The genetic basis of human cancer Edited by: Vogelstein B, Kinzler KW. New York , McGraw-Hill; 1998:161-172.
6. Schwab M, Westermann F, Hero B, Berthold F: Neuroblastoma: biology and molecular and chromosomal pathology. Lancet Oncol 2003, 4(8):472-480.
7. Vogt N, Lefevre SH, Apiou F, Dutrillaux AM, Cor A, Leuraud P, Pou-pon MF, Dutrillaux B, Debatisse M, Malfoy B: Molecular structure of double-minute chromosomes bearing amplified copies of the epidermal growth factor receptor gene in gliomas. Proc Natl Acad Sci U S A 2004, 101(31):11368-11373.
8. Myllykangas S, Böhling T, Knuutila S: Specificity, selection and sig-nificance of gene amplifications in cancer. Semin Cancer Biol
2007, 17(1):42-55.
9. Kleihues P, Sobin LH: World Health Organization Classification
of Tumours. In World Health Organization Classification of Tumours
Lyon , IARCPress. 2000 - 2006
10. Kallioniemi A, Kallioniemi OP, Sudar D, Rutovitz D, Gray JW,
Wald-man F, Pinkel D: Comparative genomic hybridization for
molecular cytogenetic analysis of solid tumors. Science 1992,
258(5083):818-821.
11. Baudis M, Cleary ML: Progenetix.net: an online repository for
molecular cytogenetic aberration data. Bioinformatics 2001,
17(12):1228-1229.
12. Laboratory of Cytomolecular Genetics (CMG) [http:// www.helsinki.fi/cmg/cgh_data.html]
13. MacLachlan GJ, Peel D: Finite Mixture Models (Wiley Series in
Probability and Statistics). New York , John Wiley & Sons; 2000.
14. Everitt BS, Hand DJ: Finite Mixture Distributions (Monographs
on Applied Probability and Statistics). Boca Raton , Chapman & Hall; 1981.
15. Gyllenberg M, Koski T, Reilink E, Verlaan M: Non-uniqueness in
probabilistic numerical identification of bacteria. Journal of Applied Probability 1994, 31:542-548.
16. Carreira-Perpinan MA, Renals S: Practical identifiability of finite mixtures of multivariate Bernoulli distributions. Neural Com-putation 2000, 12:141-152.
17. Dempster AP, Laird NM, Rubin DB: Maximum likelihood from
incomplete data via the EM algorithm. Journal of the Royal Sta-tistical Society, Series B 1977, 39:1-39.
18. Redner RA, Walker HF: Mixture densities, maximum likelihood
and the EM algorith. SIAM Review 1984, 26(2):195-234.
19. MacLachlan GJ, Thiriyambakam K: The EM Algorithm and
Exten-sions (Wiley Series in Probability and Statistics). New York , John Wiley & Sons; 1996.
20. Tikka J, Hollmén J, Myllykangas S: Mixture modeling of DNA copy
number amplification patterns in cancer. In Proceedings of the 9th International Work-Conference on Artificial Neural Networks (IWANN'2007): June 2007; San Sebastián Edited by: Sandoval F, Prieto A, Cabestany J, Graña M. Heidelberg , Springer-Verlag; 2007:972-979.
21. Efron B, Tibshirani RJ: An Introduction to the Bootstrap
(Mon-ographs on Statistics and Applied Probability). Boca Raton , Chapman & Hall; 1993.
22. Milton JS, Arnold JC: Introduction to Probability and Statistics: Principles and Applications for Engineering and the Com-puting Sciences. 2nd edition. New York , McGraw-Hill; 1990.
23. Benjamini Y, Hochberg Y: Controlling the False Discovery Rate:
a Practical and Powerful Approach to Multiple Testing. Jour-nal of Royal Statistical Society 1995, 57(1):289-300.
24. Hollmén J, Tikka J: Compact and Understandable Descriptions
of Mixtures of Bernoulli Distributions. In Proceedings of the 7th International Symposium on Intelligent Data Analysis (IDA 2007): Septem-ber 2007; Ljubljana Edited by: Berthold MR, Shawe-Taylor J, Lavrac N. Heidelberg , Springer-Verlag; 2007:1-12.
25. Burdick D, Calimlim M, Flannick J, Gehrke J, Yiu T: MAFIA: A Max-imal Frequent Itemset Algorithm. IEEE Transactions on Knowl-edge and Data Engineering 2005, 17(11):1490-1504.
26. Shaffer LG, Tommerup N: ISCN (2005): An International
Sys-tem for Human Cytogenetic Nomenclature. Basel , S. Karger; 2005.
27. Schwab M: Amplification of oncogenes in human cancer cells.
Bioessays 1998, 20(6):473-479.
28. Myllykangas S, Knuutila S: Manifestation, mechanisms and
mys-teries of gene amplifications. Cancer Lett 2006, 232(1):79-89.
29. Schwartz M, Zlotorynski E, Kerem B: The molecular basis of
com-mon and rare fragile sites. Cancer Lett 2006, 232(1):13-26.
30. Murnane JP, Sabatier L: Chromosome rearrangements
result-ing from telomere dysfunction and their role in cancer. Bioes-says 2004, 26(11):1164-1174.
31. Hellman A, Zlotorynski E, Scherer SW, Cheung J, Vincent JB, Smith
DI, Trakhtenbrot L, Kerem B: A role for common fragile site
induction in amplification of human oncogenes. Cancer Cell
2002, 1(1):89-97.
32. Gilbert N, Boyle S, Fiegler H, Woodfine K, Carter NP, Bickmore WA:
Chromatin architecture of the human genome: gene-rich domains are enriched in open chromatin fibers. Cell 2004,
118(5):555-566.
Pre-publication history
The pre-publication history for this paper can be accessed here:
http://www.biomedcentral.com/1755-8794/1/15/prepub
Additional file 1
Classification annotations for cancer types. Supplement
1_Classification data.txt is a tab-delimited text-file containing all col-lected cancer classification data.
Click here for file