Performance evaluation and calibration of capacitance sensor for
estimating the salinity of reclaimed land
Donggeun Kim
1,
Younghwan Son
2*,
Jaesung Park
3,
Taejin Kim
1,
Jihun Jeon
1(1. Department of Rural Systems Engineering, Seoul National University, Seoul 08826, Republic of Korea; 2. Department of Rural Systems Engineering, and Research Institute for Agriculture and Life Sciences,
Seoul National University, Seoul 08826, Republic of Korea;
3. Department of Bioresource Engineering, McGill University, Ste-Anne-de-Bellevue QC H9X 3V9, Canada)
Abstract: Generally, soil moisture and salinity in reclaimed land are monitored using soil dielectric sensors such as time domain reflectometry, frequency domain reflectometry, and capacitance. The soil dielectric sensor measures apparent dielectric permittivity. However, apparent dielectric permittivity is affected by soil moisture, salinity, and texture. In this study, performance evaluation and calibration of a dielectric sensor (5TE; METER Group, Inc., Pullman, WA, USA) for monitoring soil salinity were performed. Laboratory calibration tests were completed, incorporating various levels of dry density, water content, and salinity. The soil salinity was determined by the electrical conductivity (EC)1:5 method. The volumetric water content as measured by the sensor was affected by dry density and water content. Generally, it linearly increased as dry density and water content increased. However, when dry density or water content was high, the measured value of the sensor increased nonlinearly. The bulk EC measured by sensor had no specific correlation with EC1:5. The EC1:5 measurement had a linear relationship with the gradient of θ and θs. Therefore, it can be estimated with a simple linear equation using θ from the soil test and θs from the capacitance sensor. The R2 value of the EC
1:5 estimation equation was 0.98. The proposed equation requires θ from the gravimetric sample and θs from the sensor. Therefore, in the case of monitoring salinity using a sensor, it is recommended to measure the water content with a tensiometer.
Keywords: salinity, capacitance sensor, volumetric water content, reclaimed land soil, saline soil
DOI: 10.25165/j.ijabe.20201301.3905
Citation: Kim D, Son Y, Park J, Kim T, Jeon J. Performance evaluation and calibration of capacitance sensor for estimating the salinity of reclaimed land. Int J Agric & Biol Eng, 2020; 13(1): 206–210.
1 Introduction
Since reclaimed land soil has high initial soil salinity, it must be desalinated prior to farming. High soil salinity adversely affects plant growth and causes leaf damage[1]. For the effective control of soil salinity, measuring and monitoring the soil solution electrical conductivity (EC) is essential[2]. Furthermore, monitoring soil moisture is also important in determining the appropriate irrigation amount and schedule[3,4].
In general, the monitoring of soil moisture and salinity is performed by using dielectric sensor methods such as time domain reflectometry (TDR), frequency domain reflectometry (FDR), and capacitance. TDR sensors are known to measure soil moisture most accurately but are also more expensive than FDR sensors[5,6]. FDR is similar to TDR, but FDR is based on the fluctuation of signal frequency due to the soil dielectric properties[7]. FDR and
Received date: 2017-10-13 Accepted date: 2019-12-05
Biographies: Donggeun Kim, PhD Candidate, research interests: agricultural engineering, UAVs, soil sensing, image processing, Email: [email protected];
Jaesung Park, PhD, Postdoctoral Fellow, research interests: agricultural engineering, UAVs, computer vision, soil sensing, image processing, Email: [email protected]; Taejin Kim, Graduate student, research interests: agricultural engineering, soil improvement, Email: [email protected];
Jihun Jeon, Graduate student, research interests: agricultural engineering, recycling material, soil sensing, Email: [email protected].
*Corresponding author: Younghwan Son, PhD, Professor, research interest: agricultural engineering, recycling material, Department of Rural Systems Engineering, and Research Institute for Agriculture and Life Sciences, Seoul National University, Seoul 08826, Republic of Korea. Email: [email protected].
capacitance sensors are widely used because they are practical and inexpensive[8,9]. However, FDR and capacitance sensors require site-specific calibration, especially for jobs involving heavy and saline soils[2].
Dielectric sensors such as the TDT (Acclima, Meridian, ID, USA), 5TE/10HS (METER Group, Inc., Pullman, WA, USA), and CS616/625 (Campbell Scientific, Logan, UT, USA) measure the apparent dielectric permittivity (εa) and convert it to soil moisture. Topp et al.[10] identified the relationship between apparent permittivity and volumetric water content and proposed the Topp equation. However, the apparent dielectric permittivity measured by dielectric sensors is influenced not only by the soil water content but also by salinity and soil texture[11]. The effects of salinity and soil texture are greater for FDR sensors than for TDR sensors. Therefore, dielectric sensors should be calibrated and validated to minimize the effects of salinity and soil texture on measurements.
Generally, quantitative soil salinity is measured by saturation extract EC (ECse) or the EC1:5 test method[12]. Generally, the ECse method is time-consuming and requires more skills to use during testing[13]. In comparison, the EC
1:5 method is easy to prepare and requires less time and money[14]. EC
1:5 is commonly used to determine soil salinity in Australia and Central Asia[15,16].
Bulk EC (ECbulk) is the EC of bulk soil as measured by the sensor. ECbulk is affected by volumetric water content and the permittivity of the pore water[17]. Unlike EC
and verification to estimate soil salinity using dielectric sensors. In this study, the calibration and verification of dielectric sensors were performed considering factors that may affect sensor accuracy. In particular, an appropriate method for quantitative evaluation of soil salinity using dielectric sensors was proposed.
2 Materials and methods
In this study, the calibration of sensors was performed with the soil of Saemangeum (SM) and Hwaong (HW) reclaimed land in Korea. Five soil samples were collected from each region to determine the natural water content, dry density, and salinity of the soil. As a result of the field survey, the natural water content was determined to be 15% to 22% and the dry density was identified as 1.1 t/m3 to 1.4 t/m3. Many halophytes are distributed in the surface layer of such soil, and salt crystals are often accumulated due to resalinization. The initial EC1:5 was from 20 dS/m to 22 dS/m. The particle size distribution of the soil is shown in Figure 1. The sampling locations and physical properties are shown in Table 1. According to the United States Department of Agriculture soil classification method, SM is classified as sandy loam and HW is classified as silt loam.
Figure 1 Particle size distribution of soils
Table 1 Sampling locations and physical properties of soils
Soil Lat. (N) Long. (E) Cu Cg
Texture Sand
/% Slit /% Clay /% Class SM 35°45′14.5″ 126°36′43.5″ 3.65 1.18 44.52 49.01 6.47 Sandy loam HW 37°05′38.1″ 126°45′53.2″ 9.84 1.37 43.43 51.65 4.92 Slit loam Note: SM: Sandy loam; HW: Silt loam; Lat.: Latitude; Long.: Longitude.
2.1 Sensor
Laboratory calibration tests were performed by using the 5TE sensor (METER Group, Inc., Pullman, WA, USA; Figure 2). The 5TE sensor is one of the most widely used sensors of the capacitance type[18]. Many researchers calibrate capacitance sensors such as 5TE, 10HS, and ECH20-TE (all METER Group, Inc., Pullman, WA, USA) to measure water content and salinity of the soil[4,19,20,21,22]. 5TE measures soil volumetric water content (θs), electrical conductivity (ECbulk), and temperature.
Figure 2 5TE sensor (METER Group, Inc., Pullman, WA, USA) 5TE uses an oscillator that oscillates at 70 MHz to measure the
εa of the soil. The εa is 1 in air and 80 in water and can be converted to volumetric water content by using the Topp equation[10].
The specifications of the 5TE are shown in Table 2. When the saturation extract EC is less than 10 dS/m in general mineral soil, the volumetric water content as calculated by the Topp equation is generally within about 3% of the actual experimental results[18].
There are screws on the surface of two of the three grounding terminals. The electrical resistance between these two screws was used to measure the ECbulk. The temperature sensor is located at the top of the ground terminal.
Table 2 Specifications of the 5TE sensor[18]
Items Specifications
Volumetric Water Contents
Range Apparent dielectric permittivity (εa): 1 (air) to 80 (water)
Resolution εa from 1 to 20 was 0.1; εa from 20 to 80 was <0.75 VWC from 0% to 50% VWC was 0.08% Accuracy εa from 1 to 40 was ±1; εa from 40 to 80 (VWC)
was ±15%
Bulk EC
Range 0 to 23 dS/m (bulk)
Resolution 0.01 dS/m from 0 dS/m to 7 dS/m; 0.05 dS/m from 7 dS/m to 23 dS/m Accuracy ± 10% from 0 dS/m to 7 dS/m User calibration required above 7 dS/m
Temperature
Range −40°C to 60°C Resolution 0.1°C
Accuracy ±1°C
2.2 Experimental procedure for sensor calibration
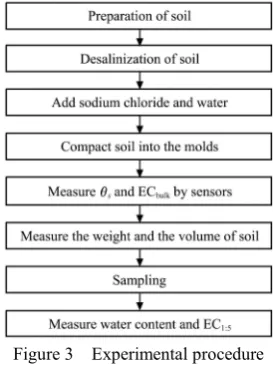
The experimental procedure for sensor calibration is shown in Figure 3. Laboratory calibration test procedures of 5TE sensors were repeated with various levels of salt concentration, water content (ω), and dry density (γd). The properties of soils in the laboratory calibration test are summarized in Table 3. The temperature of soil was maintained at a uniform level (27°C ± 1°C) during the laboratory experiment.
Figure 3 Experimental procedure
Table 3 Properties of soils in the laboratory calibration test
Soil EC1:5/dS·m-1 Water content/% Dry density/t·m-3 SM 2.1-34.2 (5 levels) 5-35
(Dried - Liquid limit) 0.8-1.4 HW 2.0-30.9 (5 levels)
Note: EC: Electrical conductivity; SM: Sandy loam; HW: Silt loam
conductivity meter (CyberScan PC300).
The water content was controlled by gradually adding water to about 3% of soil weight from the air-dry state to the liquid limit level. The soil was then compacted into an acrylic mold (Figure 4a). The wet density (γt) was calculated by measuring the weight and volume of soil in the mold. θs and ECbulk were measured by inserting the sensor into the soil surface layer. After sensor measurement, soil samples were taken from the sensor location to measure gravimetric water content (ω). The dry density (γd) and volumetric water content (θ) were calculated via the following formulas using ω and γt:
1 t d
(1) d
(2)
a. Acrylic mold b. Test procedure Figure 4 Testing mold and test procedure
3 Results and discussion
3.1 Sensor sensitivity to soil dry density and water content
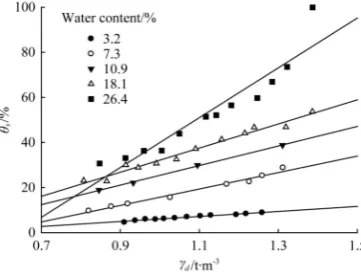
The volumetric water content of the soil (θ) can be obtained by multiplying the dry density (γd) by the water content (ω). Therefore, if the water content is constant, increasing the dry density increases the volumetric water content linearly. In order to verify the sensor, the volumetric water content (θs) was measured by a sensor, with a protocol of gradually increasing the dry density at each water content level. The initial soil salinity was 20 dS/m. As shown in Figure 5, the volumetric water content measured by the sensor increased linearly with increasing dry density. As the water content increased, the volumetric water content increased nonlinearly as the dry density increased. The solid lines are the linear regression line at each water content.
Figure 5 The relationship between γd and θs
If no impact or external force is applied to the soil, the variation of the dry density is small. Therefore, changes in dry density are not significant when monitoring the soil using sensors. Thus, the main factor affecting the volumetric water content of the soil is the gravimetric water content.
Figure 6 shows the relationship between the gravimetric water content (ω) and the volumetric water content (θs) by classifying the
data shown in Figure 5 into similar ranges of dry density. As the gravimetric water content increases, the volumetric water content linearly increases but shows a tendency to nonlinearly increase when the dry density increases to 1.3 or more.
Figure 6 Relationship between ω and θs. The solid lines are the linear regression line at each dry density level
As described above, the dry density does not change significantly with time. Therefore, when the salinity of the soil is constant, the water content at the sensor site can be estimated by using the linear relationship between the volumetric water content and the water content.
3.2 Sensor sensitivity to soil salinity
Figure 7 shows the relationship between the ECbulk measured by the sensor (5TE) and the EC1:5 measured by the conductivity meter. Since there is no specific correlation between ECbulk and EC1:5, it is impossible to predict the soil salinity via ECbulk.
Figure 7 Relationship between ECbulk and EC1:5
The ECbulk increased as θs increased (Figure 8). These results are similar to those of previous research[23]. Varble and Chavez[23] mentioned that the ECbulk depends both on the soil salinity and θ. However, the increase curves of ECbulk according to θs are almost similar, even when the EC1:5 is different. This finding means that it is impossible to estimate the EC1:5 by the measured values of the sensor (θs and ECbulk).
3.3 Estimation of soil salinity by the capacitance sensor
Figure 9 shows the relationship between the θs and θ measured at various soil salinity conditions. θs increased linearly as θ
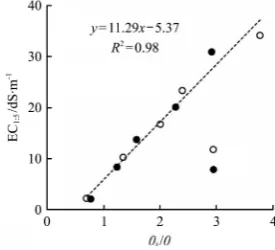
increased when EC1:5 was constant. If θs is unrelated to EC1:5, then the data in Figure 10 must be on a 1:1 line (dotted line). However, the gradient of θ and θs instead increased with increasing EC1:5. When EC1:5 is less than about 6 dS/m, the θs values are smaller than the θ, while, in the case of EC1:5>6 dS/m, they are greater than θ. Since the EC1:5 affects θs, it must be considered when measuring θs using sensors.
EC1:5=a x (θs/θ)+b (3) where, θ is the volumetric water content determined by soil test, %;
θs is the volumetric water content determined by sensor, %; a is 11.29 (the slope of the linear regression line); b is −5.37 (the intercept of the linear regression line).
a. SM
b. HW
Figure 8 Relationship between θs and ECbulk
a. SM
b. HW
Figure 9 Relationship between θs and θ. The solid lines are the linear regression line at each EC1:5
Figure 10 Estimation of EC1:5 by the gradient of θ and θs The coefficient “a” is the slope of the linear regression line of
θs/θ and EC1:5. In a constant EC1:5 condition, εa increases as clay content increases. Therefore, as the clay content increases, θs/θ
increases and “a” decreases accordingly. The coefficient “b” is the intercept of the linear regression line of θs/θ and EC1:5. “b” can be reduced to “−a,” in which case θs is completely not influenced by EC1:5. However, this case is considered to be extremely rare in reclaimed soil and, in general, it will show a value of “−a” or more.
The soils used in this study are slit loam and sandy loam with low clay content. The capacitance sensor is known to increase εa when using heavy soil with high clay content, so, in this case, “a” would decrease and “b” would increase.
However, the principle of measurement of the capacitance sensor does not depend on soil texture. Therefore, in the case of using the capacitance sensor, the estimation equation will appear as the same linear type regression equation as above.
In reclaimed land, the water content, salt salinity, and temperature inside the ground change continuously due to desalinization by rainfall and resalinization due to capillary rise. The proposed equation requires a volumetric water content measured by a sensor and a gravimetric sample. However, it is impossible to continually carry out soil sampling of sensor points for measuring the volumetric water content. Therefore, in order to monitor the salinity using a sensor, it is assumed that the dry density is constant, and it is recommended to measure the change of the water content with measuring devices not affected by soil salinity such as a tensiometer. The use of a tensiometer is a nondestructive and cost-effective method for the continuous measuring of soil water content[8].
According to Varble et al.[23], the 5TE sensor exhibits a diurnal fluctuation of the measured value with temperature. When the temperature changes by 10°C, θs is affected by up to 4% for the temperature range of 10°C to 40°C [22]. The proposed equation is the result of experiments at a uniform temperature. Therefore, when using sensors for long-term monitoring of salinity, this temperature variation should be considered.
4 Conclusions
soil sampling. However, it is impossible to continually carry out soil sampling of sensor points for measuring the volumetric water content. Therefore, in order to monitor the salinity using a sensor, it is assumed that the dry density is constant, and it is recommended to measure the change of the water content with a device such as a tensiometer. Also, in this case, it should be noted that the measured value of the sensor changes daily depending on temperature fluctuations.
Acknowledgements
This research was supported by the Basic Science Research Program through the National Research Foundation of Korea (NRF) funded by the Ministry of Science, ICT & Future Planning (NRF-2014R1A2A1A11051680); the Korea Institute of Planning and Evaluation for Technology in Food, Agriculture, Forestry & Fisheries; and the Ministry of Agriculture, Food and Rural Affairs (114147-3).
[References]
[1] Morales M A, Olmos E, Torrecillas A, Sánchez-Blanco M J, Alarcon J J. Differences in water relations, leaf ion accumulation and excretion rates between cultivated and wild species of Limonium sp. grown in conditions of saline stress. Flora, 2001; 196(5): 345–352.
[2] Valdés R, Ochoa J, Franco J A, Sánchez-Blanco M J, Bañón S. Saline irrigation scheduling for potted geranium based on soil electrical conductivity and moisture sensors. Agricultural Water Management, 2015; 149: 123–130.
[3] Morgan K T, Parsons L R, Wheaton T A. Comparison of laboratory-and field-derived soil water retention curves for a fine sand soil using tensiometric, resistance and capacitance methods. Plant and Soil, 2001; 234(2): 153–157.
[4] Visconti F, de Paz J M, Martínez D, Molina M J. Laboratory and field assessment of the capacitance sensors Decagon 10HS and 5TE for estimating the water content of irrigated soils. Agricultural Water Management, 2014; 132: 111–119.
[5] Robinson D A, Campbell C S, Hopmans J W, Hornbuckle B K, Jones S B, Knight R, et al. Soil moisture measurement for ecological and hydrological watershed-scale observatories: A review. Vadose Zone Journal, 2008; 7(1): 358–389.
[6] Skierucha W, Wilczek A. A FDR sensor for measuring complex soil dielectric permittivity in the 10–500 MHz frequency range. Sensors, 2010; 10(4): 3314–3329.
[7] Robock A, Vinnikov K Y, Srinivasan G, Entin J K, Hollinger S E, Speranskaya N A, et al. The global soil moisture data bank. Bulletin of
the American Meteorological Society, 2000; 81(6): 1281–1299.
[8] Dobriyal P, Qureshi A, Badola R, Hussain S A. A review of the methods available for estimating soil moisture and its implications for water resource management. Journal of Hydrology, 2012; 458–459: 110–117. [9] Topp G C. State of the art of measuring soil water content.
Hydrological Processes, 2003; 17(14): 2993–2996.
[10] Topp G C, Davis J L, Annan A P. Electromagnetic determination of soil water content: Measurements in coaxial transmission lines. Water Resources Research, 1980; 16(3): 574–582.
[11] Topp G C, Zegelin S, White I. Impacts of the real and imaginary components of relative permittivity on time domain reflectometry measurements in soils. Soil Science Society of America Journal, 2000; 64(4): 1244–1252.
[12] He Y B, DeSutter T, Hopkins D, Jia X H, Wysocki D A. Predicting ECe of the saturated paste extract from value of EC1: 5. Canadian Journal of Soil Science, 2013; 93(5): 585–594.
[13] Longenecker D E, Lyerly P J. Making soil pastes for salinity analysis: A reproducible capillary procedure. Soil Science, 1964; 97(4): 268–275. [14] Khorsandi F, Yazdi F A. Gypsum and texture effects on the estimation of
saturated paste electrical conductivity by two extraction methods. Communications in Soil Science and Plant Analysis, 2007; 38(7-8): 1105–1117.
[15] Rayment G, Higginson F R. Australian laboratory handbook of soil and water chemical methods: Inkata Press Pty Ltd, 1992.
[16] Shirokova Y, Forkutsa I, Sharafutdinova N. Use of electrical conductivity instead of soluble salts for soil salinity monitoring in Central Asia. Irrigation and Drainage Systems, 2000; 14(3): 199–206.
[17] Hilhorst M A. A pore water conductivity sensor. Soil Science Society of America Journal, 2000; 64(6): 1922–1925.
[18] Meter Group. 5TE Operator’s manual. Pull man: Meter group, Inc. 2018. http://publications.metergroup.com/Manuals/20435_5TE_Manual_Web.pdf. Accessed on [2018-04-24]
[19] Kargas G, Soulis K X. Performance analysis and calibration of a new low-cost capacitance soil moisture sensor. Journal of Irrigation and Drainage Engineering, 2012; 138(7): 632–641.
[20] Rosenbaum U, Huisman J A, Weuthen A, Vereecken H, Bogena H R. Sensor-to-sensor variability of the ECH2O EC-5, TE, and 5TE sensors in dielectric liquids. Vadose Zone Journal, 2010; 9(1): 181–186.
[21] Scudiero E, Berti A, Teatini P, Morari F. Simultaneous monitoring of soil water content and salinity with a low-cost capacitance-resistance probe. Sensors, 2012; 12(12): 17588–17607.
[22] Kizito F, Campbell C S, Campbell G S, Cobos D R, Teare B L, Carter B, et al. Frequency, electrical conductivity and temperature analysis of a low-cost capacitance soil moisture sensor. Journal of Hydrology, 2008; 352(3-4): 367–378.