© 2013, IJCSMA All Rights Reserved, www.ijcsma.com 1 INTERNATIONAL JOURNAL OF COMPUTER SCIENCE AND MOBILE APPLICATIONS
Implementation of Band Pass Filter for
Homomorphic Filtering Technique
Pin Yang Tan
1, Haidi Ibrahim
21School of Electrical & Electronic Engineering, Engineering Campus, Universiti Sains Malaysia, 14000
Nibong Tebal, Penang, [email protected]
2
School of Electrical & Electronic Engineering, Engineering Campus, Universiti Sains Malaysia, 14000 Nibong Tebal, Penang, [email protected]
Abstract
In order to improve the performance of homomorphic filtering technique for face images, band pass filter is selected to replace the conventional high pass filter in homomorphic filtering technique. Apart from the noise reduction capability, the band pass filter is specifically designed for face images as it is based on the locations of illumination component in Fourier spectrum. The qualitative and quantitative analysis proven that the performance of band pass filter outweighs the conventional high pass filter.
Keywords: Homomorphic filtering technique; Band pass filter; Face images
1. Introduction
Homomorphic filtering technique is one of the image enhancement methods implemented in frequency domain. It is a kind of approach based on the illumination-reflectance image model which is very useful in performing image enhancement by simultaneous brightness range compression and contrast enhancement (Thamizharasi, 2010). There are a few researchers proposing different ways in implementing homomorphic filtering technique to enhance digital images. Adelmann (1998) used several different versions of high pass filter for homomorphic filtering technique. On the other hand, Jellus and Kiefer (2005) and Delac et al. (2006) modified the input image itself to improve the result of homomorphic filtering technique. Recent researches, such as the works by Fan and Zhang (2011) and Zhang et al. (2012) introduced the combination homomorphic filtering technique with other image enhancement methods to improve the quality of enhanced images.
Among the methods proposed, the conventional high pass filters used in homo-morphic filtering technique are not specifically designed to pre-process face images. Hence, a customized filter is needed in order to improve the performance of homomorphic filtering technique for face images.
© 2013, IJCSMA All Rights Reserved, www.ijcsma.com 2
equation for Butterworth low pass filter and high pass filter respectively. The low pass filter, HLP(u,v) and high
pass filter, HHP(u,v) can be multiplied and turn into modified Butterworth band pass filter, HBP(u,v) using the
high and low frequency gain (γH and γL) as shown in Eq. (3).
n LP d v u v u H 0 2 2 1 1 ) ,
( (1)
n LP HP d v u v u H v u H 0 2 2 1 1 1 ) , ( 1 ) ,
( (2)
H L
LP HP
LBP u v H u v H u v
H ( , ) ( , ) ( , ) (3)
where γH and γL are the high frequency gain and low frequency gain respectively, n is the order of filter, and d0
determines the cut-off frequency.
3. Experimental Results
© 2013, IJCSMA All Rights Reserved, www.ijcsma.com 3
(c) (d)
Figure 1: (a) The perspective plot of a filter design 3, (b) Top view, (c) Side view with u axis, (d) Cross-sectional view at v axis
As mentioned in Section 2, the main purpose of using band-pass filter is to eliminate the noise produced after the removal of shadow on the face images. The perspective plot of band-pass filter is illustrated in Fig. 1. The optimum parameters band-pass filter are obtained through the simulation using face images captured with a customized casing.
The order for band-pass filter is 10 whereas the lower and upper cut-off frequencies for band-pass filter are 35 pixels and 85 pixels respectively. The value 35 is chosen as the lower cut-off frequency because the maximum location of illumination components from various subjects is situated at 35 pixels from the DC component. On the other hand, the value 85 is chosen as the upper cut-off frequency as it is the minimum location to eliminate the noise components without losing the facial details. Besides, the high and low frequency gain are set as 0.55 and 0.3 respectively.
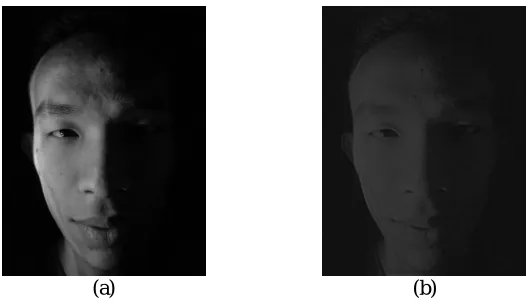
(a) (b)
© 2013, IJCSMA All Rights Reserved, www.ijcsma.com 4 Figure 3: Detected face features from enhanced face image using face feature detection software, Luxand
FaceSDK (Luxand FaceSDK, 2013)
The frequency gains are used to control the contributions of illumination and reflectance components. DC component of the output face image is increased by 1.5 times in order to increase the brightness of the image. These parameters are defined in such a way to produce best result of face image enhancement. Fig.2 shows the effect of band-pass filter on a poorly illuminated face images. Since the illumination components are suppressed by the band pass filter, the brightness of the enhanced face image is appeared to be lower than the input face image.
The performance of the band pass filter is evaluated based on the recognition rate of face recognition software, Luxand FaceSDK (Luxand FaceSDK 4.0, 2013). It is a cross-platform face detection that provides the coordinates of 66 facial feature points (including eyes, eye-brows, mouth, nose and face contours) for feature detection. It also provides a threshold function to adjust the sensitivity of the face detection. Hence, the evaluation is performed by inspecting the feature detection results of this software as well as the highest achievable threshold value by the face images. The detection result is considered successful if the software manages to detect all the important face features. Fig. 3 shows the face recognition software and a detected face image.
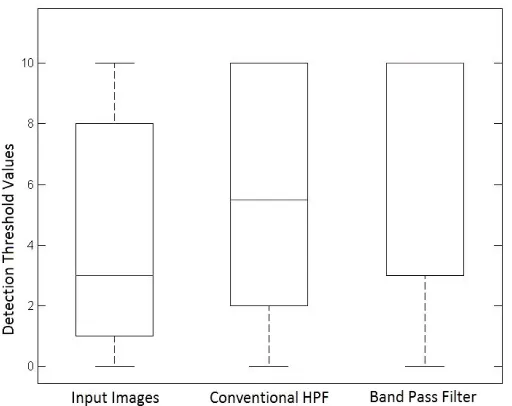
© 2013, IJCSMA All Rights Reserved, www.ijcsma.com 5 Figure 4: The box-and-whisker plot for the detection threshold value of input face images and the enhanced
face images using conventional high pass filter and band pass filter
On top of that, entropy function is used in quantitative analysis to determine the information contained in the input and output face images taken from 20 subjects. To make a reliable comparison, the entropy values obtained from 80 face images are presented using box-and-whisker plot as shown in Fig. 5.
The result shows that the entropy values for enhanced face images are lower as compared to the input face images. This is due to the loss of information after sup-pressing the illumination components. Besides, the entropy values are also affected by the brightness of face images. Therefore, the enhanced face images have lower entropy values after suppressing the illumination components. By comparing the entropy values of face images enhanced by conventional high pass filter and band pass filter, it is clearly seen that the enhanced face images from band pass filter have higher entropy values. This is because the presence of noise components significantly reduces the entropy values. Thus, based on quantitative analysis, band pass filter is more suitable to be implemented in homomorphic filtering technique.
© 2013, IJCSMA All Rights Reserved, www.ijcsma.com 6 Adelmann, H. G., 1998, Butterworth Equations for Homomorphic Filtering of Images. Computers in Biology and Medicine.
Vol. 28, pp. 169-181.
Delac, K., Grgic, M., and Kos, T., 2006, Sub-image Homomorphic Filtering Technique for Improving Facial Identification Under Difficult Illumination Conditions. In: International Conference on Systems, Signals and Image Processing (IWSSIP), pp. 95-98. Budapest, Hungary
Fan, C.-N., and Zhang, F.-Y., 2011, Homomorphic Filtering Based on Illumination Normalization Method for Face Recognition. Pattern Recognition Letters, vol. 32, pp. 1468-1479
Jellus, V., and Kiefer, B., 2005, Optimization of the Homomorphic Filter for Bias Field Correction. In: Proceedings of the 13th Annual Meeting of ISMRM, pp. 2247. Miami Beach, FL, USA
Luxand FaceSDK 4.0, Face Detection and Recognition Library, Developer’s Guide, http://www.luxand.com [Accessed on: June 2013]
Thamizharasi, A. M. E., 2010, Performance Analysis of Face Recognition by Combining Multiscale Techniques and Homomorphic Filter using Fuzzy K Nearest Neighbour Classifier. In: IEEE International Conference on Communication Control and Computing Technologies (ICCCCT), pp. 643-650.