Malaysian Online Journal of Educational Sciences 2017 (Volume5 - Issue 2 )
Effect of Strategy Teaching For the
Solution of Ratio Problems on Students'
Proportional Reasoning Skills
Ceylan ŞEN [1], Gürsel GÜLER [2]
[1] Department of Science Education,
Faculty of Education, Bozok University, Turkey
e-mail:[email protected]
[2] Department of Elementary Mathematics Education, Faculty of Education, Bozok University, Turkey e-mail:[email protected]
ABSTRACT
The study was conducted to reveal the effects of the instruction of different problem-solving strategies on the proportional reasoning skills of students in solving proportional problems in the 6th grade math’s class. Quasi-experimental
research model with pretest-posttest control group was employed in the study. For eight class hours, the experimental group students (n=16) were instructed to solve proportional problems by using the problem-solving strategies, whereas the control group students (n=16) were not instructed anything other than the current practice. In the study, “Proportional Reasoning Test”, developed by the researchers, was implemented as pretest and posttest for data collection. In addition, home assignments including proportional problems were used to observe the students’ improvement during the process. The quantitative data were analyzed using Wilcoxon signed-rank test and Mann-Whitney U test. It was found out that instruction of problem-solving strategies positively influenced the experimental group students’ proportional reasoning skills for solving proportional problems..
Keywords: Proportional Reasoning, Problem Solving Strategies, Ratio Problem
INTRODUCTION
Students are confronted with the proportional reasoning requirement from early ages in their daily lives (Lo and Watanabe, 1997). Students are aware that they take fewer steps while climbing up stairs two by two compared to climbing up one by one or they think they will get somewhere quicker while going at 50km/h compared to going at 25km/h. Proportional thinking is effective in solving problems including measurement, probability, percentage, ratio, plane geometry, algebra, trigonometry and equation in mathematics. Beyond mathematics, proportional reasoning has an important place in science, geography, geometry, physics and in many cases of daily life (Boyer, Levine and Huttenlocher, 2008; McIntosh, 2013; Duatepe, Akkus-Cıkla and Kayhan, 2005, Mitchell and Lawson, 1988). In fact, individuals unwittingly use proportional thinking in many areas of daily life such as determining recipes and mixing, and commercial affairs such as drawing on maps, purchasing and selling, and converting currencies (Tourniaire and Pulos, 1985). When viewed from this aspect, it is seen that proportional thinking and reasoning are among the main factors to understand and apply mathematics. Lamon (2005) emphasized the development of proportional reasoning skills for students to be successful in the fields of mathematics and science such as statistics, biology, physics, and geography.
Malaysian Online Journal of Educational Sciences 2017 (Volume5 - Issue 2 )
Ratio and proportion are important concepts in the proportional reasoning skill (Lesh, Behr and Post, 1988). According to Piaget and Inhelder (1975), the ratio is the term used in the comparison of the same or different states. For instance, when it is said the ratio of girls to boys in a classroom is 2:3, this means that we have made a comparison of boys and girls. If it is known that there are 30 students in the classroom, and, in this case, the process of finding the number of girls as 12 and the number of boys as 18 is known as a proportion (Cordel and Mason, 2000). Proportional reasoning skill should be developed to be able to make this comparison and to realize the proportion. Proportional thinking and reasoning are the multiplicative comparison of quantities, rational evaluation of the state (Baxter and Junker, 2001; Cramer, Post and Currier, 1993; Shield & Dole, 2008). Accordingly, being able to make a multiplicative comparison of two quantities means that there is a conceptualisation. Children at young ages make a comparison using addition or subtraction by evaluating the comparison of quantities as quantity (Dole et al., 2012). For instance, when the ratio of girls to boys is given as 2:3 and students are asked to compare girls and boys, many students say there are more boys than girls by one (Cordel and Mason, 2000). Based on this idea, it is deduced that the number of males will be 5 when the number of females is 4. The use of multiplicative language in the expression of ratio states is an indication of proportional reasoning (Slovin, 2000).
Development of proportional thinking is stated to be a time-consuming process (Kaput and West, 1994; NCTM, 2000). Proportional reasoning is essentially associated with multiplication and division topics. Operations performed on the set of rational numbers, fractions, decimal numbers, percentages, scale drawing and ratio-proportion topics are among the mathematical topics for which it forms a basis. Proportional reasoning is a rich conceptual understanding which is the basis of ratio-proportion topic (Hart, 1984; Karplus, Pulos and Stage, 1983). However, students have difficulty in developing this conceptual understanding based on their existing states of thinking (Dole et al., 2012). Thus, students should be given time to explore their understanding by presenting examples from different ratio states. Therefore, students should be provided with opportunities to develop their proportional thinking based on their own learning experience, and they should be encouraged in this regard.
To ensure that students think proportionately and develop different strategies, in-depth thinking should be developed by the use of proportional states and the introduction of different samples (Capraro et al., 2009; Cramer and Post, 1993; Clark and Lesh, 2003; Cramer, Post and Currier, 1993; Lobato et al., 2010). Presentation of such problems is interesting and effective in the development of proportional reasoning. Problems involving ratio states ensure the formation of proportional thinking and the realization of reasoning beyond the use of the procedure, rule and algorithm (Harel, Behr, Post and Lesh, 1991; Kaput and West, 1994). A procedural solution of such problems should not be evaluated as an indication of the fact that proportional thinking has occurred, thinking process should be considered. Therefore, it is important to provide environments that will gain proportional reasoning experience according to their level, and that will encourage to make assumptions for students at all levels.
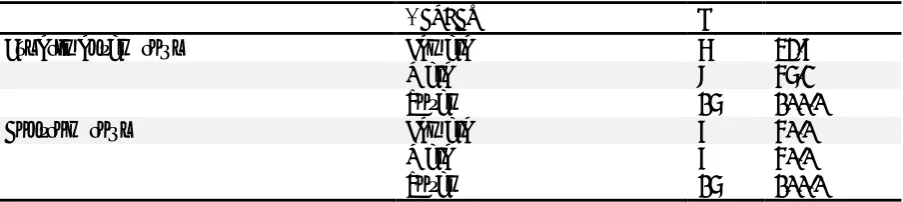
Table 1 Ratio Problem Types (Lamon, 1993) Semantic problem types Example
Measurement of quantity A driver measures the distance made by the car at certain intervals. Based on the fact that the distances made are 130, 325, 445 and 510 km, respectively, two, five, seven and eight hours after departing, has the driver driven at the same speed from the beginning of the road?
Part-part-whole There are a dozen eggs (8 white 4 brown) in one of two boxes, and there are 112 dozen eggs (10 white 8 brown) in another box. In which box is the brown egg ratio higher?
Relevant groups 3 pizzas were ordered for 7 girls sitting at a table, and 1 pizza of the same size was ordered for 3 men sitting at the next table. In this case, individuals of which group will have more pizza?
Comparison-elongation 5 years ago, the height of A tree was measured as 8 m, and the height of B tree was measured as 10 m. Based on the fact that today the height of A tree is 14 m, and the height of B tree is 16 m, which tree has got higher according to the previous height?
Malaysian Online Journal of Educational Sciences 2017 (Volume5 - Issue 2 )
Proportional reasoning is called the basic building block of mathematics teaching in primary and secondary education (Kilpatrick, Swafford and Findell, 2001; Lamon, 1999; Lesh, Post and Behr, 1988). Proportional reasoning is a skill that should be developed at the secondary school level and that forms the basis for algebraic reasoning (Langrall and Swafford, 2000; Lesh, Post and Behr, 1988). Proportional reasoning skill includes being able to think of ratio states, finding equality and creating graphs and tables, as well as being able to understand ratio expressions (NCTM, 1989). In this respect, development of secondary school students' proportional reasoning skills is very important in terms of mathematics teaching. Therefore in this study, it is aimed to determine the effect of problem-solving strategies in the solution of problems including ratio state on the 6th-grade secondary school students' proportional reasoning skills. In this regard, answers
were sought to the following questions;
1. Does teaching of problem-solving strategies has an effect on the development of the 6th-grade secondary
school students' proportional reasoning skills?
2. Does teaching of problem-solving strategies has an effect on the development of the 6th-grade secondary
school students' ability to solve ratio problems using different strategies?
METHOD
A quasi-experimental research design with the pretest-posttest control group was used in the research. The quasi-experimental research design is performed in the selection of experimental and control group members in cases where random assignment is not possible (Fraenkel, Wallen and Hyun, 2012). According to Karasar (2009), experimental and control groups that cannot be formed randomly are present in the experimental design with the pretest-posttest control group. In this study, the quasi-experimental design was preferred since there was not the possibility of random selection. Before the experimental implementation, students' proportional reasoning skill levels were determined and experimental and control groups were formed. In the implementation, the topic of "ratio" was selected so as to comply with the 6th-grade mathematics program, and then an 8-week implementation was performed.
In the study, the "Proportional Reasoning Test" (PRT), which was developed by the researchers, was applied to the experimental and control groups as pretest and posttest. Furthermore, the problem states given as homework were used to observe the experimental and control group students’ developments of proportional reasoning skills within the process.
Participants
The research was carried out with the participation of 32 sixth-grade students receiving education at a secondary school which was randomly selected from a province located in Central Anatolia in the fall semester of the 2015-2016 academic years. Before the implementation, permissions of Ministry of National Education (MNE), school principals and parents were received, and students who would voluntarily participate in the study were determined. Experimental and control group students were randomly formed by a lot. Then, the 8-week implementation process was carried out for both experimental and control groups by the first author. Demographic information about participants involved in the study is given in Table 2.
Table 2 Demographic information about participants
Gender f %
Experimental Group Female 7 43,8
Male 9 56,2
Total 16 100,0
Control Group Female 8 50,0
Male 8 50,0
Total 16 100,0
Data collection tool
In the study, the relevant literature (Akkus-Cıkla and Duatepe, 2002; Karplus, Pulos and Stage, 1983; Lamon, 1993; Langrall and Swafford, 2000; Lo and Watanabe, 1997; Parish, 2010; Van de Walle, 2001) was
Malaysian Online Journal of Educational Sciences 2017 (Volume5 - Issue 2 )
reviewed to determine the students' proportional reasoning skill levels, and the Proportional Reasoning Test (PRT), which was prepared by the researchers, was used. During the process of the PRT preparation, the presence of questions of each type of problem and the fact that students could answer the test within the duration of a course hour (40 min) were taken into consideration. The test included 6 ratio problem states including one question of finding a value which is not given, two questions of quantitative comparison, two questions of qualitative comparison and one question of inverse proportion.
Before the actual implementation, a pilot study was conducted with the participation of 10 sixth-grade students to examine the clarity of the prepared test and the response times. Afterwards, the final version of the PRT was applied as pretest-posttest by taking the data obtained in the pilot study and expert opinions for the form (Appendix A). The PRT used in the study was graded according to proportional reasoning levels defined by Langrall and Swafford (2000). Accordingly, the score interval that could be got from the test was calculated as 0-20.
In addition to the proportional reasoning test, ratio problem questions given as homework were used to determine students' developments during implementation. A problem form was prepared and applied to determine students' developments of problem-solving strategies for ratio problems. The form containing problems belonging to different types of problems consists of 4 questions that were selected from the proportional reasoning test prepared by Akkus-Cıkla and Duatepe-Paksu (2006) (Appendix B).
DATA ANALYSIS
Students' answers given to the PRT used as pretest-posttest and the problem form used as homework were classified and graded according to the proportional reasoning levels defined by Langrall and Swafford (2000). Answers of 10 students in the pilot study were analyzed by the researchers together in the classification and grading of the problem solutions, and it was aimed to ensure compliance in the analyses. In the students’ answers obtained in the actual implementation, researchers carried out the analyses independently from each other. Researchers came together at certain periods in this process and continued their analyses by making comparisons for the classification of levels. In the case of any indecisiveness in the classification of researchers, arrangements were made by making discussions on the classification of problems. Researchers' coefficients of concordance in the analyses at the end of the classification process varied between 94% and 100%. The coefficient of concordance between researchers was calculated using a (Agreement / (Agreement + Disagreement) x100) formula which was developed by Miles and Huberman (1994).
Proportional reasoning levels which were defined by Langrall and Swafford (2000) and which were used in the analyses by the researchers to determine the level of students are presented below. According to the proportional reasoning levels, the score interval that students could take from the 6-item test was calculated as 0-20. Accordingly, 0-5 score interval was classified as a very low level, 6-10 score interval was classified as a low level, 11-15 score interval was classified as a medium level, and 16-20 score interval was classified as a high level. In this way, the experimental and control group students' proportional reasoning levels before and after the experimental procedure were determined, and their developments were identified. Proportional reasoning levels defined by Langrall and Swafford (2000) were classified as;
Level 0 (Absence of proportional reasoning): Inability to recognize proportional states, making baseless predictions, using visual cues, inability to recognize multiplicative relationship, using numbers, operations, and strategies randomly, making a comparison based on the addition relationship instead of a comparison based on the multiplicative relationship
Level 1 (Informal reasoning about proportional states): Noticing the ratio, making qualitative comparisons, using pictures, models or concrete materials to make sense of the state
Level 2 (Quantitative reasoning about proportional states): Using unitizing or the combined units, finding and using unit ratios, finding and using change multiplier, using equivalent fractions, increasing both measures in a ratio, forming proportion by using variables and solving the proportion with the help of cross-multiplication, fully understanding the unchanging relationships and relationships changing together
Level 3 (Formal reasoning about proportional states): Using a precise and accurate language during quantitative reasoning about proportional states.
Malaysian Online Journal of Educational Sciences 2017 (Volume5 - Issue 2 )
Students can make errors in the solution of problems involving ratio state because of their low level of proportional reasoning skills. In the study carried out by Ben-Chaim et al. (1998), error types used in solutions, as well as problem-solving strategies, were classified as emotional answering, social relationship and neglect of data. In the study, enhancement strategy was also defined in addition to problem-solving strategies as well as the types of errors.
Emotional answering: Subjective answers without any mathematical inference.
Social relationship: Solutions that cannot be fulfilled by proportional reasoning and through which multiplicative relations cannot be established.
Neglect of data: Making a solution by considering one of the two data in the ratio relationship. Enhancement: Making operation by adding on data in the ratio relationship given.
In this study, in which the quasi-experimental design with the pretest-posttest control group was used, the difference of proportional reasoning levels between the experimental group, in which teaching of strategies used in solving ratio problems was performed, and the control group, in which no strategy teaching was performed, was examined. Before starting the analysis of statistical operations, the Shapiro-Wilk normality test was carried out to determine the distribution of the experimental and control groups, and it was seen that groups did not show normal distribution. Non-parametric tests were used in the analysis of the data due to the low number of students in the experimental (n=16) and control (n=16) groups and the lack of normal distribution. Accordingly, analyses were carried out by using the Mann-Whitney U test in the intergroup pretest-posttest comparisons and the Wilcoxon Signed-Ranks Test in the intra-group pretest and posttest comparisons. The significance level used in statistical analyses used in the study was determined to be .05.
The problem form, which was used to determine the students' development of proportional reasoning skills, was used for the purpose of supporting pretest-posttest results. Students’ answers in the problem form were analyzed and classified by being evaluated by the researchers. The classification was conducted according to the proportional reasoning levels defined by Langrall and Swafford (2000). Data related to homework for which scoring was not made were directly presented by citations to reveal the difference of proportional reasoning skills in the experimental and control groups.
Implementation
The implemantation was carried out in an 8-week period by the first author. In the first week of the study, experimental and control groups were formed, and the PRT was applied as pretest. Then, the problem types to be used in the teaching of the experimental group in accordance with the problem types defined by Lamon (1993) were formed by the researchers. The solving strategies of the prepared ratio problem types were planned to be included in the six-week period.
Four different problem-solving strategies defined by Cramer and Post (1993) were applied within a course hour in a week during six weeks with the experimental group students in the study. Cramer and Post (1993) examined the students' answers to the problem types (Lamon, 1993) and observed that four different solution strategies were used. These strategies were classified as;
Unit ratio strategy: Comparison of quantities given by finding their equivalent of one unit
Equivalent fraction strategy: Comparison of quantities given by finding the common multiple of the ratios in quantities
Cross-multiplication algorithm: Finding of the unknown value through equality in the proportion formed between data
Change multiplier: Making comparison by reducing or raising the quantitative characteristics of the first quantity to the quantitative characteristic of the second quantity.
In each of the courses conducted with the experimental group, two ratio problems were solved by the students using problem-solving strategies. The experimental study process was carried out by applying a total of 12 ratio problems for 6 weeks using different problem-solving strategies. In the first week of the implementation, two ratio problems were solved by the researcher using different solution strategies. In the subsequent in-class implementations, students solved ratio problems using different solving strategies under the guidance of the researcher. Students were supported to share their solutions with their friends, and thus, other students were also ensured to be aware of the different solution strategies. In the implementation process, different solution strategies performed by students were reflected onto the smart board in solving all problems including ratio states. Students were guided to use different solution strategies in solving
Malaysian Online Journal of Educational Sciences 2017 (Volume5 - Issue 2 )
problems. In the fourth week of the study, the problem form, which was prepared to determine the developments of students' problem-solving strategies for ratio problems, was given as homework. In the fifth week of the implementation, students' responses to the homework form were collected and classified. At the end of the eighth week of the study, the PRT was applied as posttest and the implementation process was completed. Problems involving ratio states used in the experimental group were presented to the students in the control group, and they were solved according to the mathematics curriculum, which was already applied. No intervention was made for strategies used by control group students in solving problems, and student solutions to the problems presented were carried out.
FINDINGS
This section includes the findings and interpretations obtained from the statistical analyses performed concerning answers of the students in the experimental and control groups to the PRT and homework. Non-parametric statistical processes were used in the analyses since the Shapiro-Wilk normality test results of the experimental and control groups did not show normal distribution. Pretest scores that students in the experimental and control groups received from the proportional reasoning test before the experimental process were compared using the Mann-Whitney U test. The analysis results are listed in Table 3. According to the findings in the table (U = 89.50, p> .05), it is seen that experimental and control group students did not show a statistically significant difference before the experimental process. This indicates that groups were equivalent to each other before the experimental process.
Table 3 Experimental and control group students' pretest PRT Mann-Whitney U Test results
Pretest-posttest scores received by the students in the experimental group, in which problem-solving strategies for proportional reasoning skills were applied, were compared with the Wilcoxon Signed-Rank test. In Table 4, it is seen that there was a statistically significant difference between the pretest and posttest scores of experimental group students, and this difference was in favor of the posttest scores (p=.002<.05).
Table 4 Experimental group students' pretest-posttest PRT Wilcoxon Signed-Rank Test results
Posttest-Pretest n Average Rank Total Rank Z p
Negative Ranks 1a 2,50 2,50 -3,393b ,001
Positive Ranks 15b 8,90 133,50
Equal 0c
Total 16
Pretest-posttest scores that students in the control group received from the PRT were compared with the Wilcoxon Signed-Rank test. In Table 5, it is seen that there was a statistically significant difference between the pretest and posttest scores of control group students and this difference was in favor of the posttest scores (p<.05).
Table 5 Control group students' pretest-posttest PRT Wilcoxon Signed-Rank Test results
Posttest-Pretest n Average Rank Total Rank Z p
Negative Ranks 1a 13,50 13,50 -2,473b ,013
Positive Ranks 13b 7,04 91,50
Equal 2c
Total 16
Groups N Average Rank Total Rank U p
Experimental 16 18,91 302,50 89,50 ,145
Control 16 14,09 225,50
Malaysian Online Journal of Educational Sciences 2017 (Volume5 - Issue 2 )
Posttest scores that students in the experimental and control group received from the PRT after the experimental process were compared with the Mann-Whitney U test. Analysis results are listed in Table 6. In the table, it is seen that the average rank of the PRT posttest score was 21,59 in the experimental group students and 11,41 in the control group students. This result shows that there was a statistically significant difference between the PRT posttest scores of the experimental and control groups in favor of the experimental group (U=46.500, p=.002<.05). Therefore, it can be said that teaching of problem-solving strategies conducted with the experimental group students positively contributed to proportional reasoning skills.
Table 6 Experimental and control group students' posttest PRT Mann-Whitney U Test results
Groups N Average Rank Total Rank U p
Experimental 16 21,59 345,50 46,500 ,002
Control 16 11,41 182,50
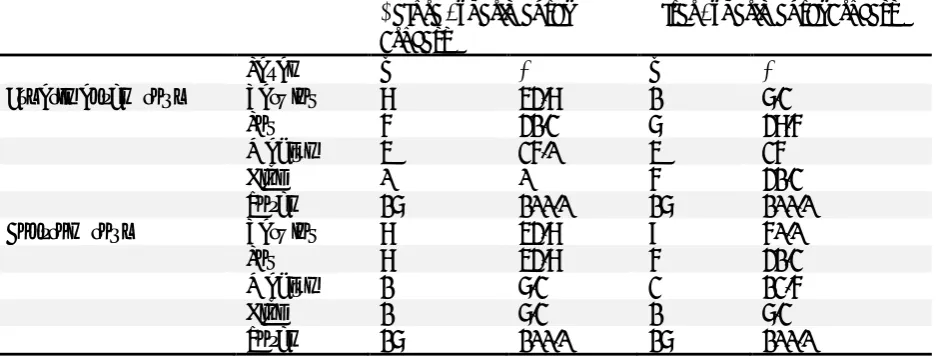
Students' proportional reasoning skill levels before and after the experimental processes are given in Table 7. According to the findings in the table, it is seen that experimental group students' proportional reasoning levels before the experimental process were very low at the rate of 43.7% (n = 7), low at the rate of 31.2% (n = 5), medium at the rate of 25% (n = 4), and that no student was at the high level. It is seen that experimental group students' proportional reasoning levels after the experimental process were very low at the rate of 6.2% (n = 1), low at the rate of 37.5% (n = 6), medium at the rate of 25% (n = 4) and high at the rate of 31.2% (n = 5). On the other hand, control group students' proportional reasoning levels before the experimental process were very low at the rate of 43.7% (n = 7), low at the rate of 43.7% (n = 7), medium at the rate of 6.2% (n = 1) and high at the rate of 6.2% (n = 1). It is seen that there were changes in the control group students' proportional reasoning levels after the experimental process, they were very low at the rate of 50% (n = 8), low at the rate of 31.2% (n = 5), medium at the rate of 12.5% (n = 2) and high at the rate of 6.2% (n = 1). Therefore, it is seen that the proportional reasoning skills development levels of the students in the experimental group, in which problem-solving strategies were applied, were more stable and positive compared to the students in the control group. This can be interpreted that the teaching based on the problem-solving strategies applied in the experimental group made positive contributions to the development of students' proportional reasoning skills compared to the curriculum being applied.
Table 7 Experimental and control group students' proportional reasoning skill levels before and after the experimental process
Before Experimental
Process After Experimental Process
Level f % f %
Experimental Group Very low 7 43,7 1 6,2
Low 5 31,2 6 37,5
Medium 4 25,0 4 25
High 0 0 5 31,2
Total 16 100,0 16 100,0
Control Group Very low 7 43,7 8 50,0
Low 7 43,7 5 31,2
Medium 1 6,2 2 12,5
High 1 6,2 1 6,2
Total 16 100,0 16 100,0
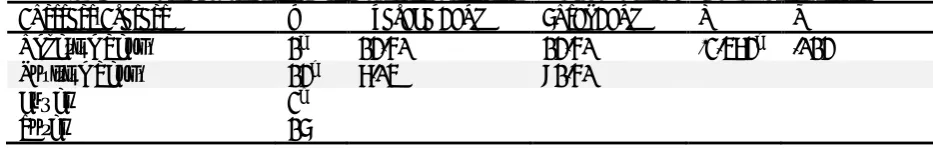
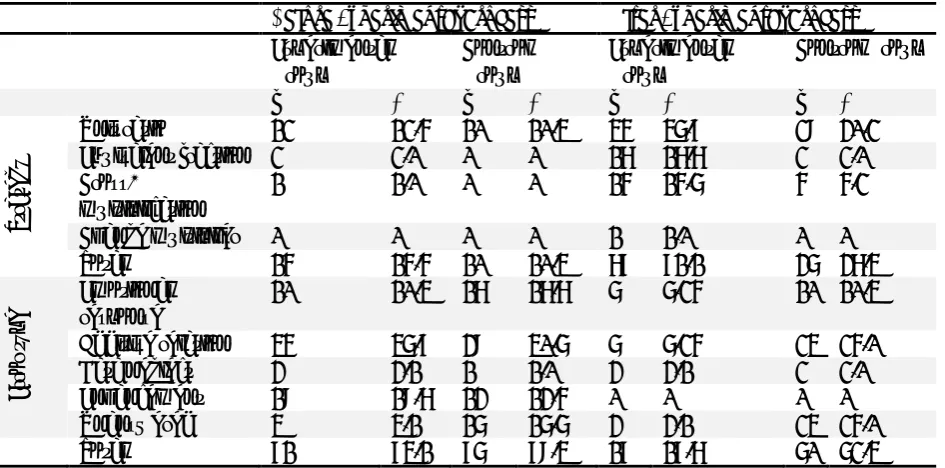
Findings concerning which strategies were used by the experimental and control group students and what types of errors they made in the questions included in the proportional reasoning test are given in Table 8. When the table was analyzed, it was seen that the percent of students who use any problem-solving strategies before the experimental process was 15.5% in the experimental group and 10.4% in the control group. When the analysis was carried out according to the types of errors made in solving problems before the experimental process, it was determined that 84.1% of the students in the experimental group and 89.4%
Malaysian Online Journal of Educational Sciences 2017 (Volume5 - Issue 2 )
of the students in the control group had different types of errors. It is seen that the percent of using problem-solving strategies in problem-solving ratio problems after the experimental process were 81.1% in the experimental group students and 37.4% in the control group students. 18.7% of the experimental group students and 62.4% of the control group students are included in the types of error. This situation shows that the proportional reasoning skill levels of students in the experimental group, in which strategy teaching was applied, were higher compared to the control group students.
Table 8 Experimental and control group students' problem-solving strategies and the types of errors they have before and after the experimental process
Before Experimental Process After Experimental Process Experimental
Group Control Group Experimental Group Control Group
f % f % f % f %
Str
ate
gy
Unit ratio 12 12,5 10 10,4 45 46,8 29 30,2
Equivalent fraction 2 2,0 0 0 17 17,7 2 2,0
Cross-multiplication 1 1,0 0 0 15 15,6 5 5,2
Change multiplier 0 0 0 0 1 1,0 0 0
Total 15 15,5 10 10,4 78 81,1 36 37,4
Er
ro
r t
yp
e Emotional response 10 10,4 17 17,7 6 6,25 10 10,4 Additive relation 45 46,8 39 40,6 6 6,25 24 25,0
Data neglect 3 3,1 1 1,0 3 3,1 2 2,0
Enhancement 19 19,7 13 13,5 0 0 0 0
Unanswered 4 4,1 16 16,6 3 3,1 24 25,0
Total 81 84,1 86 89,4 18 18,7 60 62,4
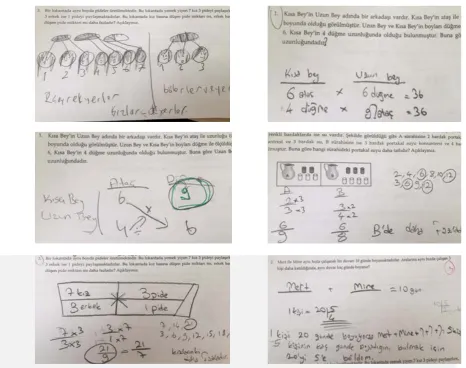
Findings for the answers given by the experimental and control group students to the homework related to problems involving ratio states are presented in Figure 1 and Figure 2. Experimental group students' solutions to problems in the homework support the scores they got from the PRT. It is seen that experimental group students used different strategies in the solution of problems and made statements by correct expressions. Strategies used by the students in problem solving were found to be cross-multiplication, creating equivalent fractions, and unit fractions.
Malaysian Online Journal of Educational Sciences 2017 (Volume5 - Issue 2 )
Figure. 1 Experimental group students' sample problem solutions
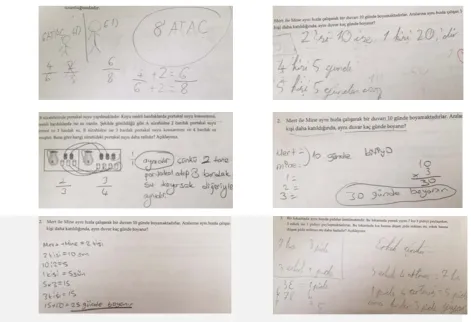
Control group students' solutions for the ratio problems given as the homework are presented in Figure 2. When the answers of the students in the control group were analyzed, it was seen that multiplicative relations were not noticed and thus incorrect solutions and explanations were made. As it can be seen in students' sample solutions, it can be said that experimental group students used problem-solving strategies more effectively and that their proportional reasoning skills levels were higher. Meanwhile, it was seen that experimental group students noticed the multiplicative relations and their explanations supported the results they achieved. It was observed that control group students made additive operations and that their solutions were incorrect since they could not notice ratio and proportional relations.
Malaysian Online Journal of Educational Sciences 2017 (Volume5 - Issue 2 )
Figure. 2 Control group students' sample problem solutions
CONCLUSION AND DISCUSSION
In this study carried out to determine the effect of the teaching of problem-solving strategies on the proportional reasoning skills of the 6th-grade students, the results obtained and the discussion made in the
context of the literature based on the findings obtained as a result of the implementation are presented in this section. In the study, different kinds of ratio problems were used in the teaching of the subject of ratio, and the solutions of these problems were made using problem-solving strategies. In this way, the relation between students' proportional reasoning skills development and problem-solving strategies was analyzed. It was seen that students' proportional reasoning skills levels were low both in the experimental group and control group before the experimental process compared to proportional reasoning skills determined after the experimental process. This result shows that the teaching of the subject of ratio made positive contributions to students' proportional reasoning skills.
It was seen that students with low levels of proportional reasoning could notice the proportional states in general but frequently made calculation errors and that those who got the correct answer were unable to use statements to explain the reasons. It was determined that although students with a medium level of proportional reasoning noticed the proportional states, they had difficulty in demonstrating this state as operational and that they could achieve a solution using the correct strategies in problems. It was seen that students with high levels of proportional reasoning reached the correct results by noticing the proportional relations and could express the obtained results with their own words (Akkus-Cıkla and Duatepe-Paksu, 2006; Langrall and Swafford, 2000). It is seen that the proportional reasoning levels of students in the experimental group, in which the teaching of problem-solving strategies was conducted, were higher after the experimental process compared to the control group students. Similarly, it was seen that there was a statistically significant difference in favor of the experimental group students when the PRT pretest-posttest implementation results were analyzed. This result shows that problem-solving strategies
Malaysian Online Journal of Educational Sciences 2017 (Volume5 - Issue 2 )
teaching had positive effects on proportional reasoning skills. This result obtained in the study is consistent with the results of studies in the literature (Akkus-Cıkla and Duatepe, 2002; Celik and Ozdemir-Yetkin, 2011; Langrall and Swafford, 2000).
Students' use of strategy in the solution of problems involving ratio state was found to be at low levels before the experimental process. It was determined that the ratio and diversity of the experimental group students' use of problem-solving strategies increased after the experimental process. Meanwhile, it was seen that there was a statistically significant difference in the proportional reasoning skills level in favor of the control group students. When the types of errors made by students in problem solving were analyzed, it was seen that 84.1% of the experimental group and 89.4% of the control group had the specified types of errors before the experimental process. After the experimental process, this ratio changed to 18.7% for the experimental group and to 62.4% for the control group. When students' error ratios before and after the experimental process are analyzed, it can be said that teaching of the subject of ratio reduced the students' error ratios. Moreover, when the types of error ratios between the experimental and control groups are analyzed, it is seen that the use of strategy in solving proportional problems reduced the students' incorrect answers. Therefore, it could be said that strategy teaching contributed to the students in terms of noticing multiplicative relations and developing different solutions.
Problem-solving strategies that experimental and control group students most frequently used in solving problems after the experimental process were found to be unit ratio, cross-multiplication, and equivalent fractions. It was determined that students more frequently used the equivalent fractions creation strategy in the questions included in the comparison-elongation problem type. In the answers given to part-part-whole and related groups problem types, it was seen that unit ratio and cross-multiplication strategies were more frequently used. It could be said that unit ratio strategy was further used by students since it is an intuitive strategy (Cramer and Post, 1993). Singh (2000) stated that the use of unit ratio strategy made it difficult for students to see the multiplicative relations. However, it could be said that the fact that students encountered the concepts of ratio and proportioning for the first time led them to be more inclined to use the unit ratio strategy. However, Duatepe, Akkus-Cıkla and Kayhan (2005) indicated in their study that more use of cross-multiplication strategy by students resulted from the fact that it is the algorithm which is included in course books at the most. Slovin (2000) stated that more use of cross-multiplication strategy resulted from the mathematical language used in problems and that students should be directed towards the use of different strategies in the development of proportional reasoning skills. Cramer and Post (1993) defined the proportional reasoning skill as the ability to use different problems strategies. Similarly, the results obtained in this study show that problem-solving strategies teaching made positive contributions to students’ solving problems with the use of different strategies and this also made positive contributions to students' development of proportional reasoning skills.
SUGGESTION
In this study, it was determined that the use of different problem-solving strategies in the teaching of problems involving ratio states had positive effects on the development of proportional reasoning skills. Accordingly;
• Teaching content should be created with verbal contextual problem states for the development of proportional reasoning skills and for the fact that proportional operations are not perceived as a procedural. Thus, problem states faced by students in daily life are brought into the classroom environment, and students are ensured to transfer information they learn at school to daily life.
• Students' proportional reasoning skills development can be supported by including different types of problems and different problem-solving strategies in the solution of proportional problems.
• Students should be given an opportunity to be able to learn the subject of ratio and to think proportionally, and it should not be hurried in transition to operational states.
• Students should be ensured to see the multiplicative and additive relations and their differences in the comparison of quantities.
Malaysian Online Journal of Educational Sciences 2017 (Volume5 - Issue 2 )
REFERENCES
Akkus-Cıkla, O., and Duatepe A. (2002). A qualitative study on the proportional reasoning skills of the preservice elementary mathematics teachers. Hacettepe Journal of Education Faculty, 23, 32-40.
Akkus-Cıkla, O., and Duatepe-Paksu, A. (2006). Orantısal akıl yürütme becerisi testi ve teste yönelik dereceli puanlama anahtarı geliştirilmesi. Eğitim Araştırmaları, 6, 25, 1-10.
Baxter G. P., and Junker, B. A. (2001). Designing cognitive-developmental assessments: Case study in proportional reasoning. Paper presented at the annual meeting of the National Council for Measurement in Education Seattle, Washington.
Ben-Chaim, D., Fey, J. T., Fitzgerald, W. M., Benedetto, C., and Miller, J. (1998). Proportional reasoning among 7th grade students with different curricular experiences. Educational Studies in Mathematics, 36, 247-273.
Boyer, T. W., Levine, S. C., & Huttenlocher, J. (2008). Development of proportional reasoning: Where young children go wrong. Developmental Psychology, 44, 1478–1490.
Capraro, M. M., Capraro, R. M., Harbaugh, A., Cifarelli, V., Pugalee, D., and Lamm, M. (2009). Developıng proportional reasoning across ideas of equality. In proceeding, International Symposium Elementary Maths Teaching. August, The Czech Republic (267-268).
Celik, A., and Özdemir-Yetkin, E. (2011). The relationship between elementary school students’ proportional reasoning skills and problem posing skills ınvolving ratio and proportion. Pamukkale University Journal of Education, 30, 1-11.
Clark, K., and Lesh, R. (2003). Whodunit? Exploring proportional reasoning through the footprint problem. School Science and Mathematics, 103(2), 92-98.
Cordel, B., and Mason, R. (2000). Proportional reasoning (Algebraic thinking series). Fresno, CA: Aims Education Foundation.
Cramer, K., and Post, T. (1993). Connecting research to teaching proportional reasoning. Mathematics Teacher, 86(5), 404-407.
Cramer, K., Post, T., and Currier, S. (1993). Learning and teaching ratio and proportion: Research implications. In O. Douglas (Eds.), Research Ideas for The Classroom: Middle Grades Mathematics, (pp.159–178). New York: Macmillan.
Dole, S., Clarke, D., Wright, T., and Hilton, G. (2012). Students' proportional reasoning in mathematics and science. In Proceedings of the 36th Conference of the International Group for the Psychology of Mathematics Education (Vol. 2, pp. 195-202). National Taiwan Normal University.
Duatepe A., Akkus-Cıkla O., and Kayhan M. (2005). An investigation on students’ solution strategies for different proportional reasoning items. Hacettepe Journal of Education Faculty, 28, 73-81.
Fraenkel, J. R., Wallen, N. E. and Hyun, H. H. (2012). How to design & evaluate research in education (8th Ed.). London: McGraw Hill.
Malaysian Online Journal of Educational Sciences 2017 (Volume5 - Issue 2 )
Harel, G., Behr, M., Post, T., and Lesh, R. (1991). Variables affecting proportionality: In F. Furinghetti (Eds),
Proceedings of the Fifteenth Annual Meeting of the International Group for the Psychology of
Mathematics Education (pp. 125-132). Assisi, Italy: International Group for the Psychology of Mathematics Education.
Hart, K. M. (1984). Ratio: Children's strategies and errors. Windsor, England: NFER-Nelson.
Kaput, J., and West, M. (1994). Missing value proportional reasoning problems: Factors affecting informal reasoning patterns. In G. Harel & J. Confrey (Eds.), The development of multiplicative reasoning in the learning of mathematics (pp. 61-85). Albany, NY: State University of New York Press.
Karasar, N. (2009). Bilimsel Araştırma Yöntemi. Ankara: Nobel Yayın Dağıtım.
Karplus, R., Pulos, S., and Stages, E. K. (1983). Proportional Reasoning of Early Adolescents. In R. A., Lesh & M., Landau (Eds.), Acquisition of Mathematics Concepts and Processes (pp. 45-90). Academic Press.
Kilpatrick, J., Swafford, J., and Findell, B. (2001). Adding it up: Helping children learn mathematics. Washington, DC: National Academy Press.
Lamon, S. (1993). Ratio and proportion: Connecting content and children's thinking. Journal for Research in Mathematics Education, 24, 41-61.
Lamon, S. (1999). Teaching fractions and ratios for understanding: Essential content knowledge and instructional strategies for teachers. Mahwah, NJ: Lawrence Erlbaum.
Lamon, S. (2005). Teaching fractions and ratios for understanding: Essential content knowledge and instructional strategies for teachers (2nd ed.). Mahwah, NJ: Erlbaum.
Langrall, C. W., and Swafford, J. (2000). Three balloons for two dollars; developing proportional reasoning. Mathematics Teaching in the Middle School, 6(4), 254-261.
Lesh, R., Post, T., and Behr, M. (1988). Proportional reasoning. In J. Hiebert & M. Behr (Eds.), Number concepts and operations in the middle grades (pp. 93-118). Reston, Virginia: Lawrence Erlbaum.
Lo, J. J., and Watanabe, T. (1997). Developing ratio and proportion schemes: A story of a fifth grader. Journal for Research in Mathematics Education, 28(2), 216-236.
Lobato, J., Ellis, A. B., Charles, R. I., and Zbiek, R. M. (2010). Developing essential understanding of ratios, proportions & proportional reasoning. Reston, VA: National Council of Teachers of Mathematics.
McIntosh, M. B. (2013), Developing Proportional Reasoning in Middle School Students, Masters of Mathematics, College of Science, The University of Utah.
Miles, B., and Hubermam, A. M. (1994). Qualitative Data Analysis: An expended sourcebook (2nd ed.). Newbury Park, CA: Sega.
Mitchell, A., and Lawson, A. E. (1988). Predicting genetics achievement in nonmajors college biology. Journal of Research in Science Teaching, 25(1), 23-37.
Malaysian Online Journal of Educational Sciences 2017 (Volume5 - Issue 2 )
National Council of Teachers of Mathematics (2000), Principles and Standards for School Mathematics, National Council of Teachers of Mathematics, Reston, VA.
National Council of Teachers of Mathematics (NCTM) (1989). Curriculum and Evaluation Standards for School Mathematics, National Council Teachers of Mathematics Pub, Reston: VA.
Parish, L. (2010). Facilitating the Development of Proportional Reasoning through Teaching Ratio. In L. Sparrow, B.Kissane, & C. Hurst (Eds.), Shaping the future of mathematics education: Proceeding of the 33rd annual conference of the Mathematics Education Research Group of Australasia. Fremantle: MERGA.
Piaget, J., and Inhelder, B. (1975). The origin of the idea of chance in children. New York: W. W. Norton.
Singh, P. (2000). Understanding the concepts of proportion and ratio among grade nine students in Malaysia. International Journal of Mathematical Education in Science and Technology, 31(4), 579-599.
Shield, M. J., and Dole, S. (2008). Proportion in middle-school mathematics: it’s everywhere. The Australian Mathematics Teacher, 64(3), 10-15.
Slovin, H. (2000). Moving to proportional reasoning. Mathematics Teaching in the Middle School, 6(1), 58-60.
Tourniaire, F., and Pulos, S. (1985). Proportional reasoning: a review of the literature. Educational Studies in Mathematics, 16, 181-204.
Van de Walle, J. (2001). Elementary and Middle School Mathematics: Teaching Developmentally, (4th ed.). New York: Addison Wesley Longman.
APPENDIX
-A
Proportional Reasoning Test
1. The following table includes data on the weights of Fatih, Seda, and Emre. Fatih, Seda, and Emre are on a diet. They recorded their weights at the beginning of the diet and the subsequent weights by weighing at two-week intervals. Who do you think had the best diet at the end of four weeks? Explain with reasons. 2. You should suggest the player who shoots ideally for a basketball season-end match. The statistics of
players' throws are as follows; Ali: hit 2 of 10 throws. Ahmet: hit 5 of 15 throws. Hasan: hit 4 of 12 throws. Murat: hit 14 of 24 throws.
Who do you think made the best throw? Explain the reason.
3. Little squares illustrate the materials used in each jug. Yellow square represents the lemon concentrate, and the blue square represents the water.
In which jug lemonade flavor is more?
Or is the taste in both jugs the same? Explain your answer with reasons.
4. While Esin paid 2 liras to stationery shop for 3 balloons, how much should Mehmet who wants to buy 24 balloons pay? Explain the solution.
5. The lengths of two flowers were measured as 8 cm and 12 cm. The lengths of two flowers were measured as 12 cm and 16 cm after two weeks. Which flower has further elongated? Explain with reasons.
Malaysian Online Journal of Educational Sciences 2017 (Volume5 - Issue 2 )
6. The land size and the planted pine trees are given in the table.
Acres 5 10 15 20 25
Pine trees 75 150 225
Based on the given information, find the number of pine trees located in 20 and 25 acres of lands. Explain through which way you have reached this number.
APPENDIX
-B
Ratio Problem Form
1. Mr. Short has a friend named Mr. Long. When the length of Mr. Short was measured with a paper clip, it was seen that his length was equal to 6 paper clips length. When the lengths of Mr. Short and Mr. Long were measured with a button, it was seen that Mr. Long's length was equal to 6 button length, and Mr. Short’s length was equal to 4 button length. Accordingly, how many paper clips correspond to Mr. Long’s length?
2. Mert and Mine paint a wall in 10 days by working at the same speed. When 3 people who also work at the same speed are included among them, in how many days is that wall painted?
3. Same sizes of flatbreads are produced in a restaurant. While 7 girls eating in this restaurant share 3 pieces of flatbreads, 3 men share 1 piece of flatbread. Which one is more, the amount of flatbread per girl or the amount of flatbread per man in this restaurant? Explain.
4. Orange juice is made in the jugs of A and B. Dark glasses include orange juice concentrate, and light-coloured glasses include water. As it is seen in the figure, 2 glasses of orange juice concentrate and 3 glasses of water were poured into jug A, and 3 glasses of orange juice concentrate and 4 glasses of water were poured into jug B. Accordingly, in which jug is the orange juice fresher? Explain.