Analytical Techniques for Identification and Quantification
of Polycyclic Aromatic Hydrocarbons
Hiba Abdalla Mahgoub
Department of Chemistry, Al-Baha University, SAUDI ARABIA.
email: [email protected].
(Received on: January 2, 2016)
ABSTRACT
Several analytical techniques have been developed and applied for identification and quantification of polycyclic aromatic hydrocarbons (PAHs) present in different samples. These analytical techniques include gas chromatography coupled with flame ionization detectior (GC/FID), gas chromatography coupled with a mass spectrometry (GC/MS), high performance liquid chromatography (HPLC) coupled with an ultraviolet or fluorescence detector, and thin-layer chromatography (TLC) with fluorescence detection. Since sensitive analytical techniques were essential in the determination of the presence and levels of these toxic compounds, some aspects of standard preparation and suitable instrumental condition for quantification of the sixteen PAHs listed by the U.S. environmental protection agency (EPA) have been reviewed in this article. The quantification performance of each technique has been comparable for different samples matrix.
Keywords: Polycyclic aromatic hydrocarbons PAHs, GC/MS, HPLC, standard
preparation, quantification.
1. INTRODUCTION
Polycyclic aromatic hydrocarbons (PAHs) are some of widespread organic pollutants in the environment. PAHs originate from both natural and anthropogenic sources. Natural sources include forest fires1,2, post depositional transformations of biogenic precursors and
natural petroleum seeps3,4. Anthropogenic sources include combustion of fossil fuels, urban
runoff and release of petroleum products5. Exposure to PAHs can occur from different sources
such as water, food and air6-9. Due to the adverse health effect of PAHs to human health,
priority pollutant list of European community (EC) and EPA due to their carcinogenic properties (fig. 1). Among these benzo(a)pyrene and dibenzo (a,h) anthracene were reported to be the most carcinogenic11.
Different analytical techniques have been developed and applied for determination and quantification of PAHs present in different samples. The aim of this article was to review some aspects of standard preparation and suitable instrumental condition for quantification of the 16 PAHs listed by the U.S. EPA.
2. PREPARATION OF STANDARD SOLUTIONS
Quantification of PAHs should be carried out using calibration solutions prepared from certified PAHs. A number of chemical suppliers have PAHs standard such as Sigma Aldrich, Supelco and Alfa Aesar. A purity of 100% of PAHs reference material was desirable. The following are the standard needed for quantification:
Calibration standard
Instrument used should be calibrated for targeting analyte. In this case a mixture of 16 PAHs of known concentration was required and calibration solutions should be prepared at five concentration varying from least to most concentrated by diluting commercially available PAHs certified solutions. These calibration solutions will be used to plot a calibration curve for each PAH.
Surrogate standard
The surrogate standard solution also called recovery standard should be prepared from aliquots of pure compounds that are diluted with solvent such as dichloromethane to a known concentration. The surrogate compounds evaluate sample matrix effects and analytical efficiencies associated with sample preparation and analysis. The surrogate standard solution includes naphthalene-d8, acenaphthalene-d10, phenanthrene-d10, chrysene-d12 and perylene-d12.
Surrogate standard solution should be added to all samples and all quality control samples prior to extraction. Individual surrogate recoveries can used to correct specific analyte concentrations based on retention time.
Internal standard
Internal standard also called reference standard, a known amount of internal standard should be added to all samples just prior to instrument analysis. PAHs peaks will be quantified relative to the internal standard peak. Internal standards are used to calculate relative response factors and specific analyte concentration. The most important properties of internal standard are:
It must behave very similar to the analyte.
It must not be found in the sample itself.
Deuterated PAHs internal standard solutions include naphthalene-d8,
acenaphthylene-d10, phenanthrene-d10, crysene-d12, perylene-d12, fluorene-d10, pyrene-d10, and
benzo[a]pyrene-d12. All PAHs standard solutions should be stored in amber glass ware with teflon lined closure
in the dark due to potential degradation of PAHs by UV light. Room temperature (about 20°C) is recommended for storage of PAHs standard solutions by a number of suppliers.
Figure 1: Chemical structure of the 16 PAHs listed in U.S EPA priority pollutants
Naphthalene Acenaphthylene
Acenaphthene Fluorene
Phenanthrene Anthracene Fluoranthene
Pyrene
Benzo(a)anthracene Chrysene Benzo(b)fluoranthene
Benzo(k)fluoranthene Benzo(a)pyrene
Dibenzo(a,h)anthracene
3. INSTRUMENTAL ANALYSIS
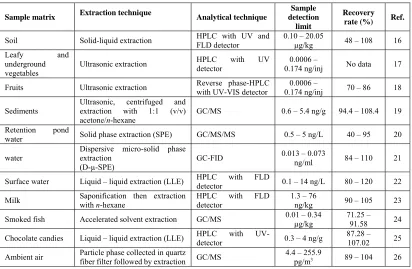
Several analytical techniques have been used to determine the concentration of PAHs in different samples matrix (table 1). Those include Gas chromatography coupled with flame ionization detectior (GC/FID), Gas chromatography coupled with a mass spectrometry (GC/MS), high performance liquid chromatography (HPLC) coupled with an ultraviolet or fluorescence detector, and thin-layer chromatography (TLC) with fluorescence detection. Both GC/MS and HPLC methods are considered to be valid for analysis of PAHs according to U.S. EPA, though GC/MS is a widely used method12. The EPA methods of PAHs determination
include13,14:
EPA 8100 GC packed and capillary column with FID (flame ionization detector)
EPA 8310 HPLC reverse phase with UV/fluorescence detectors.
EPA 8270 GC/MS
EPA 8275 thermal extraction-GC/MS
EPA 8410 GC, capillary column FT-IR
High performance liquid chromatography (HPLC)
For proper separation of PAHs by HPLC, minimum requirements should be achieved and those include: binary gradient, 50% valley for measuring concentrations with the peak height and solvents must be degassed in order to allow proper operation of the high pressure pump15. In one of the applied HPLC condition for quantitative and qualitative analysis of
PAHs, for the separation of the individual PAHs the reversed phase HPLC system was prepared, the column (150 mm 5 μm HPLC) filled with C18 silica gel. The temperature of the column during the analysis was 30°C. Elution was conducted by using a gradient technique with three solvents: water - A, acetonitrile - B and methanol - C (start 0 min - 20/20/60 Av/Bv/ Cv; 20 min - 5/95/0 Av/Bv/Cv). The flow rate was 0.80 ml/min. The loop volume was 10 μl16.
The following formula can be used to calculate PAHs concentration17:
Gas chromatography/Mass spectrometry
A GC/MS in selected ion mode (SIM) coupled to a capillary column can be used for detection and quantification of PAHs. Samples can be injected into a temperature programmed operated in splitless mode. A wide range of non-polar or slightly polar stationary phases can be used for the separation of PAHs, e.g., phenyl-substituted methyl polysiloxane phase15. In
line and ion source temperatures were 280 °C and 200 °C. The column temperature was initially held at 40 °C for 1 min, raised to 120 °C at the rate of 25 °C/min, then to 160 °C at the rate of 10 °C/min, and finally to 300 °C at the rate of 5 °C/min, held at final temperature for 15 min. Detector temperature was kept at 280 °C. Helium was used as a carrier gas at a constant flow rate of 1 mL/min. Mass spectrometry was acquired using the electron ionization (EI) and selective ion monitoring (SIM) modes19. Table 2 present molecular mass and ions
selected for PAHs monitoring under the specified GC/MS conditions. For quantification of PAHs, the following point should be applied:
A 5-point relative response factor (RRF) calibration curve should be established for analytes of interest prior to the analysis of samples and quality control samples. A RRF is determined, for each analyte, for each calibration level using the following equation: RRF = (Aa)(Cis) / (Ais)(Ca)
Where:
Aa = the area of the analyte to be measured
Ais = the area of the specific internal standard
Ca = the known concentration of the analyte in the calibration solution (µg/mL)
Cis = the know concentration of the internal standard in the calibration solution (µg /mg)
The response factors determined for each calibration level are must average to produce a mean relative response factor (RRF) for each analyte. Then the mass (Ma) of each target
analyte will be calculated using the formula:
Ma= AaMis / AisRRF
Where:
Aa = the area of the analyte measured
Ais = the area of the specific internal standard
Mis = mass of internal standard added to the extract
RRF = the average relative response factor for the analyte
The concentration (C) of each target analyte in a sample will be calculated using the following formula:
C = MaDf/W
Where:
Table 1: Analytical techniques used for determination of PAHs from different sample matrix
Sample matrix Extraction technique Analytical technique
Sample detection
limit
Recovery
rate (%) Ref.
Soil Solid-liquid extraction HPLC with UV and FLD detector 0.10 – 20.05 µg/kg 48 – 108 16
Leafy and underground
vegetables Ultrasonic extraction
HPLC with UV detector
0.0006 –
0.174 ng/inj No data 17
Fruits Ultrasonic extraction Reverse phase-HPLC with UV-VIS detector 0.174 ng/inj 0.0006 – 70 – 86 18
Sediments
Ultrasonic, centrifuged and extraction with 1:1 (v/v) acetone/n-hexane
GC/MS 0.6 – 5.4 ng/g 94.4 – 108.4 19
Retention pond
water Solid phase extraction (SPE) GC/MS/MS 0.5 – 5 ng/L 40 – 95 20
water
Dispersive micro-solid phase extraction
(D-µ-SPE) GC-FID
0.013 – 0.073
ng/ml 84 – 110 21
Surface water Liquid – liquid extraction (LLE) HPLC with FLD detector 0.1 – 14 ng/L 80 – 120 22
Milk Saponification then extraction with n-hexane HPLC with FLD detector 1.3 – 76 ng/kg 90 – 105 23
Smoked fish Accelerated solvent extraction GC/MS 0.01 – 0.34 µg/kg 71.25 – 91.58 24
Chocolate candies Liquid – liquid extraction (LLE) HPLC with UV-detector 0.3 – 4 ng/g 87.28 – 107.02 25
Ambient air Particle phase collected in quartz fiber filter followed by extraction GC/MS 4.4 – 255.9 pg/m3 89 – 104 26
Table 2: Polycyclic aromatic hydrocarbons, molecular mass and corresponding ions
Compound Molecular mass Ions
Naphthalene 128 128, 129, 127 Acenaphthylene 152 151, 152, 153 Acenaphthene 154 154, 153, 152 Fluorene 166 166, 165, 167 Phenanthrene 178 178, 179, 176 Anthracene 178 178, 167, 179 Fluoranthene 202 202, 203 Pyrene 202 202, 200, 203 Benzo(a)anthracene 228 228, 229 Chrysene 228 228, 226 Benzo(b)fluoranthene 252 252, 253 Benzo(k)fluoranthene 252 252, 253 Benzo(a)pyrene 252 252, 253 Indeno(1,2,3-cd)pyrene 276 276, 277 Dibenzo(a,h)anthracene 278 278, 279 Benzo(g,h,i)perylene 276 276, 277
4. CONCLUSION
detection, Gas chromatography coupled with a mass spectrometry, high performance liquid chromatography coupled with an ultraviolet or fluorescence detector, and thin-layer chromatography with fluorescence detection. Both GC/MS and HPLC methods are considered to be valid for analysis of PAHs. Some aspects of standard preparation and suitable instrumental condition suitable for quantification of the sixteen PAHs listed by the U.S. EPA have been reviewed in this article since sensitive analytical technique was essential in the determination of the presence and levels of these toxic compounds.
REFERENCES
1. Fine, P. M.; Cass, G. R.; Simoneit, B. R. T., Chemical characterization of fine particle emissions from fireplace combustion of woods grown in the northeastern U.S. Environ.
Sci. Technol., 35, 2665–2675 (2001).
2. Schauer, J. J.; Kleeman, M. J.; Cass, G. R.; Simoneit, B. R. T., Measurement of emissions from air pollution sources. C1–C29 organic compounds from fireplace combustion of wood. Environ. Sci. Technol., 35, 1716–1728 (2001).
3. Wakeham SG, Schaffner C, Giger W., Polycyclic aromatic hydrocarbons in recent lake sediment. Geochimica Cosmochimica Acta., 44, 403-413 (1980).
4. Lopez-Avila V, Young R, Benedicto J, Ho P, Kim R, Beckert WF. Extraction of organic pollutants from solid samples using microwave energy. Anal. Chem., 67,2096-2102 (1995). 5. Kowalewska, G., Konat, J., Distribution of polynuclear aromatic hydrocarbons (PAHs) in
sediments of the southern Baltic Sea. Oceanologia, 83–104 (1997).
6. Hiba, A. M., Nimir A. S., and Tawfeeg, E. M., Identification of polycyclic aromatic hydrocarbons emissions from Oud Incense – Al – Baha City Southwest Saudi Arabia.
International Journal of Chemical Science and Research, 5 (6), 12 – 22 (2015).
7. Hiba, A. M., and Nimir A. S., Identification of polycyclic aromatic hydrocarbons emissions from wood of aromatic plants (Dokhan Incense) used in Sudan. Journal of
Chemistry and Chemical Sciences, 5(10), 575-584 (2015).
8. Hiba, A., M., Polycyclic aromatic hydrocarbons in food samples: methods of extraction, a review. International Journal of Current Research, 7(12), 23603-23606 (2015).
9. Hiba, A., M., Extraction techniques for determination of polycyclic aromatic hydrocarbons in water samples. International Journal of Science and Research, 5(1), 268-272 (2015). 10. ATSDR, agency for toxic substances and disease registry, Toxicological profile for
polycyclic aromatic hydrocarbons. Atlanta, GA, USA (2006).
11. IARC, Overall evaluation of carcinogenicity: an updating of IARC monograph. Lyon
International Agency for Research on Cancer, 42, 403 (1987).
12. Disdier, B., Arfi, C., Pastor, J., Pauli, A. M., and Portugal, H., Analysis by GC-MS of monocyclic and polycyclic aromatic hydrocarbons in thermolysed waste products.
Analusis, 27, 235-241 (1999).
13. EPA. Test methods for evaluating solid waste. EPA publication SW-846 (revision 6). U.S. environmental protection agency, Washington, DC. available on-line at:
14. EPA. Provisional guidance for quantitative risk assessment of polycyclic aromatic hydrocarbons. EPA 600/R-93/089. U.S. environmental protection agency, Washington, DC (1993).
15. Khan, Z., Troquet, J., and Vachelard, C., Sample preparation and analytical techniques for determination of polyaromatic hydrocarbons in soils. Int. J. Environ. Sci. Tech., 2(3), 275-286 (2005).
16. Dariusz, W., and Marzena, S., Evaluation of extraction methods of polycyclic aromatic hydrocarbons (PAHs) from soil and sewage sludge matrix. Inżynieria i Ochrona
Srodowiska, 17(4), 689-702 (2014).
17. Tuteja, G., Rout, C., and Bishnoi, N. R., Quantification of polycyclic aromatic hydrocarbons in leafy and underground vegetables: a case study around Panipat city, Haryana, India. Journal of Environmental Science and Technology, 4(6), 611-620 (2011). 18. Narsi, R. B., Urvashi, M., and Pandit, G., Quantification of polycyclic aromatic hydrocarbons in fruits and vegetables using high performance liquid chromatography.
Indian Journal of Chemical Technology, 13, 30-35 (2006).
19. Cheng, D., Chih, F., and Chiu, C., (2012). Determination of polycyclic aromatic hydrocarbons in industrial harbor sediments by GC-MS. Int. J. Environ. Res. Public
Health, 9, 2175-2188.
20. Poulain M, Geffroy Rodier C, Canaff C, Ruban V and Ambles A., Quantification of polynuclear aromatic hydrocarbons in retention pond waters using gas chromatography-tandem mass spectrometry. Austin Chromatogr. 1(3), 6 (2014)..
21. Abdulmumin A. N., Chanbasha B., Amjad A.S., and Abdul Rahman A., Determination of polycyclic aromatic hydrocarbons in water using nanoporous material prepared from waste avian egg shell. Journal of Nanomaterials, article ID 305691 (2012).
22. Manoli, E., Samara, C., Konstantinou, I. , Albanis, T., Polycyclic aromatic hydrocarbons in the bulk precipitation and surface waters of Northern Greece. Chemosphere, 41, 1845-1855 (2000).
23. Kishikawa, N., Wada, M., Kuroda, N., Akiyama, S., and Nakashima, K., Determination of polycyclic aromatic hydrocarbons in milk samples by high-performance liquid chromatography with fluorescence detection. J. Chromatography B, 789, 257- 264 (2003). 24. Ajai A. I., Suleiman M.T., Dauda B.E., Sadiku O.S., and Aberuagba, F., Effect of
extraction methods on the polycyclic aromatic hydrocarbons content smoked catfish species in Niger state of Nigeria. Jordan Journal of Biological Sciences, 5(1), 71-78 (2012). 25. Rupender K., Prashant C., Nasreen G., Ansari, R., Murthy, C., and Devendra K. P.,