doi: 10.4114/ia.v18i55.1098
ISSN: 1988-3064(on-line) ©IBERAMIA and the authors
INTELIGENCIA ARTIFICIAL
http://journal.iberamia.org/
Comparative Study of Clustering Algorithms using OverallSimSUX
Similarity Function for XML Documents
Damny Magdaleno, Yadriel Miranda, Ivett E. Fuentes, María M. García
Computer Science Department, Universidad Central “Marta Abreu” de Las Villas.
Carretera a Camajuaní, KM 5 ½, C.P. 54830, Santa Clara, Villa Clara, Cuba.
[email protected]; [email protected]; [email protected]; [email protected]
Abstract A huge amount of information is represented in XML format. Several tools have been developed to store, and query XML data. It becomes inevitable to develop high performance techniques for efficiently analysing extremely large collections of XML data. One of the methods that many researchers have focused on is clustering, which groups similar XML data, according to their content and structures. In previous work, there has been proposed the similarity function OverallSimSUX, that facilitates to capture the degree of similitude among the documents with a novel methodology for clustering XML documents using both structural and content features. Although this methodology shows good performance, endorsed by experiments with several corpus and statistical tests, on having had impliedly only one clustering algorithm, K-Star, we do not know the effect that it would suffer if we replaced this algorithm by other with dissimilar characteristics. Therefore to endorse completely the methodology, in this work we make a comparative study of the effects of applying the methodology for the OverallSimSUX similarity function calculation, using clustering algorithms of different classifications. Based on our analysis, we arrived to two important results: (1) The Fuzzy-SKWIC clustering algorithm works best both with methodology and without methodology, although there are not present significant differences respect to the K-Star and G-Star clustering algorithms, according to conclusions achieved by Nemenyi's post-hoc test.; (2) For each analysed algorithm when using the methodology, we obtain better results than when it is not taken into account.
Resumen Gran cantidad de información está almacenada en formato XML; varias herramientas se han desarrollado para almacenar y consultar datos en XML. Se hace inevitable crear técnicas para el análisis eficiente de grandes colecciones de estos documentos. Uno de los métodos en que los investigadores se han centrado es en el agrupamiento, basado en la estructura y contenido de los XML. En un trabajo anterior fue propuesta la función de similitud OverallSimSUX, que captura el grado de semejanza entre los documentos, utilizada con una nueva metodología para el agrupamiento de documentos XML utilizando estructura y contenido simultáneamente. Aunque esta metodología mostró buen desempeño, avalado por los experimentos con varios corpus y test estadísticos, al tener implícito un algoritmo de agrupamiento, K-Star; se desconoce el efecto que podría sufrir si se reemplaza este algoritmo por otro con diferentes características. Por tanto para avalar completamente la metodología, en este trabajo se realiza un estudio comparativo de los efectos de aplicar la metodología para el cálculo de la función de similitud OverallSimSUX, usando algoritmos de agrupamiento de diferentes clasificaciones. Basado en el análisis realizado, se arribaron a dos resultados importantes: (1) El algoritmo de agrupamiento Fuzzy-SKWIC obtuvo mejores resultados cuando es usado con la metodología al igual que cuando no es usado con esta, aunque no presenta diferencias significativas respecto a los algoritmos K-Star y G-Star, según el test de Nemenyi; (2) Para cada algoritmo analizado, cuando se utiliza la metodología, se obtienen mejores resultados que cuando no se utiliza la metodología.
Keywords: Comparative study, Clustering, XML.
1
Introduction
XML [1] has been introduced by W3C in 1998 in order to eliminate the complexity of using SGML. A XML document is a structure hierarchical auto-descriptive of information in semi-structured format, since it incorporates structure and data in the same entity. This way, the structure of the documents can also be used to carry out recovery of relevant documents [2].Therefore, it has become standard for information representation and exchange on the Web and the Internet [3]. Consequently, a huge amount of information is represented in XML and several tools have been developed to store and query XML data [4, 5].
It becomes inevitable to develop high performance techniques for efficiently managing and analysing extremely large collections of XML data [6].One of the methods that many researchers have focused on is clustering, which groups similar XML data according to their content and structures. The clustering process of XML data plays a crucial role in many data application domains [6], such as information retrieval, data integration, document classification, Web mining, and query processing.
A clustering algorithm tries to find natural clusters of data based mainly on the similarity, so it is desirable that the objects that belong to the same cluster can be as similar as possible and the objects that belong to different clusters can be so more dissimilar [7].
The XML document clustering is a challenging task because it involves content as well as structure information [8]. There are some methods for XML documents that use the structural features [9, 10], the content features [11] or both structural and content features [12, 13] for clustering similar documents.
In previous work [14], a novel methodology for clustering XML documents using both structural and content features has been proposed. The similarity function OverallSimSUX, that facilitates to capture the degree of similitude among the documents, was proposed too in this work. Although this methodology shows good performance, endorsed by experiments with several corpus and statistical tests, on having had impliedly only one clustering algorithm, K-Star [15] we do not know the effect that it would suffer if we replaced this algorithm by other with dissimilar characteristics. Nevertheless to endorse completely the methodology, it is necessary to prove it with other clustering algorithms of diverse classifications.
In this work we make a comparative study of the effects of applying the methodology for the OverallSimSUX similarity function calculation, using clustering algorithms of different classifications. The paper is organized as follows: In section 2 there are described forms of clustering following different classifications; in section 3 we made a brief description about selected clustering algorithms to compare; in section 4 we talk about the methodology for computing OverallSimSUX similarity function; in section 5 the experimental results are analysed and finally, in section 6 the conclusions are presented.
2
Cluster Algorithms
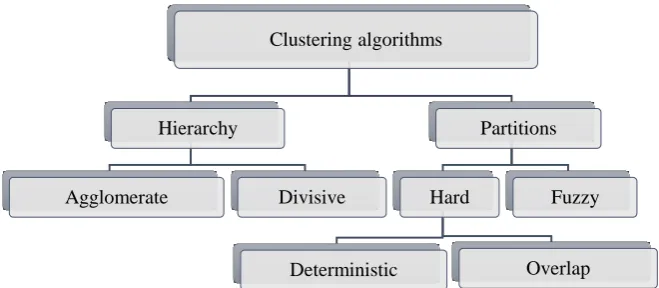
Clustering methods are usually classified with respect to their underlying algorithmic approaches. A great variety of clustering algorithms for making groups’ analysis has been proposed. These algorithms can be classified of diverse forms: input type, criteria to define the similarity between the objects, concepts on which the analysis is based, forms of representation of the information, and others. In general, in this classification two types differ: those that form divisions and the hierarchic ones. Figure 1 shows clustering algorithms’ taxonomy bearing in mind this classification.
Figure 1. Clustering algorithms taxonomy Clustering algorithms
Hierarchy
Agglomerate Divisive
Partitions
Hard
Deterministic Overlap
Hierarchical algorithms find successive clusters using previously established ones, whereas partition algorithms determine all clusters at once. Hierarchical algorithms can be agglomerative or divisive; agglomerative algorithms begin with each element as a separate cluster and merge the obtained clusters into successively larger clusters. Divisive algorithms begin with the whole set and proceed to divide it into successively smaller clusters. Iterative algorithms start with some initial clusters (their number either being unknown in advance or given a priori) and intend to successively improve the existing cluster set by changing their “representatives” (“centers of gravity” or “centroids”), like in K-Means [16] or by iterative node-exchanging (like in [17]).
The goal of the methods that make partitions is to find the best data partition in k clusters (𝑘 ∈ ℕ, 𝑘 > 0). These methods use a similarity function. The majority of the algorithms that follow this approach are essentially based on prototypes [7].
Algorithms that belong to this taxonomy are k-means [18], widely used. PAM (Partitioning Around Medoids) is other algorithm [19], its objective is to find a representative object for each cluster. K-Mode and K-prototypes [20] are based in K-means. Other technique is SKWIC, “Simultaneous Keyword Identification and Clustering of text documents”, conceptually and computationally simple, and it offers several advantages [21].
Other classification, not mutually exclusive to the already presented one, considers the way of manipulating the uncertainty in cluster overlapped terms: hard and fuzzy clustering [22]. The fuzzy clustering is subdivided into probabilistic and possibilistic [7]. Among these techniques [23] proposed a change to the classic fuzzy c-means, which is a new strategy for selecting the initial centers of cluster.
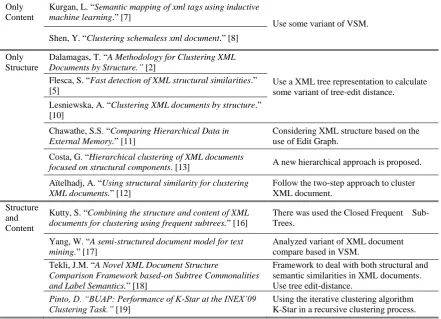
Being the XML documents semi-structured, there are three forms of computing the distances or similarities of these: (1) only considering the content of the documents; (2) considering only the structure; and (3) the clustering that considers these two dimensions of the documents XML (structure and content). Figure 2 shows a summary of some XML cluster algorithms.
Only Content
Kurgan, L.“Semantic mapping of xml tags using inductive machine learning.” [7]
Use some variant of VSM.
Shen, Y.“Clustering schemaless xml document.” [8]
Only Structure
Dalamagas, T.“A Methodology for Clustering XML Documents by Structure.” [2]
Use a XML tree representation to calculate some variant of tree-edit distance. Flesca, S.“Fast detection of XML structural similarities.”
[5]
Lesniewska, A.“Clustering XML documents by structure.” [10]
Chawathe, S.S.“Comparing Hierarchical Data in External Memory.” [11]
Considering XML structure based on the use of Edit Graph.
Costa, G.“Hierarchical clustering of XML documents
focused on structural components. [13] A new hierarchical approach is proposed.
Aïtelhadj, A.“Using structural similarity for clustering XML documents.” [12]
Follow the two-step approach to cluster XML document.
Structure and Content
Kutty, S.“Combining the structure and content of XML documents for clustering using frequent subtrees.” [16]
There was used the Closed Frequent Sub-Trees.
Yang, W.“A semi-structured document model for text mining.” [17]
Analyzed variant of XML document compare based in VSM.
Tekli, J.M.“A Novel XML Document Structure
Comparison Framework based-on Subtree Commonalities and Label Semantics.” [18]
Framework to deal with both structural and semantic similarities in XML documents. Use tree edit-distance.
Pinto, D. “BUAP: Performance of K-Star at the INEX’09 Clustering Task.” [19]
Using the iterative clustering algorithm K-Star in a recursive clustering process.
Figure 2. Summary of XML cluster algorithms1
1 14. Magdaleno, D., I.E. Fuentes, and M.M. García, Clustering XML Documents using Structure and Content
3
Selected Algorithms
To make the comparative study we select four cluster algorithms with different features, (1) K-Star, agglomerative; (2) Generalized Star (G-Star), based in graphs; (3) Simultaneous Keyword Identification and Clustering of text documents (SKWIC), hard and deterministic partitions; (4) Fuzzy SKWIC, fuzzy partitions. The next sections show a brief background about these algorithms.
3.1
K
-Star
K-Star is a hierarchical agglomerative clustering method which automatically reveals the number of clusters, unknown in advance [13]. As most of the clustering methods, it requires a similarity matrix of the documents to be clustered (corpus). K-Star clustering approach can be explained as below.
1. It looks for the maximum value in the similarity matrix 𝜑(𝑑𝑖, 𝑑𝑗), and constructs a cluster (Ci) made up of the two documents this similarity value refers to. It marks these documents (di and dj) as assigned.
2. For each unassigned document (dk)
-
If 𝜑(𝑑𝑖, 𝑑𝑗) > 𝜏, where 𝜏 is a given threshold, then add dk to cluster Ci and mark dk as assigned. 3. Return to Step 1In [13] is presented the entire pseudo source of this algorithm.
3.2
G-Star
The Generalized Star (G-Star) algorithm was proposed in [24] following the Aslam approach [23]. G-Star defines a set group for each graph vertex, professed WeakSats and PotSats. The basic steps of this algorithm are:
1. To build the graph Gβ for collection representation.
2. To build de list L with all graph vertex, with this list realize an iterative process for chose the vertex v with
PotSats biggestdegree in L.
- Add this vertex to X.
- Update adjacent vertex.
- Delete v from L
3. Repeat step 2 until L is empty.
4. Sort vertex in X, taking into account PotSat degree.
In [25] is presented the entire pseudo source of this algorithm and an extensive analysis.
3.3
SKWIC
The SKWIC algorithm is an extension of SCAD algorithm to simultaneous text document clustering and dynamic category dependent keyword set weighting. SKWIC is both conceptually and computationally simple, and offers advantages compared to existing document clustering techniques [26].
SKWIC clustering approach can be explained as below.
1. To fix the number of clusters C and initialize the centers by randomly selecting C documents. 2. To initialize the partitions.
3. To update the relevance weights.
4. To calculate the distance from documents to the cluster’s center and assign each document to the cluster. 5. To update the cluster’s center.
6. To return Step 3 until the center is stabilized.
This algorithm needs to know the cluster number to be created. In [26] is presented the entire pseudo source of this algorithm and an extensive analysis.
3.4
Fuzzy SKWIC
Fuzzy-SKWIC (F-SKWIC) was designed to search for the optimal cluster center, the optimal soft partitioning memberships and the optimal set of feature weights, simultaneously [26].
2 To calculate the term relevance; the distance of the document to each cluster’s center. 3 To update document membership to each cluster;
4 To recalculate cluster’s center and update the center. 5 To return Step 2 until the center is stabilized.
This algorithm needs to know the cluster number to be created. In [26] is presented the entire pseudo source of this algorithm and an extensive analysis.
4
OverallSimSUX Based Methodology
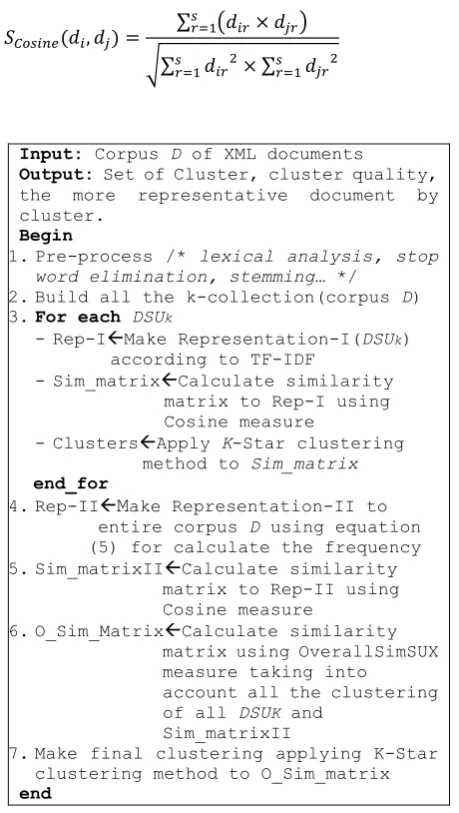
The methodology for clustering XML documents proposed in [14] computes a final similarity matrix based in the OverallSimSUX similarity function. For the matrix calculations is necessary: (1) to make two different representation to corpus, (2) a matrix of similarity is calculated, which compares two documents using the Cosine measure [27]; this is shown in the equation 1, (3) finally an intermediate clustering is realized. The general procedure of this methodology is shown in figure 3.
𝑆𝐶𝑜𝑠𝑖𝑛𝑒(𝑑𝑖, 𝑑𝑗) =
∑𝑠𝑟=1(𝑑𝑖𝑟× 𝑑𝑗𝑟)
√∑𝑠𝑟=1𝑑𝑖𝑟2× ∑𝑠𝑟=1𝑑𝑗𝑟2
(1)
Input: Corpus D of XML documents
Output: Set of Cluster, cluster quality, the more representative document by cluster.
Begin
1.Pre-process /* lexical analysis, stop
word elimination, stemming… */
2.Build all the k-collection(corpus D) 3.For each DSUk
- Rep-IMake Representation-I(DSUk) according to TF-IDF
- Sim_matrixCalculate similarity matrix to Rep-I using Cosine measure
- ClustersApply K-Star clustering method to Sim_matrix
end_for
4.Rep-IIMake Representation-II to entire corpus D using equation (5) for calculate the frequency 5.Sim_matrixIICalculate similarity
matrix to Rep-II using Cosine measure
6.O_Sim_MatrixCalculate similarity matrix using OverallSimSUX measure taking into
account all the clustering of all DSUK and
Sim_matrixII
7.Make final clustering applying K-Star clustering method to O_Sim_matrix
end
Figure 3. General procedure of XML clustering methodology with OverallSimSUX similarity2
5
Experimental Setup
To make the comparative study three experiments have been designed, applied to three data sets, with the purpose of carrying out a statistical analysis that allows showing the result of both, the selected algorithms without using the methodology and the selected algorithms using the methodology. All approaches were implemented in a system for clustering scientific papers in XML format (LucXML).
To evaluate the results we implemented the external measure Overall F-measure [28] for showing the quality of the groups obtained in each clustering.
OverallF-measure measure is based in Precision (Pr) and Recall (Re) measure [29]. The Pr and Re are calculate for a cluster g and a class c as follows.
𝑃𝑟(𝑐, 𝑔) =𝑛𝑐𝑔
𝑛𝑔 (2)
𝑅𝑒(𝑐, 𝑔) =𝑛𝑐𝑔
𝑛𝑐 (3)
Where ncg is the objects’ number of the class c in the cluster g, ng is objects’ number of the cluster g and nc is the objects’ number of the class c. With this value the F-measure is calculated and the harmonic means of Pr and
Re are obtained, as shown in expression 4.
𝐹𝑀(𝑐, 𝑔) = 1
𝛼 (𝑃𝑟(𝑐, 𝑔))1 (1 − 𝛼) (𝑅𝑒(𝑐, 𝑔))1 (4)
If = 1 then FM(c,g) coincide with Pr value, else if = 0 then FM(c,g) coincide with Re value. So, = 0.5 means equal weight for Pr and Re. Finally Overall F-measure (OFM) is calculated using expression 5.
𝑂𝐹𝑀 = ∑𝑛𝑐 𝑛 𝑘
𝑖=1
𝑚𝑎𝑥{𝐹𝑀(𝑐, 𝑔)} (5)
5.1
Case Study
- Case study 1: Documents recovered from the site of ICTs of the Center of Studies on Informatics of the Universidad Central ”Marta Abreu” de las Villas (UCLV). http://ict.cei.uclv.edu.cu.
- Case study 2: Summary of documents of the IDE-Alliance repository. Provided by the University of Granada, Spain.
- Case study 3: Summary of documents of the collection of the Wikipedia, published by the “Initiative for the Evaluation of XML Retrieval”, INEX’09, to evaluate clustering. http://www.inex.otago.ac.nz
We conform 16 XML documents corpora. Corpus 1 to 7 with documents from case study 1, the average size of each corpus is 1’000 documents; corpus 8 to 11 with documents from case study 2, the average size of each corpus is 5’000 documents; the rest of the corpora are the case study 3, the average size of each corpus corresponding to last case study 3 is 10’000 documents. Each corpus are independent. Figure 4 shows a fragment of XML document corresponding to corpus 9 of case study 2. We not take into account the class label in the cluster process, this is used only for the results’ evaluation.
5.2
Experiments’ Results and Analysis
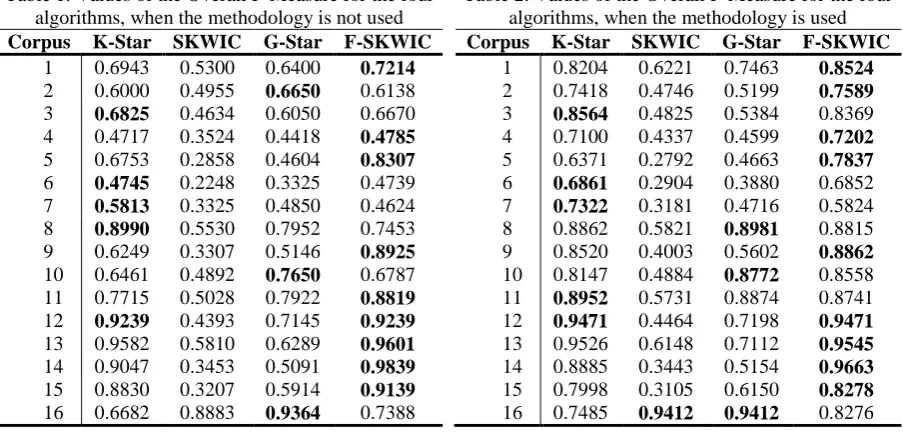
The first experiment consisted on verifying how it behaves globally, on the three data sets described previously, the four algorithm selected without using the methodology for OverallSimSUX calculation. Table 1 shows this result.
In the second experiment it is verified how they behave globally, on the 16 corpus, the four algorithms selected using the methodology for OverallSimSUX calculation. The experiments’ results are shown in Table 2.
Both in the first one and in the second experiment, the results were similar. The best results were achieved by the F-SKWIC algorithm that obtained better or equal results than other algorithms in the 56.25% of the cases in both experiments. The second better algorithm in both experiments was K-Star algorithm, with better or equal result than other algorithms in the 31.25% of the cases. Following this analysis idea, the results achieved in both experiments coincided with 12 of 16 corpus.
<?xml version="1.0" encoding="utf-8"?> <paper>
<class>0</class> <front>
<title>Maximum Weight Matching via Max-Product Belief Propagation </title>
<conference/>
<authors>
<author>
<fname>Bayati</fname>
<surname>Mohsen<surname/>
…
</author>
… </authors>
<keywords>
<keyword>belief propagation <keyword/> …
</keywords>
<abstract>
<para>The max-product "belief propagation" algorithm is an iterative, local, message passing algorithm finding the …
</para>
</abstract> </front> <body>
<section>
<title>Introduction</title>
<para>I. INTRODUCTION Graphical models (GM) are a powerful method representing and manipulating joint probability distributions. …
…
</paper>
Figure 4. Fragment of XML document used in the experiment. Table 1. Values of the Overall F-Measure for the four
algorithms, when the methodology is not used Corpus K-Star SKWIC G-Star F-SKWIC
1 0.6943 0.5300 0.6400 0.7214 2 0.6000 0.4955 0.6650 0.6138 3 0.6825 0.4634 0.6050 0.6670 4 0.4717 0.3524 0.4418 0.4785 5 0.6753 0.2858 0.4604 0.8307 6 0.4745 0.2248 0.3325 0.4739 7 0.5813 0.3325 0.4850 0.4624 8 0.8990 0.5530 0.7952 0.7453 9 0.6249 0.3307 0.5146 0.8925 10 0.6461 0.4892 0.7650 0.6787 11 0.7715 0.5028 0.7922 0.8819 12 0.9239 0.4393 0.7145 0.9239 13 0.9582 0.5810 0.6289 0.9601 14 0.9047 0.3453 0.5091 0.9839 15 0.8830 0.3207 0.5914 0.9139 16 0.6682 0.8883 0.9364 0.7388
Table 2. Values of the Overall F-Measure for the four algorithms, when the methodology is used Corpus K-Star SKWIC G-Star F-SKWIC
Figure 5. Comparison pairwise formed by the result of the same algorithm, using the methodology and without using the methodology
(a) (b)
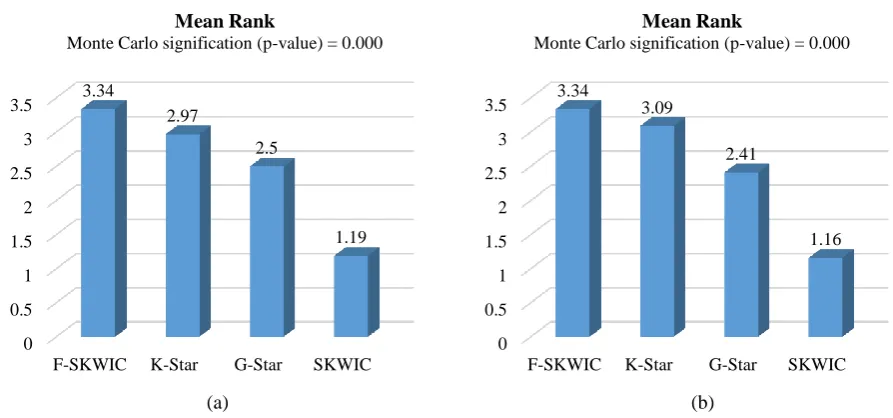
Figure 6. Mean rank achieved by the Friedman’s test for (a) algorithms without using the methodology, (b) algorithms with using the methodology
In order to prove this, for both experiments we computed the Friedman’s test (Friedman’s two-way analysis of variances by ranks) [30]. This test is a multiple comparison procedure capable to detect significant differences between the behaviours of two or more algorithms; i.e., it can be used for discovering whether at least two of the
0.00 0.20 0.40 0.60 0.80 1.00
1 2 3 4 5 6 7 8 9 10 11 12 13 14 15 16
K-Star OFM results
K-Star Without Method. K-Star With Method.
0.00 0.20 0.40 0.60 0.80 1.00
1 2 3 4 5 6 7 8 9 10 11 12 13 14 15 16
SKWIC OFM results
SKWIC Without Method. SKWIC With Method.
0.00 0.20 0.40 0.60 0.80 1.00
1 2 3 4 5 6 7 8 9 10 11 12 13 14 15 16
G-Star OFM results
G-Star Without Method. G-Star With Method.
0.00 0.20 0.40 0.60 0.80 1.00
1 2 3 4 5 6 7 8 9 10 11 12 13 14 15 16
F-KWIC OFM results
F-SKWIC Without Method. F-SKWIC With Method.
0 0.5 1 1.5 2 2.5 3 3.5
F-SKWIC K-Star G-Star SKWIC 3.34
2.97
2.5
1.19 Mean Rank
Monte Carlo signification (p-value) = 0.000
0 0.5 1 1.5 2 2.5 3 3.5
F-SKWIC K-Star G-Star SKWIC 3.34
3.09
2.41
1.16 Mean Rank
samples represent populations with different median values or not, in a set of n samples (n≥2). Figure 6 shown the
mean rank and the p-value associated to this test for each algorithm without methodology and with methodology respectively.
Using a significance level of 0.05, corresponding to the 95% confidence interval, the Friedman’s test (p-value<0.05) suggests rejecting the null hypothesis, thus, there exist highly significant differences between at least
two algorithms. Also, it can be observed that F-SKWIC and K-Star are best ranked; however, this information cannot be used to conclude that our proposals are involved in these differences; that is why we also applied the Nemenyi post-hoc test [31] after the Friedman test.
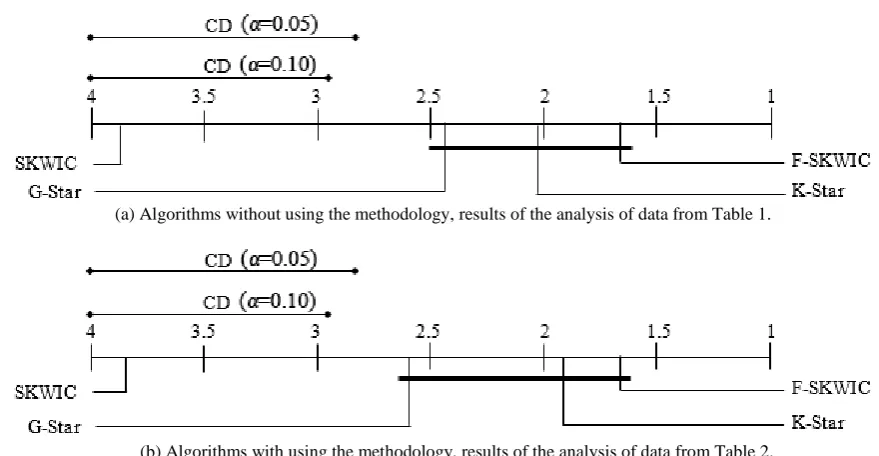
With Nemenyi, the performance of two classifiers is significantly different if the corresponding average ranks differ by at least the critical difference (CD) where critical values qα are based on the Studentized range statistic divided by √2 [32]. For 16 datasets and four algorithms, using α = 0.05 the CD value is 1.17, when α = 0.10 CD value is 1.04. The results of Nemenyi post-hoc tests is visually represented in the Figure 7, using both α = 0.05 and α = 0.10. The top lines in the diagrams corresponds to the CD values, in the axis we plot the average ranks of methods. The axis is turned so that the lowest (best) ranks are to the right since we perceive the methods on the right side as better [32].
(a) Algorithms without using the methodology, results of the analysis of data from Table 1.
(b) Algorithms with using the methodology, results of the analysis of data from Table 2.
Figure 7. Visualization of Nemenyi post-hoc tests using both α = 0.05 and α = 0.10. Groups of algorithms that are not significantly different are connected with bold line.
Using Keel software [33], we compute de p-value achieved on Nemenyi post-hoc comparisons for α = 0.05, α = 0.10. Table 3 and Table 4 shows these results.
Table 3. Results achieved on Nemenyi post hoc comparisons, when the methodology is not used
Pairwise comparisons (p-value)a,b F-SKWIC vs. SKWIC 0.000001 F-SKWIC vs. K-Star 0.411314 F-SKWIC vs. G-Star 0.086964 K-Star vs. SKWIC 0.000054 K-Star vs. G-Star 0.373439 G-Star vs. SKWIC 0.001636
Table 4. Results achieved on Nemenyi post hoc comparisons, when the methodology is used
These results statistically confirm that the better results in both experiments were achieved by F-SKWIC, although there are not present significant differences respect to the K-Star and G-Star clustering algorithms, for the analysed case studies.
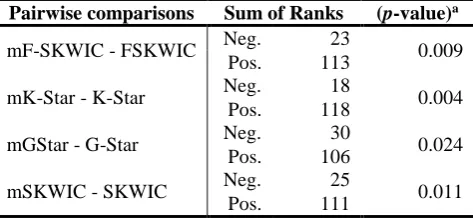
The non-parametric test of Wilcoxon was applied for the results of experiment 3, to check if there are significant differences between the pairwise results of the algorithms (when the methodology is used and when it is not) for checking if the studied algorithms achieved better results using the OverallSimSUX methodology. Table 5 shows the results of this test.
Table 5. Wilcoxon’s test statistics of pairwise comparison, when the methodology is used (i.e. mG-Star) and when is not (i.e G-Star)
Pairwise comparisons Sum of Ranks (p-value)a
mF-SKWIC - FSKWIC Neg. 23 0.009
Pos. 113
mK-Star - K-Star Neg. 18 0.004
Pos. 118
mGStar - G-Star Neg. 30 0.024
Pos. 106
mSKWIC - SKWIC Neg. 25 0.011
Pos. 111 aMonte Carlo signification
The Wilcoxon’s test suggests to reject the null hypothesis (p-value < 0.05) for all pairwise comparisons. These results statistically confirm that the four studied algorithms achieved better results using the methodology for
OverallSimSUX similarity calculation than without using this methodology, for the analysed case studies.
6
Conclusions
In this paper we have analysed the impact upon the methodology for clustering XML documents using OverallSimSUX similarity function of clustering algorithms of different classifications. From the above results, we can infer that for the analysed case study, Fuzzy-SKWIC clustering algorithm works best both, with methodology and without methodology, although there are not present significant differences respect to the K-Star and G-Star clustering algorithms, according to conclusions achieved by Nemenyi's post-hoc test. For each analysed algorithm and the cases study selected, when using the methodology we obtain better results than when it is not taken into account.
In the future, we hope to analyse impacts of other different clustering algorithms and to incorporate the study of effects of other popular similarity measures for documents clustering.
References
1. Brau, B., et al., Extensible Markup Language(XML) 1.0., in W3C Recommendation. 1998.
2. Guerrini, G., M. Mesiti, and I. Sanz, An Overview of Similarity Measures for Clustering XML Documents.
2006.
3. Wilde, E. and R.J. Glushko, XML fever. Comm. ACM, 2008. 51(7): p. 40-46. doi: 10.1145/1364782.1364795
4. Wang, G., et al., RPE query processing and optimization techniques for XML databases. J. Comput. Sci. Technol., 2004. 19(2): p. 224-237.
5. Bertino, E. and E. Ferrari, XML and data integration. IEEE Internet Comput., 2001. 5(6): p. 75-76. doi: 10.1109/4236.968835
6. Algergawy, A., et al., XML Data Clustering: An Overview, in ACM Computing Surveys. 2011. doi: 10.1145/1978802.1978804
7. Kruse, R., C. Döring, and M.-J. Lesor, Fundamentals of Fuzzy Clustering, in Advances in Fuzzy Clustering and its Applications, J.V.d. Oliveira and W. Pedrycz, Editors. 2007, John Wiley and Sons: Est Sussex, England. p. 3-27.
9. Yousuke, W., K. Hidetaka, and Y. Haruo, Similarity search for office XML documents based on style and structure data. International Journal of Web Information Systems., 2013. 9(2): p. 100-117. doi: 10.1108/IJWIS-03-20 13-0005
10. Costa, G., et al. Hierarchical clustering of XML documents focused on structural components. in Data & Knowledge Engineering. 2013. doi: 10.1016/j.datak.2012.12.002
11. Kurgan, L., W. Swiercz, and K.J. Cios. Semantic mapping of xml tags using inductive machine learning. in 11th International Conference on Information and Knowledge Management. 2002. Virginia, USA. 12. Tekli, J.M. and R. Chbeir, A Novel XML Document Structure Comparison Framework based-on Subtree
Commonalities and Label Semantics. Elsevier, 2011. 11(2011). doi: 10.1016/j.websem.2011.10.002 13. Pinto, D., M. Tovar, and D. Vilariño. BUAP: Performance of K-Star at the INEX’09 Clustering Task. in
INEX 2009 Workshop Pre-proceedings. 2009. Woodlands of Marburg, Ipswich, Queensland,Australia. doi: 10.1007/978-3-642-14556-8_43
14. Magdaleno, D., I.E. Fuentes, and M.M. García, Clustering XML Documents using Structure and Content Based in a Proposal Similarity Function (OverallSimSUX). Computación y Sistemas, 2015. 19(1). 15. Shin, K. and S.Y. Han, Fast clustering algorithm for information organization., in In:Proc. of the CICLing
Conference. 2003, Lecture Notes in Computer Science.Springer-Verlag (2003). p. 619–622. doi: 10.1007/3-540-36456-0_69
16. MacQueen, J.B., Some methods for classification and analysis of multivariate observations, in Proc. 5th Berkeley Symposium on Mathematical Statistics and Probability. 1967: Berkeley, University of California. p. 281-297.
17. Kernighan, B.W., Lin, S., An efficient heuristic procedure for partitioning graphs. Bell Systems Technical Journal, 1970. 49(2): p. 291-308. doi: 10.1002/j.1538-7305.1970.tb01770.x
18. Xiong, H., J. Wu, and J. Chen. K-means clustering versus validation measures: a data distribution perspective. in Proceedings of the 12th ACM SIGKDD international conference on Knowledge discovery and data mining (KDD 2006). 2006. Philadelphia, PA, USA: ACM Press. doi: 10.1109/TSMCB.2008.2004559
19. Kaufman, L. and P.J. Rousseeuw, Finding groups in data: an introduction to cluster analysis. Wiley Series in probability and mathematical statistics. 1990: John Wiley and Sons.
20. Olmos, Y.P. and J.M.M. Martinez, Estudio de metodos de agrupamiento en el contexto del resumen de corpus textuales, in Ciencia de la Computacion. 2005, Universidad Central "Marta Abreu" de Las Villas. p. 104.
21. Berry, M.W., Survey of Text mining: Clustering, Classification, and Retrieval. 2004, New York, USA: Springer Verlag. doi: 10.1007/978-1-4757-4305-0
22. Höppner, F., et al., Fuzzy cluster analysis: methods for classification, data analysis and image recognition.
1999, West Sussex, England: John Wiley & Sons Ltd.
23. ASLAM, J., E. PELEKHOV, and R. D., The star clustering algorithm for static and dynamic information organization. Journal of Graph Algorithms and Applications,, 2004. 8.
24. Pérez, A. and J.E. Medina. A clustering algorithm based on generalized stars. in Proceedings of the 5th International Conference on Machine Learning and Data Mining in Pattern Recognition (MLDM 2007). 2007. Leipzig, Germany: Springer Verlag. doi: 10.1007/978-3-540-73499-4_19
25. Pérez, A., et al., Algoritmos de agrupamiento para colecciones de documentos, in Serie Gris. 2008. 26. Frigui, H. and O. Nasraoui, Simultaneous clustering and dynamic keyword weighting for text documents.
2001. doi: 10.1007/978-1-4757-4305-0_3
27. Korfhage, R.R., Information Storage and Retrieval. Wiley, 1997.
28. Steinbach, M., G. Karypis, and V. Kumar. A comparison of document clustering techniques. in
Proceedings of 6th ACM SIGKDD World Text Mining Conference. 2000. Boston: ACM Press.
29. Frakes, W.B. and R. Baeza-Yates, Information Retrieval. Data Structure & Algorithms. 1992, New York: Prentice Hall.
30. Sheskin, D.J., Handbook of Parametric and Nonparametric statistical procedures, ed. C. Hall/CRC. 2004, New York. 1184. doi: 10.1198/tech.2001.s629
31. Nemenyi, P.B., Distribution-free multiple comparisons. 1963, Princeton University.
32. Demsar, J., Statistical Comparisons of Classifiers over Multiple Data Sets. Journal of Machine Learning Research, 2006. 7(2006): p. 1-30. doi: 10.1.1.141.3142