Financial Analysis of Nike International company
Introduction:
This is a Report of Financial Analysis of Nike International Company. In this work, I estimate the company liquidity, profitability and Solvency of the company, and market ratios, base on financial statements including (Balance sheet, Income Statement, Statement of Cash flow) during 3 years from 2006 to 2008. In this Analysis, it is also including comparison with 2 big Nike’s competitors in the market Puma and Adidas, however the comparison is restricted in ratios in 2007 because there are some difference among these companies of accounting period, Nike end year report on 31.05 while Puma and Adidas on 31.12 every year therefore the financial datum of PUMA and Adidas are restricted in 2008.
Contents:
- Part I : Company profile
- Part II: Nike’s financial statement
- Part III: Nike’s Vertical and Horizontal Analysis
Part I: Nike’s Company Profile
Introduction:
Nike Inc. was incorporated in 1968 under the laws of the state of Oregon, USA. The general business activities can be described as follows: design, development, and global marketing of high quality footwear, equipment and accessory products.
Nike is the largest seller of athletic footwear and athletic apparel in the world. The Nike swoosh is one of the most recognizable business logos on earth. It is more than a symbol of great brand marketing. Nike has revolutionized the way companies approach the athletics market. The company digs into any niche related to sports, including technological breakthroughs, retailing, sports management and sports promotion.
Nike deals in a very consumer orientated market. This means that the demand for the Nike's goods heavily depends on the popularity of the various fitness activities. The company adjusts continuously their product mix in order to meet demands. It manages its business carefully, leading in aggressive marketing styles and innovative products.
Key Value: "Ultimate Victory"
When P. Knight and B. Bowerman created Nike, they decided to create a company to win, for the "ultimate victory". This idea has been influencing Nike (the Greek Goddess of Victory) every day.
Nike's world headquarters are surrounded by the city of Beaverton, Oregon but are technically within unincorporated Washington County.
The world headquarters is situated on approximately 200 acres of land. The first phase of construction was completed in 1990, followed by expansions in 1992, 1999, 2001 and 2008. There are 17 buildings, together providing approximately 2 million square feet of office space. Each building is named for a legendary coach or athlete who has had a long affiliation with Nike, including Tiger Woods, Lance Armstrong, Mia Hamm, Michael Jordan, Pete Sampras, Joan Benoit Samuelson, John McEnroe and several others
Products
Nike produces a wide range of sports equipment. Their first products were track running shoes. They currently also make shoes, jerseys, shorts, baselayers etc. for a wide range of sports including track & field, baseball, ice hockey, tennis, Association football, lacrosse, basketball and cricket. The most recent additions to their line are the Nike 6.0 and Nike SB shoes, designed for skateboarding. Nike has recently introduced cricket shoes, called Air Zoom Yorker, designed to be 30% lighter than their competitors'.[13] In 2008, Nike introduced the Air Jordan XX3, a high performance basketball shoe designed with the environment in mind.
In 2004, they launched the SPARQ Training Program/Division. It is currently the premier training program in the U.S.
Some of Nike's newest shoes contain Flywire and Lunarlite Foam. These are materials used to reduce the weight of many types of shoes.
Manufacturing:
Nike has contracted with more than 700 shops around the world and has offices located in 45 countries outside the United States. Most of the factories are located in Asia, including Indonesia, China, Taiwan, India, Thailand, Vietnam, Pakistan, Philippines,and Malaysia. Nike is hesitant to disclose information about the contract companies it works with. However, due to harsh criticism from some organizations like CorpWatch, Nike has disclosed information about its contract factories in its Corporate Governance Report.
Source: http://www.wikinvest.com/stock/Adidas_AG_(ADDYY)
This diagram shows that Nike is the leader in world market of Athletic Footware and Apparel, in which it shows Adidas and Puma are also the main Nike’s Competitors.
Part II:
Nike Financial statement: 3 years from 2006-2008
1. Balance Sheet
BALANCE SHEET
Year Ended May 31, Million USD
2006 2007 2008
ASSETS
Current Assets
Inventories 2,076.70 2,121.90 2,438.40 Deferred income taxes 203.30 219.70 227.20 Prepaid expenses and other current assets 380.10 393.20 602.30
Total current assets 7,346.00 8,076.50 8,839.30
Property, plant and equipment, net 1,657.70 1,678.30 1,891.10 Identifiable intangible assets, net 405.50 409.90 743.10
Goodwill 130.80 130.80 448.80
Deferred income taxes and other assets 329.60 392.80 520.40
Total assets 9,869.60 10,688.30 12,442.70 LIABILITIES AND
SHAREHOLDERS’ EQUITY Current liabilities
Current portion of long-term debt 255.30 30.50 6.30
Notes payable 43.40 100.80 177.70
Accounts payable 952.20 1,040.30 1,287.60 Accrued liabilities 1,276.00 1,303.40 1,761.90 Income taxes payable 85.50 109.00 88.00
Total current liabilities 2,612.40 2,584.00 3,321.50
Long-term debt 410.70 409.90 441.10
Deferred income taxes and other liabilities 561.00 668.70 854.50 Commitments and contingencies
Redeemable Preferred Stock 0.30 0.30 0.30
Shareholders’ equity
Common stock at stated value
Class A convertible - shares outstanding 0.10 0.10 0.10 Class B - shares outstanding 2.70 2.70 2.70 Capital in excess of stated value 1,447.30 1,960.00 2,497.80 Accumulated other comprehensive income 121.70 177.40 251.40 Retained earnings 4,713.40 4,885.20 5,073.30
Total shareholders’ equity 6,285.20 7,025.40 7,825.30 Total liabilities and shareholders’ equity 9,869.60 10,688.30 12,442.70 Table 1: the balance sheet of Nike in years from 2006-2008
2. Income Statement
INCOME STATEMENT
2006 2007 2008
Revenues 14,954.90 16,325.90 18,627.00
Cost of sales 8,367.90 9,165.40 10,239.60
Gross margin 6,587.00 7,160.50 8,387.40
Selling and administrative expense 4,477.80 5,028.70 5,953.70 Interest (income) expense, net 36.80 67.20 77.10
Other (expense) income, net -4.40 0.90 -7.90
Income before income taxes 2,141.60 2,199.90 2,502.90
Income taxes 749.60 708.40 619.50
Net income 1,392.00 1,491.50 1,883.40
Basic earnings per common share 2.69 2.96 3.80 Diluted earnings per common share 2.64 2.93 3.74 Dividends declared per common share 0.59 0.71 . 0.875 Table 2. The income statement of Nike from 2006-2008
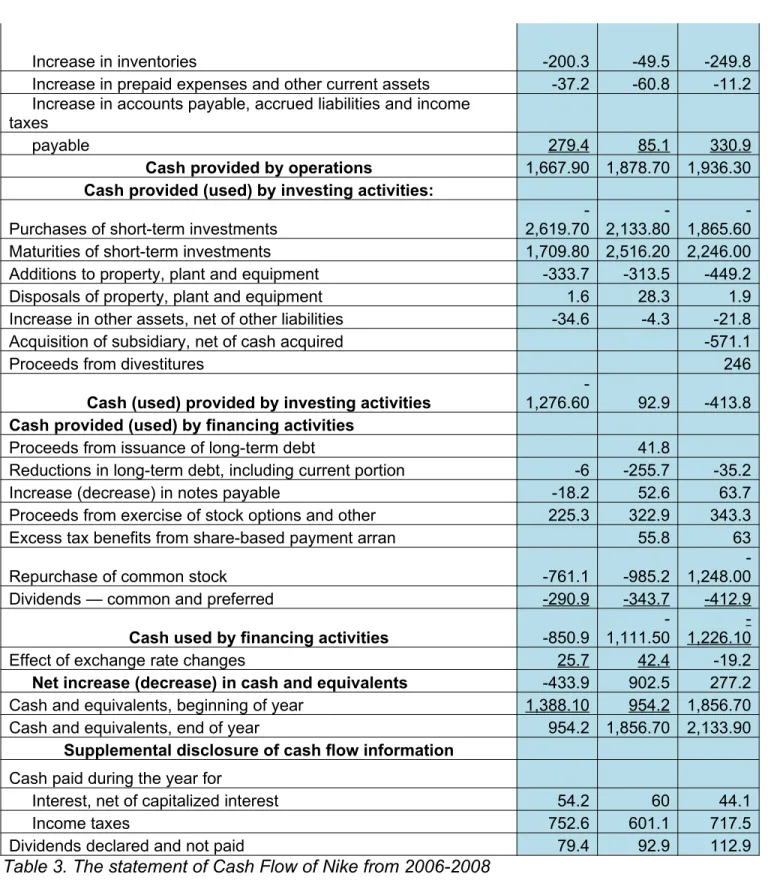
3. Statement of Cash Flow
CASH FLOW
Year Ended May 31, Million USD
2006 2007 2008
Cash provided (used) by operations
Net income 1,392.00 1,491.50 1,883.40
Income charges not affecting cash:
Depreciation 282 269.7 303.6
Deferred income taxes -26 34.1 -300.6 Stock-based compensation 11.8 147.7 141
Gain on divestitures -60.6
Amortization and other -2.9 0.5 17.9 Income tax benefit from exercise of stock options 54.2
Changes in certain working capital components and other assets liabilities excluding the impact of acquisition and divestitures
Increase in inventories -200.3 -49.5 -249.8 Increase in prepaid expenses and other current assets -37.2 -60.8 -11.2 Increase in accounts payable, accrued liabilities and income
taxes
payable 279.4 85.1 330.9
Cash provided by operations 1,667.90 1,878.70 1,936.30
Cash provided (used) by investing activities:
Purchases of short-term investments
-2,619.70 -2,133.80 -1,865.60 Maturities of short-term investments 1,709.80 2,516.20 2,246.00 Additions to property, plant and equipment -333.7 -313.5 -449.2 Disposals of property, plant and equipment 1.6 28.3 1.9 Increase in other assets, net of other liabilities -34.6 -4.3 -21.8 Acquisition of subsidiary, net of cash acquired -571.1
Proceeds from divestitures 246
Cash (used) provided by investing activities
-1,276.60 92.9 -413.8
Cash provided (used) by financing activities
Proceeds from issuance of long-term debt 41.8
Reductions in long-term debt, including current portion -6 -255.7 -35.2 Increase (decrease) in notes payable -18.2 52.6 63.7 Proceeds from exercise of stock options and other 225.3 322.9 343.3 Excess tax benefits from share-based payment arran 55.8 63 Repurchase of common stock -761.1 -985.2
-1,248.00 Dividends — common and preferred -290.9 -343.7 -412.9
Cash used by financing activities -850.9
-1,111.50
-1,226.10 Effect of exchange rate changes 25.7 42.4 -19.2
Net increase (decrease) in cash and equivalents -433.9 902.5 277.2 Cash and equivalents, beginning of year 1,388.10 954.2 1,856.70 Cash and equivalents, end of year 954.2 1,856.70 2,133.90
Supplemental disclosure of cash flow information
Cash paid during the year for
Interest, net of capitalized interest 54.2 60 44.1
Income taxes 752.6 601.1 717.5
Dividends declared and not paid 79.4 92.9 112.9
Part III: Vertical and Horizontal Analysis
This part analysis Horizontal and Vertical of the most important financial statements, they include Balance Sheet and Income Statement.
Horizontal analysis:
is to determine the amount of series data increase or decrease follow period of time which compared among current years amount and with base year amount.
Base year is the amount in 2006, and the result, following this formula of Horizontal analysis.
The Result in the table below = Current year amount / Base year amount
1 Balance sheet
Horizontal
Analysis
Vertical Analysis
2007/2006 2008/2006 2006 2007 2008
ASSETS
CURRENT ASSETS
Cash and equivalents 94.58% 123.63% 9.67% 17.37% 17.15% Short-term investments -26.58% -52.39% 13.67% 9.27% 5.16% Accounts receivable, net 4.69% 17.31% 24.14% 23.34% 22.47% Inventories 2.18% 17.42% 21.04% 19.85% 19.60% Deferred income taxes 8.07% 11.76% 2.06% 2.06% 1.83% Prepaid expenses and
Total current assets 9.94% 20.33% 74.43% 75.56% 71.04%
Property, plant and
equipment, net 1.24% 14.08% 16.80% 15.70% 15.20% Identifiable intangible
assets, net 1.09% 83.26% 4.11% 3.84% 5.97% Goodwill 0.00% 243.12% 1.33% 1.22% 3.61% Deferred income taxes
and other assets 19.17% 57.89% 3.34% 3.68% 4.18%
Total assets 8.30% 26.07% 100.00% 100.00% 100.00%
LIABILITIES AND SHAREHOLDERS’
EQUITY Current liabilities
Current portion of
long-term debt -88.05% -97.53% 2.59% 0.29% 0.05% Notes payable 132.26% 309.45% 0.44% 0.94% 1.43% Accounts payable 9.25% 35.22% 9.65% 9.73% 10.35% Accrued liabilities 2.15% 38.08% 12.93% 12.19% 14.16% Income taxes payable 27.49% 2.92% 0.87% 1.02% 0.71%
Total current liabilities -1.09% 27.14% 26.47% 24.18% 26.69%
Long-term debt -0.19% 7.40% 4.16% 3.84% 3.55%
Deferred income taxes
and other liabilities 19.20% 52.32% 5.68% 6.26% 6.87% Commitments and
contingencies Redeemable Preferred
Stock 0.00% 0.00% 0.00% 0.00% 0.00%
Shareholders’ equity
value
Class A convertible
-shares outstanding 0.00% 0.00% 0.00% 0.00% 0.00% Class B - shares
outstanding 0.00% 0.00% 0.03% 0.03% 0.02% Capital in excess of
stated value 35.42% 72.58% 14.66% 18.34% 20.07% Accumulated other
comprehensive income 45.77% 106.57% 1.23% 1.66% 2.02% Retained earnings 3.64% 7.64% 47.76% 45.71% 40.77%
Total shareholders’
equity 11.78% 24.50% 63.68% 65.73% 62.89%
Total liabilities and
shareholders’ equity 8.30% 26.07% 100.00% 100.00% 100.00%
Table 4. the balance sheet of Nike in Horizontal and Vertical Analysis from 2006-2008
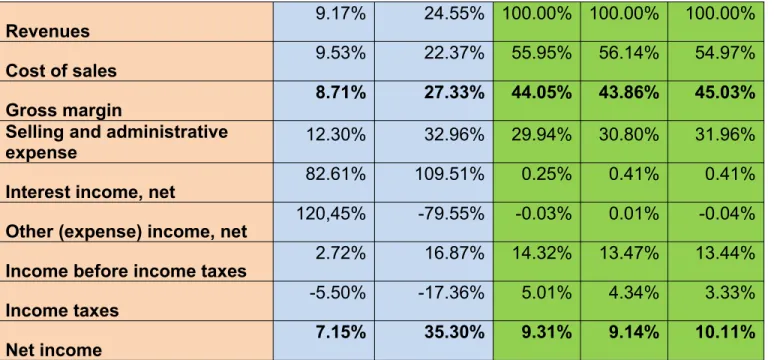
2. Income statement
Horizontal Analysis Vertical Analysis
Revenues 9.17% 24.55% 100.00% 100.00% 100.00%
Cost of sales 9.53% 22.37% 55.95% 56.14% 54.97%
Gross margin 8.71% 27.33% 44.05% 43.86% 45.03%
Selling and administrative
expense 12.30% 32.96% 29.94% 30.80% 31.96%
Interest income, net 82.61% 109.51% 0.25% 0.41% 0.41%
Other (expense) income, net 120,45% -79.55% -0.03% 0.01% -0.04% Income before income taxes 2.72% 16.87% 14.32% 13.47% 13.44%
Income taxes -5.50% -17.36% 5.01% 4.34% 3.33%
Net income 7.15% 35.30% 9.31% 9.14% 10.11%
Table 5. the income statement of Nike in Horizontal and Vertical Analysis from 2006-2008
Horizontal:
Vertical:
As we can see the tables above, Current assets occupy huge amount 74,43% in 2006, 75.56% in 2007 and 71.04% in 2008, while fixed assets is as approximately 1/4 in total assets, this is quite clear because Nike is an international company but the manufacturing activities mainly by the contract to do outwork for Nike by manufacturers in developing countries such as Vietnam, Indonesia, Korea…etc the company headquarter in US mainly concentrate on researching, marketing, operating activities… therefore actually Nike almost does not have manufacturers or factory. This lead to the current assets are always high and reducing in productive expenses, quite high in marketing expense or selling and administrative expense, 29,94% 2006, 30.84% in 2007, and 31.96 in 2008, but profit margin is quite high because the reducing in production expense.
Part IV: Nike Ratios Analysis in comparison with Puma and
Adidas
This analysis concentrates on analyzing Nike’s Liquidity, Profitability, and Solvency in comparison with Puma and Adidas in the year of 2007 (latest available yearend of Puma and Adidas) thence illustrate for Nike’s Business performance through the Financial Analysis.
A.
Liquidity AnalysisThe first step is Liquidity analysis which will analyze
1 Current ratio 2 Acid ratio
3 Current cash debt coverage ratio 4 Receivable turnover
This analysis will show us the short-term ability of Nike to pay its maturing obligations and meet unexpected need for cash, short term creditors, or short term debt paying ability.
1. Current Ratio
Is a widely used measure for evaluating a company’s liquidity and short-term debt paying ability.
The ratio is computed by dividing current assets by current liabilities:
The results from table is caculated from Companies’s financial reports
The table above shows us that the Nike’s current assets is 3.13 in 2007 compare with 2.31 of Puma and 1.70 of Adidas. This means Nike has better condition in liquidity and short-term payable ability. Nike is in the best position.
This ratio was strongly increased from 2006 to 2007, but it was decreased to 2.67 in 2008 because existing payable and income tax by the increasing in production and net income which will be paid in short term.
Nike 2006
Nike 2007
Nike 2008
Puma 2007
Adidas 2007
2. Acid-Ratio ( quick Ratio)
It will compare three companies immediate short-term liquidity in 2007, it also show Nike ratio from 2006-2008.
Quick ratio is computed by dividing the sum of cash, short-term investment, and net receivable by current liabilites.
The results from table is calculated from Company’s financial reports
This shows that the immediately paying ability of Nike is in the best 2.07 compares with Puma 1.69 and Adidas 0.76. this means Nike can pay immediately for current obligations as 2.07 times in 2007, this id good ratio for a company. This ratio strong increased in 2007 but decreased by the same cause with Current ratio mentioned above.
3. Current Cash Debt Coverage Ratio
It is calculated by dividing net cash provided by operating activities by average current liabilities.
Nike 2006
Nike 2007
Nike 2008
Puma 2007
Adidas 2007
The results from table is caculated from Companies’s financial reports
The results show us that Nike is also is in the best for this ratio, company ratio in 2007 is 0.72 while Puma 0.54 and 0.34 with Adidas, this means Net cash from operating activities of Nike can cover 72% of its current liabilities, which is very good performance.
4. Receivable Turnover
This analysis will compare the ability to obtain the amount of current receivables or liquidity of receivable of these companies. It is calculated by dividing nets credits sales by the average of net receivables.
The results from table is calculated from Company’s financial reports
This table show us that Nike can collect the receivable more quickly than Puma but slower than Adidas in 2007, with ratio 6.70 Nike can collect the money in 365/6.7 = approximately 55 days while this number is 59 days for Puma and 51 days.
5. Inventory turnover
Nike
2006 Nike 2007 Nike 2008
Puma 2007
Adidas 2007
3. Current Cash Dept
Coverage Ratio 0.72 0.66 0.54 0.34
Nike 2006 Nike 2007 Nike 2008 Puma 2007 Adidas 2007
This measures the number of times of average the inventory is sold during the period. This will compare the liquidity of inventory of three companies.
Nike 2006 Nike 2007 Nike 2008 Puma 2007 Adidas 2007
5. Inventory Turnover 4.37 4.49 3.07 3.35
The results from table is caculated from Companies’s financial reports
This results mean that Nike can sell their inventory during 365/4.37= approximately 84 days while the number of Puma is 119 and 109 with Adidas therefore the Nike liquidity of inventory is in the best compare with two main competitors.
Conclusion
Through these Ratios we can see that Nike has very good ratios in liquidity analysis, it is always in the best compare with 2 main competitors. This can be explained by the abundant capital and optimistic data from business in the market and administration. It shows us that why Nike is always in the best in the global athletic footwear and apparel market.
B. Profitability Ratios
This part will concentrate on analysis of the income or operating success of Nike follow the year from 2006-2008 in comparision with Puma and Adidas in 2007, thence it will show the company ability to obtain debt and equity financing. As the same time, it also illustrates the company’s ability to grow.
The analysis will be concentrate on these below ratios:
2. Cash return on sales 3. Assets turnover 4. Return on assets
5. Return on common stockholder’s equity
1. Profit margin ( ROS- Return on sales)
This measure the percentage of each dollar of sales that results in net income. This is calculated by dividing net income by net sales.
Nike 2006 Nike 2007 Nike 2008 Puma 2007 Adidas 2007
1. Profit Margin 0.09 0.09 0.10 0.11 0.05
The results from table is caculated from Companies’s financial reports
This results show that Nike ratio is also keep stable 9% from 2006 to 2007 and increase to 10% in 2008. Nike obtain 9% while Puma get 11% and Adidas is 5% . this means Puma has good percentage of this ratios, while Nike is in the middle better than Adidas in 2007.
2. Cash return on sales
Nike
2006 Nike 2007 Nike 2008
Puma 2007
Adidas 2007
2. Cash Return On
Sales 0.11 0.12 0.10 0.13 0.08
The results from table is caculated from Companies’s financial reports
Nike has 12% of this ratio, less than Puma with 12% and more than Adidas with 8%. On the other hand, company was increased this ratio from 2006 to 2007, but decreased in 2008 down to 10%.
3. Assets turnover
This ratio measures how efficiently Nike uses its assets to generate sales in comparison with Puma and Adidas. It is determined by dividing net sales by average assets.
Nike 2006 Nike 2007
Nike 2008
Puma 2007
Adidas 2007
3. Asset Turnover 1.59 1.61 1.33 1.23
The results from table is caculated from Companies’s financial reports
this means Nike’s is the best and has got good situation in operating, on the other hand company also increased in next year 2008 up to 1.61 times.
4. Return on assets ( ROA)
This is the typical ratio to measure the company performance. It is calculaed by dividing net income by average assets.
The results from table is caculated from Companies’s financial reports
Nike has good situation in this ratio 15% in 2007 equal with Puma, and better than Adidas with 7%. However if we look as net income Nike has huge amount 1491,50 million USD compare with 269 million USD from Puma, and 555 million USD of Adidas, Nike is as the giant in the market. Also this ratio is increased in 2008 to 16%.
5. Return on common stockholder’s equity (ROE)
This ratio is calculated by dividing net incomes by average common stockholder’s Equity.
Nike 2006 Nike 2007 Nike 2008 Puma 2007 Adidas Nike 2006 Nike 2007
Nike
2008 Puma 2007 Adidas 2007
2007
10. Return On common
Stockholder's Equity 0.22 0.25 0.24 0.18
The results from table is caculated from Companies’s financial reports
Nike has middle position in this ratio with 22% while Puma has 24% and Adidas 18% in 2007. This is also good ratios for Nike if we condider to total amount of Nike Equity which is big amount more than Puma and Adidas. Also in the coming years 2008, company has good increasing to 25%.
C. Solvency Ratios
In this analysis we will continue to analysis the ability of the company to survive over the long period of time through the ratios below:
1. Debt to total assets ratio 2. Times interest earned
This analysis can attract long-term creditors or investors of Nike.
1. Debt to total assets ratio ( Total debt ratio )
2006 2007 2008 2007 2007
1. Debt to Total
Assets Ratio 0.36 0.34 0.37 0.38 0.64
The results from table is caculated from Companies’s financial reports
The results tell that Nike has best position compare with Puma and Adidas because their total Debt occupies only 34% of total assets in 2007 while Puma has 38% and Adidas has 64%. This help Nike is interesting for long-term investors and creditors. This number is also decreased from 2006 36% to 2007 34% and increasing in 2008 to 37%.
2. Times interest earned
This ratio provides in indication of the company’s ability to meet interest payments as they come due. It is computed by dividing income before income taxes by interest expense.
The results from table is caculated from Companies’s financial reports
Nike has very high 33.74 in this ratio compare with Puma 1.95 and Adidas 6.85 in 2007 because they have very high amount of
earnings before income taxes 2199.9 millions USD while their
interest expense is quite small amount 67.2 millions USD. This cause might comes from the scale of business.
Nike 2006
Nike 2007
Nike
2008 Puma 2007
Adidas 2007
2. Times Interest
D. Du Pont Analysis: (2008)
This Du pont analysis is aim to help us have a look to overall the Nike internal financial in the interrelation among the ratios distribute to ROE ratio, which can be shown the necessarily ratio need to improve in order to have the most efficient to shareholders.
The analysis will calculate the formula below:
It equals:
=
Nike 2006 Nike 2007 Nike 2008 Puma 2007
Adidas 2007
10. Return On common
Part V: Conclusion
As we Known, Nike is one of the most famous company in the global athletic footwear and apparel market. It has been developing since the establishment and has been becoming the leader in the market. Nike’s development base on the creation in business and management, The financial datum in this analysis has illustrated for that. Through this analysis we can see, Nike is always in the best in Liquidity, Profitability and Solvency ratios compared in general in both business scale and financial point of view. However in order to maintain the position the company need to pay attention and improve these ratios: The Profit margin, ROE, Cash return on sales, compare with Puma in percentage, Nike is only in the middle which this analysis mentioned above, moreover Nike need to improve the receivable turnover which is behind Adidas.
In the world of competition, Nike has been becoming the leader, that was the efforts of creation and intelligence, the needed things for company is to maintain this position by the continuing the creation and improvement, especially with the US financial crisis, and background of global economical regression, it will probably be influent to customer purchasing power and demand. This will be the challenges and Nike has many things to do in fiscal next year 2009.
Sources:
1. http://www.directessays.com/viewpaper/59726.html
2. http://en.wikipedia.org/wiki/Nike,_Inc.
3. http://www.wikinvest.com/stock/Adidas_AG_(ADDYY)
Books:
1. Principles of corporate finace by McGRAW – HILL.