Probability and Scatter Plots (Grade 8) 1
Standard 8.12
The student will determine the probability of independent and dependent events with and
without replacement.
HINTS AND NOTES
Always write probability as a
fraction first,
like
what we want
totalpossible
, then
change it to decimal or a percent.
If they describe a situation and
then ask you to decide what will
happen in a completely different
situation, use a proportion.
Make sure you write words in
your proportion and match them
up.
Probability and Scatter Plots (Grade 8) 2
SOL 8.12 Skills Checklist
I can…
Determine the probability of no more than three independent events.
Probability and Scatter Plots (Grade 8) 3
Standard 8.13
The student will a) make comparisons, predictions, and inferences, using information
displayed in graphs; and b) construct and analyze scatterplots.
HINTS AND NOTES
Scatter plot-
is a graph that shows
the relationship between two sets of
data.
The data (ordered pairs) are graphed
on a coordinate plane and will have
positive, negative or no correlation.
Correlations
Positive-
Up from left to right
Negative-
Down from left to right
None
- points are scattered
everywhere
For scatter plots, look for crashing
planes or no relationship.
Look for patterns on graphs that will
help you predict what will happen in
the future.
3.
The scatter plot shows the
results of an experiment designed
to determine the relationship
between the number of mutations
and the dose of radiation given to a
sample of mealy worms. Of the
following, which can you conclude
about the experiment?
F.
There are fewer mutations the higher the dose of radiation,
negative correlation.
G.
There are more mutations the lower the dose of radiation: a
negative correlation.
H.
There is no relationship between mutations and the dose of
radiation.
Probability and Scatter Plots (Grade 8) 4
8.13 Critical Thinking (TEI)
4. Select all the scatter plots below with a positive relationship.
5. Create a scatterplot using the data below and practice making predictions about what will
happen given certain fat or calorie values.
Skills Checklist 8.13 I can…
Collect, organize, and interpret a data set of no more than 20 items using scatterplots. Predict
from the trend an estimate of the line of best fit with a drawing.
Interpret a set of data points in a scatterplot as having a positive relationship, a negative
relationship, or no relationship.
Using the Scatter Plot you
created answer the
following questions.
a. How many calories would
be in a snack with 24 fat
grams per serving?
Patterns, Functions, and Algebra (Grade 8)
1
Standard 8.14The student will make connections between any two representations (tables, graphs, words, and rules) of a given relationship.
Standard 8.16
The student will graph a linear equation in two variables. HINTS AND NOTES
A relation is any set of ordered pairs.
All functions are relations, but not all relations are functions. Functions provide a distinct rule.
Functions can be represented as tables, graphs, equations, physical models, or in words.
When trying to write equations for real word situations.
The word “than” in a problem switches the order of the words.
The words “per” and “rate” usually mean multiply.
Use a proportion if a problem describes a situation and then asks you to find out what would happen in a slightly different situation.
Patterns, Functions, and Algebra (Grade 8)
2
Most equations will look likey = #x + #.
To go from a table to an equation or an equation to a table, the number by itself (not with x) in the equation is the y value when x is zero in the table.
To go from a table to an equation or an equation to a table, the number in front of x in the equation is found by putting the change in y over the change in x from the table.
To go from a graph to an equation or an equation to a graph, the number by itself (not with x) is where the line crosses the y-axis.
To go from a graph to an equation or an equation to a graph, the number in front of x in the equation tells you if the line is in a positive direction or a negative direction on the graph. To go from a table to a graph or
a graph to a table, the point where x is zero on the table is the point where the line crosses the y axis on the graph.
To go from a table to a graph or a graph to a table, the change in y over the change in x on the table tells you if the line goes in a positive or a negative direction on the graph.
Patterns, Functions, and Algebra (Grade 8)
3
Patterns, Functions, and Algebra (Grade 8)
6
8.14/8.16 Critical Thinking/TEI Questions1.
Using the coordinate plane to the right. Is there another way to write this function, yes or no? If there is, write it in the box to the right as well.
2. Construct a table of ordered pairs which
represent solutions of this linear equation. Use at least three x-values.
1
y
x 2
2
3. Draw a graph to represent y is equal to 4 less than a number.
Skills Checklist I can… 8.14
Graph in a coordinate plane ordered pairs that represent a relation.
Describe and represent relations and functions, using tables, graphs, words, and rules. Given one representation, students will be able to represent the relation in another form.
Relate and compare different representations for the same relation. 8.16
Construct a table of ordered pairs by substituting values for x in a linear equation to find values for y. Plot in the coordinate plane ordered pairs (x, y) from a table.
Connect the ordered pairs to form a straight line (a continuous function).
Interpret the unit rate of the proportional relationship graphed as the slope of the graph, and compare two different proportional relationships represented in different ways.
x
Patterns, Functions, and Algebra (Grade 8)
7
Standard 8.15The student will
a) solve multistep linear equations in one variable on one and two sides of the equation; b) solve two-step linear inequalities and graph the results on a number line; and
c) identify properties of operations used to solve an equation.
In an equation, the equal sign indicates that the value on the left is the same as the value on the right.
To maintain equality, an operation that is performed on one side of an equation must be performed on the
other side.
When both expressions of an inequality are multiplied or divided by a negative number, the inequality sign reverses.
Commutative property for addition (5 + 4 = 4 + 5).
Commutative property for multiplication
(5 · 4 = 4 · 5).
Associative property of addition [5 + (4 + 3) = (5 + 4) + 3]
Associative property of multiplication
[5 · (4 · 3) = (5 · 4) · 3]
Subtraction and division are neither commutative nor associative.
Distributive property
[5 · (3 + 7) = (5 · 3) + (5 · 7), or 5 · (3 – 7) = (5 · 3) – (5 · 7)].
Identity elements are numbers that combine with other numbers without changing the other numbers.
The additive identity is zero (0). 5 + 0 = 5
The multiplicative identity is one (1).
8 · 1 = 8
There are no identity elements for subtraction and division.
Patterns, Functions, and Algebra (Grade 8)
8
Inverses are numbers that combinewith other numbers and result in identity elements
Additive inverse property 5 + (–5) = 0
Multiplicative inverse property (or reciprocal)
1 3
1
3 1
Zero has no multiplicative inverse.
Multiplicative property of zero 5 0 0
Division by zero is not a possible arithmetic operation.
If you get stuck- Plug it in! Plug it in!
For any problem involving solving an equation, plug in all the answer choices until you find the one that works.
When solving an inequality, plug in a number bigger or smaller than the answer choice. For example, for x > 6, plug in 7 and see if it works. For x < -4, plug in -5 and see if it works.
Change all fractions to decimals, including the fractions in the answer choices.
Patterns, Functions, and Algebra (Grade 8)
9
8.15 Critical Thinking/TEI Questions1. Select all the numbers to the right that are solutions of
x 9
24
2
2. What is one solution of the equation shown to the right? Write your answer in improper fraction form in the box to the right.
3x 9
2
8
X=3. Select all the equations to the right which represent the associative property of
multiplication.
There is an equation solved to the right. Drag (draw an arrow) the property used for steps one and two. Not all properties will be used and some may be used more than once.
(
)
2x 2 2 3x
28
2x 4 6x 28
4x 4 28
4x 20
x
5
Commutative Property Associative Property Distributive Property Additive Inverse Multiplicative IdentityMultiplicative Property of Zero
Skills Checklist I can…
Solve two- to four-step linear equations in one variable using concrete materials, pictorial representations, and paper and pencil illustrating the steps performed.
Solve two-step inequalities in one variable by showing the steps and using algebraic sentences.
Graph solutions to two-step linear inequalities on a number line.
Identify properties of operations used to solve an equation from among: the commutative properties of addition and multiplication;
the associative properties of addition and multiplication; the distributive property;
the identity properties of addition and multiplication; the zero property of multiplication;
the additive inverse property; and the multiplicative inverse property.
-61
-100
-57
57
0
-56
2+ (x +3) = (2 +x)+3
(
)
(
)
y 3 x
y 3 x
(
3 4 x x 3 4
)
(
)
2x + 2y = 2 (x + y)
(
z w 4 z w 4
)
(
)
Step 1:
Patterns, Functions, and Algebra (Grade 8)
10
Standard 8.17The student will identify the domain, range, independent variable or dependent variable in a given situation.
HINTS AND NOTES
The variable x in the “independent variable” and the list of all the x values is called the “domain”.
The variable y is the “dependent variable” and the list of all the y values is called the “range”.
Patterns, Functions, and Algebra (Grade 8)
11
8.17 Critical Thinking/TEI Questions1. Given this relation in the table below. Select all numbers which are part of the domain.
X Y -1 2 2 0 4 6 10 8
2. Identify the independent and dependent variable in the following formula. Roxanne is attempting to find all the possible areas of a triangle with a height of 10 cm. She is using the formula
1
A of a
bh
2
The area is the variable.
The base of the triangle is the variable.
Skills Checklist I can…
Apply the following algebraic terms appropriately Domain
Range
independent variable dependent variable
Identify examples of domain, range, independent variable, and dependent variable.
Determine the domain of a function.
Determine the range of a function.
Determine the independent variable of a relationship.
Determine the dependent variable of a relationship
1
-2
-1
2
Number and Number Sense (Grade 8)
1
Standard 8.1aThe student will simplify numerical expressions involving positive exponents, using rational numbers,
order of operations, and properties of operations with real numbers.
HINTS AND NOTES
Remember: PEMDAS and PEDMSA.
Multiplication and division happen in
the same step.
Subtraction and addition happen in the
same step.
The exponent tells you how many
times you multiply a number.
Grouping Symbols:
Parentheses
(
)
Brackets
[
]
Braces { }
The absolute value
x
Division/fraction
bar
Square
root
Properties used in order of operations:
Commutative (change order)
Associative (change grouping)
Inverse (the opposite of)
Number and Number Sense (Grade 8)
3
Standard 8.1bThe student will compare and order decimals, fractions, percent, and numbers expressed in scientific
notation.
HINTS AND NOTES
Steps for ordering numbers:
1. Change all the numbers to
decimals.
2. Line up the decimals.
3. Add on zeros until the
numbers are the same
length. They should have all
the same number of digits.
4. Ignore the decimals and put
them in order.
In scientific notation, there can only
one digit in front of the decimal
point.
The exponent tells you how many
spaces the decimal needs to move
to get to where it is in the standard
number.
If the exponent is negative, the
decimal moves in the negative
direction. If the exponent is
positive, the decimal moves in the
positive direction.
A
power
of a number represents
repeated multiplication of the
number.
5
4
(
5
)(
5
)(
5
)(
5
)
=
625
5
4
( )( )( )( )
5 5 5 5
625
Notice how the () make a
Number and Number Sense (Grade 8)
5
8.1 Critical Thinking Questions (TEI) and Checklist
1. Put these numbers in order from greatest
to least in the boxes to the right.
%,
1
,
.
1,
, .
23
3 4x10
34 034
3
2. Does addition always come before
subtraction when using order of operations?
If possible give an example of an order of
operations problem where you would perform
subtraction before addition.
3. Simplify the numerical expression below
and place your answer in the box to the right.
4. Look at the problem to the right and
identify why it does not show the numbers in
ascending order and then write the numbers
in the correct order in the boxes below.
,
%,
, .
27
70
7
8 75x10
8
10
5. Simplify using order of operations and
write your answer in the box to the right.
Skill Checklist
I can…. Simplify numerical expressions using order of operations which contain
Exponents, fractions, decimals, integers and square roots of perfect squares, grouping symbols
Number and Number Sense (Grade 8)
6
Standard 8.2The student will describe orally and in writing the relationship between the subsets of the real number
system.
HINTS AND NOTES
Remember the saying: “Never Wear
Idiotic Red Reeboks.”
Find the smallest set that a number is
in. Then list all the sets that the first
set is contained in.
Rational numbers
Integers
Whole numbers
Number and Number Sense (Grade 8)
7
8.2 Critical Thinking Questions (TEI) and Checklist
1. Below are a list of 10 numbers, place (drag and drop) them into the smallest subset they belong to in the Venn Diagram at the right.
,
,
,
,
,
,
,
,
,
12
12
10
1
10
13
4
3
81
3
0
11
2. Circle (Select) all numbers in the
box at the right which are part of
the Rational Number subset.
3. If you multiply a rational
number times a rational number,
for example
1 4
2 5
.
What will always be true about the
type of number you will get as the
answer or product? Write your
thoughts in the space to the right.
4. What if you multiplied an
irrational number times a rational
number, what would the product
always look like?
Skills Checklist
I can….
Describe orally and in writing the relationships among the sets of natural or counting numbers, whole numbers, integers, rational numbers, irrational numbers, and real numbers.
Illustrate the relationships among the subsets of the real number system by using graphic organizers such as Venn diagrams.
Identify the subsets of the real number system to which a given number belongs.
Determine whether a given number is a member of a particular subset of the real number system, and explain why.
Describe each subset of the set of real numbers and include examples and nonexamples.
Geometry and Measurement (Grade 8)
1
Standard 8.6The student will
a) verify by measuring and describe the relationships among vertical angles, adjacent angles, supplementary angles, and complementary angles; and
b) measure angles of less than 360°. Notes
Complementary angles add up to 90 degrees. You can take the c and turn it into a nine.
Supplementary angles add up to 180 degrees. You can take the s and turn it into an eight.
Vertical angles are across from each other and are congruent (equal) and share a common vertex.
Adjacent angles are any two non-overlapping angles that share a common side and a common vertex
A 90-degree angle is a perfect corner.
Geometry and Measurement (Grade 8)
3
8.6 Critical Thinking/TEI Questions1. Select all of the angles pictured to the right which are NOT supplementary to Angle A.
2. In the picture to the right identify as many examples of each pair angles and list them in the boxes provided.
Supplementary
Complementary
Vertical Angles
Adjacent Angles
Skills Checklist I can…
Measure angles of less than 360° to the nearest degree, using appropriate tools.
Identify and describe the relationships between angles formed by two intersecting lines.
Identify and describe the relationship between pairs of angles that are vertical.
Identify and describe the relationship between pairs of angles that are supplementary.
Identify and describe the relationship between pairs of angles that are complementary.
Identify and describe the relationship between pairs of angles that are adjacent.
Use the relationships among supplementary, complementary, vertical, and adjacent angles to solve practical problems.
A
36˚
144˚
44˚
134˚
Geometry and Measurement (Grade 8)
4
Standard 8.7The student will
a) Investigate and solve practical problems involving volume and surface area of prisms, cylinders, cones, and pyramids; and
b) describe how changing one measured attribute of the figure affects the volume and surface area.
NOTES
Use for formula sheet at all times.
Use the formulas exactly as they are on the sheet for volume.
For surface area, for straight figures it may be easier to tear them apart. For round figures, use the formulas.
Don’t forget to check the units: squared for area and cubed for volume.
Changing Attributes
When one attribute of a prism is changed through multiplication or division the volume increases by the same factor that the attribute
increased by. For example, if a prism has a volume of 2 x 3 x 4, the volume is 24. However, if one of the attributes are doubled, the volume doubles.
Geometry and Measurement (Grade 8)
6
8.7 Critical Thinking/TEI Questions1.
2. The volume of a square based pyramid is 144 cm³ and its height is 12 cm,
what is the area of its base? Base area= cm²
3. The two rectangular prisms shown below have the same base area. The volume of Prism B can be found by multiplying Prism A by what scale factor?
Prism A Prism B Skills Checklist I can…
Distinguish between situations that are applications of surface area and those that are applications of volume.
Investigate and compute the surface area of a square or triangular pyramid by finding the sum of the areas of the triangular faces and the base using concrete objects, nets, diagrams and formulas.
Investigate and compute the surface area of a cone by calculating the sum of the areas of the side and the base, using concrete objects, nets, diagrams and formulas.
Investigate and compute the surface area of a right cylinder using concrete objects, nets, diagrams and formulas.
Investigate and compute the surface area of a rectangular prism using concrete objects, nets, diagrams and formulas.
Investigate and compute the volume of prisms cylinders, cones, and pyramids, using concrete objects, nets, diagrams, and formulas.
Solve practical problems involving volume and surface area of prisms, cylinders, cones, and pyramids.
Compare and contrast the volume and surface area of a prism with a given set of attributes with the volume of a prism where one of the attributes has been increased by a factor of 2, 3, 5 or 10.
Describe the two-dimensional figures that result from slicing three-dimensional figures parallel to the base (e.g., as in plane sections of right rectangular prisms and right rectangular pyramids).†
9cm 3
cm
3
6
9
1
3
1
6
1
9
The figure to the left is a net of a
triangular prism. Find the volume
and surface area of the figure to the
right if it was folded to create a
triangular prism.
Volume: in³
Geometry and Measurement (Grade 8)
7
Standard 8.8The student will a) apply transformations to plane figures; and b) identify applications of transformations.
NOTES
Translation = SLIDE
Reflection = FLIP
Rotation = TURN
Dilation = SHRINK or EXPAND
Scale Factor =
model
actual
.Clockwise =
Counterclockwise =
The image of a polygon is the resulting polygon after a
transformation. The preimage is the original polygon before the transformation.
A transformation of preimage point A can be denoted as the
Geometry and Measurement (Grade 8)
9
8.9 Critical Thinking/TEI Questions1. Find
R
if Triangle RST is translated up 4 units and right 3 units.R
=2. Find S after rotating Triangle RST 180˚.
S=
3. If Triangle RST is reflected across the x- axis find
R S T
4. If Triagle RST under goes a dilation with a scale factor of
1
2
, what will beR S T
?Skills Checklist I can…
Demonstrate the reflection of a polygon over the vertical or horizontal axis on a coordinate grid.
Demonstrate 90°, 180°, 270°, and 360°clockwise and counterclockwise rotations of a figure on a coordinate grid. The center of rotation will be limited to the origin.
Demonstrate the translation of a polygon on a coordinate grid.
Demonstrate the dilation of a polygon from a fixed point on a coordinate grid.
Identify practical applications of transformations including, but not limited to, tiling, fabric, and wallpaper designs, art and scale drawings.
Geometry and Measurement (Grade 8)
10
Standard 8.9The student will construct a three-dimensional model, given the top or bottom, side, and front
views.
NOTES
Count how many blocks you will need across and up on each view.
Geometry and Measurement (Grade 8)
11
8.9 Critical Thinking/TEI Questions
1. When looking at the figure to the left from above and below, will you see a difference, yes or no and why?
2. Create your own 3-D figure given the front, side and top view. Is there more than one figure that can be drawn, yes or no, and why?
Skills Checklist I can…
Construct three-dimensional models, given the top or bottom, side, and front views.
Geometry and Measurement (Grade 8)
12
Standard 8.10The student will verify and apply the Pythagorean Theorem, using diagrams, concrete materials, and measurement.
NOTES
The square of a + the square of b equals the square of c.
C is always the hypotenuse (the side across from the right angle).
A and B are the legs.
Geometry and Measurement (Grade 8)
14
8.10 Critical Thinking/ TEI Questions1. Drag (draw an arrow to)
the vocabulary words into the
correct position in the picture
to the right. Not all words
will necessarily be used and
some may be used more than
once.
2. There are three sided
measures of a triangle listed
in the box. Select all the boxes
where those three side
measures could make a right
triangle.
Skills Checklist
I can…
Identify the parts of a right triangle (the hypotenuse and the legs).
Verify a triangle is a right triangle given the measures of its three sides.
Verify the Pythagorean Theorem, using diagrams, concrete materials, and measurement.
Find the measure of a side of a right triangle, given the measures of the other two sides.
Solve practical problems involving right triangles by using the Pythagorean Theorem.
3, 4, 5
5, 12, 13
Geometry and Measurement (Grade 8)
15
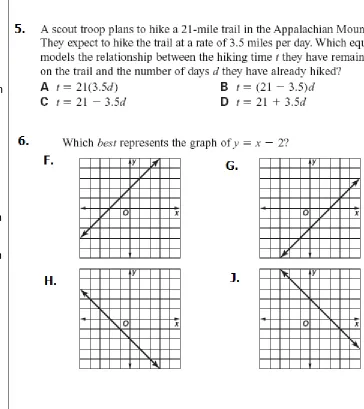
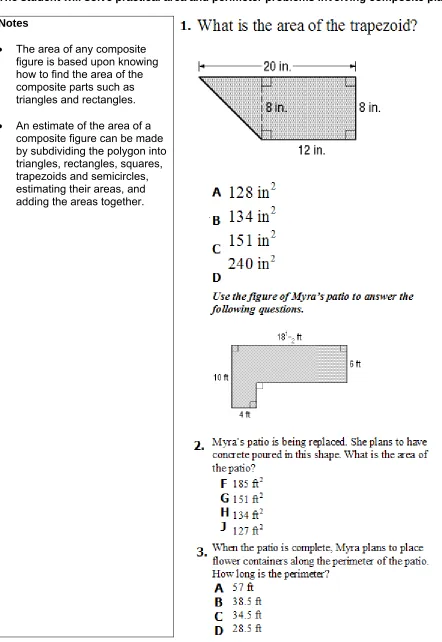
8.11The student will solve practical area and perimeter problems involving composite plane figures.
Notes
The area of any composite figure is based upon knowing how to find the area of the composite parts such as triangles and rectangles.
Geometry and Measurement (Grade 8)
16
8.11 Critical Thinking/TEI QuestionsSkills Checklist I can….
Subdivide a figure into triangles, rectangles, squares, trapezoids and semicircles. Estimate the area of subdivisions and combine to determine the area of the composite figure.
Use the attributes of the subdivisions to determine the perimeter and circumference of a figure.
Computation and Estimation (Grade 8)
1
Standard 8.3The student will
a) solve practical problems involving rational numbers, percents, ratios, and proportions; and b) determine the percent increase or decrease for a given situation.
HINTS AND NOTES
For percents use “is over of” equals “percent over 100.”
If talking about a discount, subtract.
If talking about sales tax, add.
If talking about tip, add.
If you are trying to find the percent of change, subtract the numbers and then divide by the original.
If you are dealing with scales, use a proportion.
%Increase or decrease can be determined using a rate of growth or rate of decline formula.
(
)
Change New Original
Original
Computation and Estimation (Grade 8)
3
Use a proportion if a problem
describes a situation and then asks
you to find out what would happen
in a slightly different situation.
If you see the word “rate”, usually
you will use a proportion.
Make sure the words in your
proportion all match.
Computation and Estimation (Grade 8)
5
8.3 Critical Thinking (TEI) Questions and Checklist1. If you and your friends went out to eat at Plaza Azteca, and left a little more than a 15% tip, or about $4.00. Select ALL the numbers at the right which could have been your bill.
2. Pick the best investment strategy at the right. The best investment strategy leaves you with the most total money at the end of the investment. Use I=prt
Skills Checklist I can…
Write a proportion given the relationship of equality between two ratios.
Solve practical problems by using computation procedures for whole numbers, integers, fractions, percents, ratios, and proportions. Some problems may require the application of a formula.
Maintain a checkbook and check registry for five or fewer transactions.
Compute a discount or markup and the resulting sale price for one discount or markup.
Compute the percent increase or decrease for a one-step equation found in a real life situation.
Compute the sales tax or tip and resulting total.
Substitute values for variables in given formulas.
Computation and Estimation (Grade 8)
6
Standard 8.4The student will apply the order of operations to evaluate algebraic expressions for given replacement values of the variables.
HINTS AND NOTES
PEMDAS or PEDMSA!!!
Remember that multiplication and division happen at the same time and that addition and subtraction happen at the same time.
(
2
)
4
2
4 Meaning
( )( )( )( )( )( )( )( ) 4
4
2 2 2 2 2 16
and
2 2 2 2 2 16
Computation and Estimation (Grade 8)
7
8.4 Critical Thinking (TEI) Questions and ChecklistSkills Checklist I can…
Substitute numbers for variables in algebraic expressions and simplify the expressions by using the order of operations.
Computation and Estimation (Grade 8)
8
Standard 8.5The student will
a) determine whether a given number is a perfect square; and
b) find the two consecutive whole numbers between which a square root lies.
HINTS AND NOTES
Whole numbers have both positive and negative roots.
Use the square root key on your calculator. Make sure you hit the shift key.
Computation and Estimation (Grade 8)
9
8.5 Critical Thinking (TEI) Questions and Checklist1. In the space provided to the right, explain how
100
can be equal to 10 or -10.2. Select all the numbers to the right which have square roots between 10 and 11.
3. How does the area of a square relate to the area of a number? Use the picture at the right to elaborate on your answer.
The area of this square is 9.
Skills Checklist I can…
Identify the perfect squares from 0 to 400.
Identify the two consecutive whole numbers between which the square root of a given whole number from 0 to 400 lies (e.g., 57 lies between 7and 8 since 72 = 49 and 82 = 64).
Define a perfect square.