Open Access
Review
In situ
methods to localize transgenes and transcripts in interphase
nuclei: a tool for transgenic plant research
Ana Paula Santos
1, Eva Wegel
2, George C Allen
3, William F Thompson
4,
Eva Stoger
5, Peter Shaw
2and Rita Abranches*
6Address: 1Plant Genetic Engineering Laboratory, Instituto de Tecnologia Química e Biológica, UNL, Av. República, 2781-901 Oeiras, Portugal, 2Department of Cell and Developmental Biology, John Innes Centre, Colney, Norwich NR4 7UH, UK, 3Plant Transformation Laboratory (PTL),
Departments of Crop Science and Horticultural Science, Campus Box 7550, North Carolina State University, Raleigh, NC 27695, USA, 4Plant Gene
Expression Laboratory, Campus Box 7550, North Carolina State University Raleigh, NC 27695, USA, 5Institute for Molecular Biotechnology,
RWTH Aachen, 52074 Aachen, Germany and 6Plant Cell Biology Laboratory, Instituto de Tecnologia Química e Biológica, UNL, Av. República,
2781-901 Oeiras, Portugal
Email: Ana Paula Santos - [email protected]; Eva Wegel - [email protected]; George C Allen - [email protected]; William F Thompson - [email protected]; Eva Stoger - [email protected]; Peter Shaw - [email protected]; Rita Abranches* - [email protected]
* Corresponding author
Abstract
Genetic engineering of commercially important crops has become routine in many laboratories. However, the inability to predict where a transgene will integrate and to efficiently select plants with stable levels of transgenic expression remains a limitation of this technology. Fluorescence in situ hybridization (FISH) is a powerful technique that can be used to visualize transgene integration sites and provide a better understanding of transgene behavior. Studies using FISH to characterize transgene integration have focused primarily on metaphase chromosomes, because the number and position of integration sites on the chromosomes are more easily determined at this stage. However gene (and transgene) expression occurs mainly during interphase. In order to accurately predict the activity of a transgene, it is critical to understand its location and dynamics in the three-dimensional interphase nucleus. We and others have developed in situ methods to visualize transgenes (including single copy genes) and their transcripts during interphase from different tissues and plant species. These techniques reduce the time necessary for characterization of transgene integration by eliminating the need for time-consuming segregation analysis, and extend characterization to the interphase nucleus, thus increasing the likelihood of accurate prediction of transgene activity. Furthermore, this approach is useful for studying nuclear organization and the dynamics of genes and chromatin.
Background
The production of transgenic plants is now routine for many crop species and different technologies for gene transfer are available for a wide number of species, includ-ing some previously thought to be recalcitrant to
transfor-mation. However, the unpredictability of integration sites and lack of expression stability are still limitations in plant transgenic technology. Significant efforts have been made to understand the mechanisms of transgene integra-tion in the host genome (reviewed in [1]). Most studies Published: 02 November 2006
Plant Methods 2006, 2:18 doi:10.1186/1746-4811-2-18
Received: 29 July 2006 Accepted: 02 November 2006
This article is available from: http://www.plantmethods.com/content/2/1/18 © 2006 Santos et al; licensee BioMed Central Ltd.
have focused on characterizing transgene loci by sequenc-ing or genetic dissection of the integration sites. Cell biol-ogy techniques have been used to complement these molecular approaches and a great deal of information has been obtained from the visualization of transgenes by flu-orescence in situ hybridization (FISH) on metaphase spreads (e.g. [2-11]). This technique makes it possible to physically map transgene integration sites, but complex patterns of integration are often found in transgenic plants and the underlying mechanisms of transgene inte-gration are still far from being completely understood. Since predictable transgene expression is the goal, it is important to remember that most gene transcription takes place during interphase and not metaphase. We believe that visualizing transgenes and their transcripts in inter-phase nuclei can provide information about transcrip-tional competency, and that this knowledge can be used to improve prediction of transgene behavior.
There is now good evidence that the spatial organization within the cell nucleus has a strong impact on gene expression (reviewed in [12,13]). Our previous work has shown that FISH on three dimensional nuclei of trans-genic plants can provide new insights into the relation-ship between higher order chromatin structure and the expression of endogenous genes and transgenes [14-16]. We have shown that FISH can be used to better under-stand chromatin and gene organization and dynamics by following the localization of transgenes during the cell cycle [2], or by inducing architectural modifications of chromatin [14]. A number of published studies show that spatial clustering of endogenous sequences affects gene expression (reviewed in [13,17]; [18,19]). Sproul et al. [20] reviewed how chromatin structure can control not only the expression of individual genes, but also the simultaneous regulation of multiple genes, in organisms such as yeast, Drosophila and C. elegans. The ribosomal genes are the best characterized example of gene clustering in plants (e.g. [21]). However, the concept of gene cluster-ing can be extended to include transgene repeats that are integrated as multiple copies, such as we have observed in wheat [2]. FISH has proved to be an important tool for understanding the behavior of genes (endogenous or exogenous) and how they are regulated within the context of nuclear organization (reviewed in [22]). FISH can also be a valuable tool for dissecting the complex mechanisms of transgene integration in the host genome. The impor-tance of understanding the factors that influence higher order transgene organization in order to optimize trans-gene expression has been reviewed in [23]. Knowledge of these factors will improve manipulation of transgene expression stability, and thus has implications both in fundamental and applied research.
In this paper we review a set of techniques that allow the use of FISH to visualize transgene integration sites in interphase cells. We describe the preparation of whole tis-sue sections where the 3D structure of the nucleus is well preserved, isolated nuclei in which probe penetration is facilitated, and histone-depleted nuclear halos in which the arrangement of transgene insertions can be visualized in more detail relative to the nuclear matrix or DNA loop domains. We also describe the use of extended DNA fib-ers, in which it is possible to observe short genomic regions interspersed with repeated transgenes, and the localization of transgenic RNA by FISH using RNA probes. Since previous applications of FISH have focused on highly condensed, transcriptionally inactive metaphase chromosomes, we compare the information obtained from metaphase FISH to that using interphase nuclei. It is clear that both applications of FISH provide important information that complements the data from traditional techniques such as Southern hybridization and PCR. The techniques that have been developed allow the visualiza-tion of single copy transgenes and their transcripts in sev-eral different plant species. The implications of our results are discussed both from the applied perspective, for deter-mining the likely stability of transgene expression, as well as how they may increase our fundamental knowledge of the relation between nuclear structure and gene expres-sion.
Spatial organization of the transgene locus is
important for predicting transgene expression
and stability
structure is complex and also involves mechanisms such as RNA interference (originally termed post-transcrip-tional gene silencing) and transcrippost-transcrip-tional silencing. How-ever a detailed discussion of this topic is beyond the scope of this review.
In transgenic plants, the effect of epigenetic modifications on transgene expression is most evident when independ-ent transformants carrying the same transgene show dif-ferent levels of expression even when inserted at the same genetic locus [34]. There is now evidence that many of these differences are a consequence of biochemical differ-ences in chromatin at the different integration positions [26]. To date, most reports on transgene locus structure and organization have been obtained using molecular tools, such as PCR, sequencing and southern blot analy-ses, which provide information about the structure and location of the transgene integration site, although some reports have included studies on metaphase spreads, with chromosomal mapping of transgene loci using FISH. Identification of the chromosome and chromosomal regions where the transgene has been integrated provides important information on the site of transgene integra-tion, as well as possible differences in locus structure between different methods of transformation. This type of analysis has shown that there is no preference for integra-tion in particular chromosomes when particle bombard-ment is used in wheat [2], barley [7] or oat [35] transformation, but there is often a preference for integra-tion in the distal regions of the chromosome arms. For example, the majority of transgene loci in petunia [36,37] and oat ([8], [35] and references therein) are localized in telomeric or sub-telomeric regions. Iglesias et al. [38] used FISH to probe the physical location of transgene insertion in tobacco, and demonstrated that the stably-expressed inserts were in the vicinity of telomeres, whereas the unstably-expressed inserts occupied intercalary and para-centromeric locations.
We have collective experience with several plant species: wheat, rice, tobacco and Arabidopsis, as well as tobacco suspension cell cultures. Other investigators have studied many other species. This has provided a wide variety of material to study several aspects of chromosome and (trans)gene organization and expression. We have previ-ously observed clustering of transgenes in the interphase nucleus of plants containing multiple transgene integra-tion sites, which was not evident in metaphase chromo-somes. We hypothesized that the transgene sites were brought together in interphase nucleus because they were recruited to a common functional domain such as a tran-scription factory, perhaps reflecting the fact that they shared the same promoter [2]. This demonstrates the importance of using FISH on interphase nuclei to obtain information that could not be obtained by any other
method. More recently, and mostly in literature on animal systems, it has been shown that chromatin structure has a role in regulating the expression of clustered genes (reviewed in e.g. [20]). Multiple tandemly integrated cop-ies of transgenes are often generated by particle bombard-ment and may affect the structure of the chromatin surrounding the transgenes, which may in turn affect their expression and/or stability. Interestingly, introduced DNA lacking genes can also be condensed into heterochroma-tin. Pecinka et al. [39] showed that arrays of repeated lac
operators used for Green Fluorescent Protein tagging of DNA had higher frequencies of association with each other and with heterochromatin than expected, which may alter the spatial chromatin organization in the nuclei. In the recent years it has become clear that molecular anal-ysis, along with phenotypic and genotypic segregation analyses, are not sufficient to fully understand the com-plexity of transgene loci. We therefore suggest that it is essential to look at interphase nuclei to get a deeper understanding of the role of nuclear structure in the regu-lation of transgene expression.
Fluorescence
in situ
hybridization (FISH) is
essential for a full characterization of transgenic
plants
Transgene loci vary in size and complexity, and the site of integration may have properties that favor integration or selectable marker expression. Agrobacterium-mediated transformation results in a higher proportion of simple inserts than is produced using microprojectile bombard-ment. FISH of transgene loci on metaphase and pro-met-aphase chromosomes [2,11,35] and on extended DNA fibers ([40], Wegel and Shaw, unpublished]) shows that genomic interspersions in between multiple transgenes can vary in length from a few kilobases to several mega-bases. The presence of complex transgene loci suggests that these loci may also exhibit some level of transgene scrambling because transgene locus formation appears to proceed via Illegitimate Recombination (IR) [8,23,41] regardless of the DNA delivery method. Transgene scram-bling can cause problems with gene expression because complex transgene loci are often associated with trans-gene silencing. Understanding the processes that occur during integration is more likely to lead to strategies for producing stably expressing transgenic plants. As the sen-sitivity of FISH techniques improves, more information can be gained and integration events can be better charac-terized.
Sensitivity of FISH for in situ detection of transgenes – detection of single-copy genes
a tool in basic and applied research because detection is sensitive and allows discrimination of multiple targets in the same sample. The efficiency and sensitivity of FISH depends on the accessibility of the cytological targets and the size of the probes. In FISH, as with most labeling tech-niques in cell biology, there is a compromise between optimal preservation of cell and tissue morphology and accessibility to labeling reagents [43]. Thus the need for good ultrastructural preservation may limit the sensitivity of FISH for mapping DNA sequences on plant chromo-somes. In general the target DNA sequences have been limited to large or high copy number inserts from 10 to 60 kb (e.g. [35,44]). Technical difficulties in detecting single or low copy number target sequences are partly due to the large proportion of non-target repeat sequences, which in some cases are more than 90% of the genome [45]. There are some reports on the detection of small, single copy DNA sequences in plants; table 1 includes examples where single or low copy number transgenes and some endogenous genes have been analyzed by FISH. For exam-ple, a successful detection of one or two copies of T-DNA to metaphase chromosomes of Petunia hybrida was per-formed using a 2.7 Kb probe [46]. Detection of targets as small as 4 Kb in maize interphase nuclei has also been reported [47]. To date, the shortest reported unique DNA sequence localized on mitotic plant chromosomes is 684 bp in Beta vulgaris [48].
Methods such as Tyramide-FISH, in which signals can be amplified by the enzymatic deposition of fluorochrome-conjugated tyramide, have been adapted for plants and target sequences as small as 710 bp on Allium cepa mitotic chromosomes have be detected [49]. Another approach to increase FISH sensitivity is the use of primed in situ DNA labeling (PRINS, [50]). PRINS uses a primer-based ampli-fication of the target DNA in a chromosomal preparation containing fluorescent-labeled nucleotides. Menke et al. [51] have compared the sequence resolution of PRINS versus FISH on plant chromosomes and found that PRINS
was useful for the detection of high copy number repeats, but could not be used to detect a low copy number gene family. A more sensitive modification, called cycling-PRINS (C-cycling-PRINS), has since been developed. This tech-nique includes the use of thermal cycling, similar to PCR, and has been reported to be able to detect low copy number repeats [52,53].
Increasing the sensitivity of photometric detection has also allowed the visualization of smaller sequences. For example, the use of a cooled charge-coupled device (CCD) camera can increase the detection sensitivity 30-fold compared with simpler digital cameras or film. For DNA-FISH, unique sequences of 1–2 kb can be detected on metaphase chromosomes with a resolution of about 3 Mbp. With FISH on highly decondensed chromatin (i.e. naked DNA fibers) a sensitivity of 200 bp and a genomic resolution of about 1 Kb can be obtained. However the efficiency of DNA-FISH decreases as the target DNA becomes smaller. The intensity of signals from small tar-gets indicates that the sensitivity of DNA-FISH is only in part determined by the ability to generate sufficient pho-tons for detection. Other factors such as accessibility, DNA loss, and in situ renaturation of the DNA target and probe sequences are equally important. In chromosomal and fiber-FISH a considerable level of noise is manageable as the specificity of the signals can often be verified by positional information.
FISH can be applied to distinct cytological
targets
The sensitivity and resolution of FISH on interphase chro-matin depends on the cytological target it is applied to, and mainly on the state of chromatin condensation (see reviews [54-56]). We have performed FISH on interphase nuclei with progressively lower levels of chromatin com-paction: (1) well preserved 3D structures in thick root tis-sue sections prepared with a vibratome; (2) isolated nuclei that maintain their 3D structure although extracted
Table 1: Sensitivity of FISH to detect single or low copy genes or transgenes.
Plant Species Target DNA Phase of Cell Cycle Probe size Reference
Petroselium crispum Endogenous Metaphase 6,6 Kb [104]
Oryza sativa T-DNA Metaphase 5,6 Kb [3,105]
Oryza sativa T-DNA Metaphase 5,5 Kb [106]
Zea mays T-DNA Meiosis (pachytene) 3,1 Kb [107]
Zea mays Endogenous Meiosis (pachytene) 3,1 Kb [108]
Petunia hybrida T-DNA Metaphase 2.7 Kb [46]
Triticum aestivum Bombardment Interphase nuclei and metaphase chromosomes 1.8 Kb [2,14]
Asparagus officinalis Endogenous Interphase nuclei and metaphase chromosomes 1,4 Kb/1,7 Kb [109]
Oryza sativa Endogenous Metaphase 1,29 Kb [110]
Petunia hybrida T-DNA Metaphase 4 Kb [36]
Allium cepa T-DNA Metaphase 710 bp [49]
from a tissue; (3) histone depleted nuclei or nuclear halos; and (4) extended DNA fibers.
FISH in interphase nuclei of 3D well preserved tissue sections
Vibratome tissue sections analyzed by confocal micros-copy have been used to study the 3D organization of cen-tromeres, telomeres, chromosomes, transgenes and other genomic sequences contained within bacterial artificial chromosome probes (BACs) in interphase nuclei of wheat tissues e.g. anthers, roots, endosperm and embryos [2,14,16,43,57,58], rice root tissue [59,60], tobacco root tissue [Abranches, unpublished] and Arabidopsis roots [61]. In all cases good preservation of the tissue structure has been achieved. For sectioned material, most fixatives are based on agents such as formaldehyde. A small amount of glutaraldehyde is sometimes added to the fixa-tive; however the glutaraldehyde concentration should be kept low (0.05–0.1%) as it may induce autofluorescence in the tissues. Extended periods of fixation or high con-centration of fixative may reduce accessibility, so a com-promise must be made in order to preserve adequate structure while retaining accessibility [62]. Transgenic DNA can be detected by FISH using labeled DNA as a probe in tissue sections. The probe needs to penetrate into the tissue and gain access to the interior of the nuclei. Thus, several pretreatments must be performed and these will depend on the tissue type and on the species. The size of the probe is also crucial; the optimal size of DNA frag-ments for labeling is between 100–500 bp. For specific targeting of the transgene sequence, it is possible to use the isolated coding sequence of the transgene for labeling instead of the whole plasmid ([5]; Abranches, unpub-lished results).
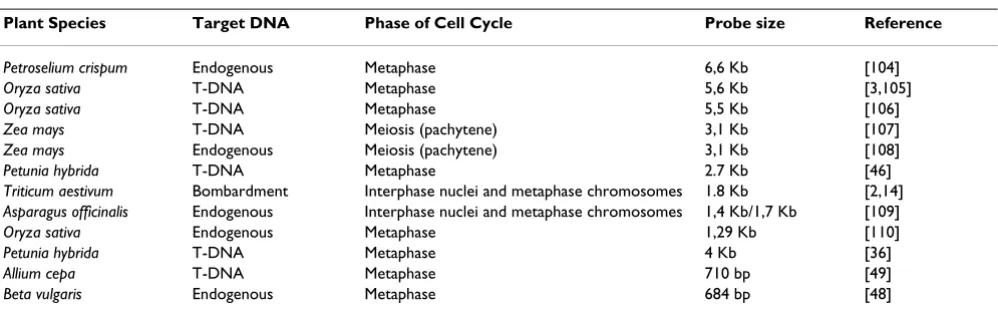
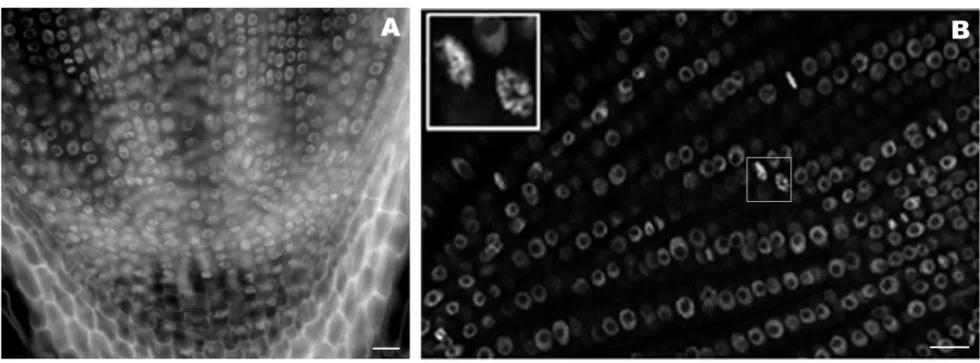
In figure 1 we show a fixed 20 μm thick rice root section prepared with a vibratome. The DNA is stained with 4',6-diamidino-2-phenylindole (DAPI). The root-tip was pre-viously fixed with 4% formaldehyde, freshly made from paraformaldehyde, and the tissue structure is well pre-served. Figure 2 shows FISH images of transgenic DNA from root tissue sections from different plant species, including wheat (2A), rice (2B) and tobacco (2C). The wheat line in figure 2A contains only two copies of the GUS gene [2]. The two copies can be seen as a single signal within the nucleus. Thus each nucleus contains two dots, each one corresponding to one of the homologous chro-mosomes (Fig. 2A). This demonstrates the high sensitivity of the technique. The tobacco line shown in Figure 2C contains 7 copies of the GUS gene [63]. The transgenic rice line shown in figure 2B is more complex and produces four transgene-derived polypeptide chains [64], which result from co-transformation using four separate plas-mids encoding four antibody components (the secretory component; the light chain; the heavy chain; and the
join-ing chain), resultjoin-ing in the assembly of a secretory anti-body. FISH probes were prepared from a mix of the four plasmids that were used in co-transformation. When lines are homozygous, an even number of spots is visible. Inter-estingly, two discrete transgenic loci are seen in figure 2B. The arrangement of transgenes as well as their relative position is also informative, as has been discussed previ-ously [2,14]. For studies on thick tissue sections it is pref-erable to use a confocal microscope, which allows for a detailed analysis through the depth of the tissue and sub-sequent 3D reconstruction of the nuclei.
Isolated interphase nuclei of plants or plant cell lines
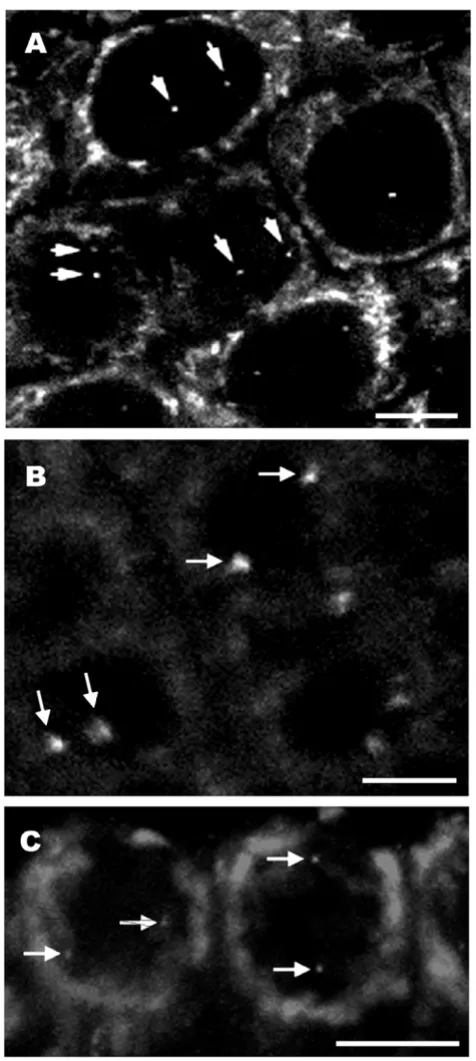
Good preservation of nuclear structure is also obtained for isolated nuclei made by chopping the plant tissue with a razor blade in a suitable stabilizing buffer. In this method, the nuclei are spun onto a glass slide where they adhere and retain much of their 3-dimensional organization, as can be confirmed by confocal microscopy analysis. The same procedure can also easily be applied to cell suspen-sion cultures, which divide rapidly compared to most plant tissues. This is a very informative approach for stud-ying cell cycle changes. In figure 3, isolated nuclei from transgenic tobacco plants visualized with a CCD camera are shown. In panels 3A and 3B a single nucleus is shown, stained with DAPI (3A), and labeled by FISH (3B). This nucleus originates from a double haploid tobacco trans-genic plant line that contains 7 copies of the GUS gene per haploid genome [63]. Two spots are visible, presumably corresponding to a single locus on each of a pair of homologous chromosomes. In panels 3C and 3D we show other isolated nuclei from NT1 tobacco suspension cell lines expressing luciferase [65]. Different transgene integration patterns are shown. Figure 3C demonstrates the detection of a single copy luciferase gene using a luc
fragment probe in a cell line from [65]. Figure 3D allows us to make a comparison with a cell line containing 48 copies of luciferase, as estimated by competitive PCR [66].
Histone-depleted nuclear halos
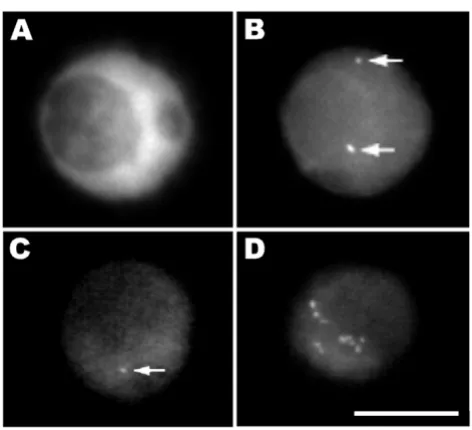
might alter matrix association. We performed FISH on nuclear halos using the transforming plasmid as the probe and collected images using a CCD camera. Figure 4 shows a nuclear halo prepared from the root tip cells of a tobacco line containing 60 copies of the transgene. In figure 4A, the DNA is stained with DAPI and the faintly fluorescent dispersed DNA fibers are seen as a halo spreading outside the brightly stained residual nucleus. In figure 4B, the FISH signal on the halo appears as long strings of dots. In the nucleus prior to histone removal the genes are pack-aged and appear as a compact dot. When the histones are removed, the DNA is unpackaged (halos), resulting in a string of genes (dots). This technique allows the visualiza-tion of the relative posivisualiza-tioning of genes to the nuclear matrix.
FISH on extended DNA fibers
Another development of the FISH technique is its applica-tion to extended fibers, which are usually prepared by detergent extraction of DNA from isolated nuclei. The naked DNA is then stretched by allowing it to run down a tilted slide. The sensitivity of FISH is greatly enhanced because without histones and other chromatin-bound proteins the DNA is more accessible to probes and detec-tion reagents. Thus, with this method the detecdetec-tion of DNA targets as small as a few hundred base pairs becomes feasible [73]. The fiber FISH methodology has superior mapping resolution compared to interphase nuclei. For example, using probes hybridized to targets in the 45S rDNA genes of tomato it was possible to detect DNA target sequences as small as 700 bp [74]. The hybridization of T-DNA sequences in transgenic potato plants to extended
DNA fibers revealed that T-DNA copies are closely inte-grated. Moreover, by using probes to T-DNA and vector sequences the composition and arrangement of inserts can be assessed [75]. FISH on DNA fibers has enabled (1) assessment of the effect of differences in probe length and the mapping of different probes relative to one another, providing detailed information on gene structure [76-82]; (2) analysis of the structure of repetitive DNA sequence families [74,81,83-85]; (3) analysis of transgenic DNA ([4,40,75]; Wegel, unpublished results]). We have used FISH to analyze the organization of a complex transgene locus comprising two different plasmids containing genomic fragments coding for two high molecular weight glutenins in Triticum aestivum. In figure 5, we show FISH with probes for the vector and the transgenic glutenin fragments on DNA fibers isolated from endosperm, visu-alized with a cooled CCD camera. The FISH signals show the transgene arrangement along the linearized chromo-somal DNA demonstrating once again that loci generated by microprojectile bombardment are complex and con-tain numerous interspersions of genomic DNA.
Simultaneous detection of transgenic DNA and
RNA
The analysis of transgene expression is typically based on the steady-state level of mRNA or protein, which is extracted from the transgenic material. Methods to meas-ure mRNA level include RT-PCR, Northern blotting, serial analysis of gene expression (SAGE) and microarray tech-niques. More recently, a technique based on Chromatin Immunoprecipitation named RNAPol-ChIP has been devised which allows analysis of real time gene
transcrip-Rice root tissue section labeled with DAPI Figure 1
Transgene sites in 3D interphase nuclei of wheat (A), rice (B) and tobacco (C) root tissue sections Figure 2
tion [86]. However, in all of these techniques the structure is destroyed and thus they are not suitable for examina-tion of the expression of specific genes in small amounts of tissue, nor do they allow localization of the expression of a particular gene in specific cells or tissues. Moreover, results from these methods for gene expression reflect an average of expression from many cells. Therefore, tech-niques have been developed for microscopic visualization of RNA abundance and distribution, in particular the quantification and visualization of mRNA transcripts in individual cells [87-92].
Earlier observations with simultaneous DNA (DNA FISH) and RNA hybridization (RNA FISH) showed that in 90% of cells the gene was directly associated with an RNA track or focus. This observation provided confirmation that the transcript foci and tracks represented the sites of transcrip-tion, with the DNA positioned at or near one end of the RNA track [93,94]. Later, Van de Corput and Grosveld [95] were able to detect by RNA-FISH the primary tran-scripts of the human embryonic, fetal and adult globins in erythroid cells, and related expression patterns with other
parameters such as cell type, cell cycle, replication, and stage of differentiation. More recently, the visualization of RNA has provided correlations between chromatin struc-ture and gene expression upon transcriptional activation both in animal [92,96-99] and plant cells [15,16].
The ability to visualize the expression of many genes simultaneously within individual cells with high spatial and temporal resolution can help the understanding of relationships among genes in single nuclei. For example, Levsky et al. [89] showed that genes are not continuously transcribed, implying that individual cells have unique patterns of gene transcription. A similar observation was also reported by Osborne et al. [96] who showed that upon transcription distant genes co-localize to the same transcription factory whereas identical, temporarily non-transcribed alleles do not. These authors have used a com-bination of 3D FISH, immunofluorescence and chromo-some conformation capture (3C) to assess the spatial organization for several genes in a mouse chromosome. The 3C technique allows determination of the relative fre-quencies with which different sites interact with each other [100]. Osborne et al. [96] determined the percent-age of colocalization of the RNA-FISH and the corre-sponding DNA signals, as well as the colocalization of widely separated genes when these genes are being tran-scribed, and concluded that colocalization of genes is transcription-dependent. These studies also indicated that the most active genes undergo transcription on-off cycles, which correlate with occupancy of transcription factories during the on stage. Recently, by using a modification of
Transgene sites visualized in tobacco isolated nuclei Figure 3
Transgene sites visualized in tobacco isolated nuclei. In panels A and B a single nucleus is shown, stained with DAPI (3A), and labeled by FISH (3B). This nucleus originates from a dou-ble haploid tobacco transgenic plant line that contains 7 cop-ies of the GUS gene [63]; two signals, each corresponding to a homologous chromosome, are clearly visible (arrows). In panels C and D two isolated nuclei from independent NT1 tobacco suspension cell lines expressing luciferase are shown [65]. Panel C demonstrates the detection of a single copy luciferase gene using a luc fragment probe. Panel D shows a nucleus with multiple insertions in a total of 48 transgene copies. Bar, 10 μm.
Transgene sites visualized in nuclear halos from a tobacco plant line, which contains 60 transgene copies [63] Figure 4
3C and FISH, Ling et al. [98] found the colocalization of distinct DNA segments located on different chromo-somes. All these observations provide evidence to support the idea that genes are dynamically recruited to transcrip-tion sites, in agreement with the transcriptranscrip-tion factory hypothesis of Cook et al. (e.g. [101,102]). These mecha-nisms are likely to occur in the same way in plants although this has yet to be demonstrated. In another approach, Janiki et al. [92]used an inducible system in which a 200 copy transgene array of inducible transcrip-tion units was stably integrated into a euchromatic region of chromosome 1 in human cells. With this system they were able to observe that prior to transcriptional activa-tion the transgene array is highly condensed and hetero-chromatinized. After the induction of transcription the RNA levels at the transcription site increased immediately. In plants, Wegel et al. [16] have used two wheat transgenic lines containing about 20 and 50 copies each of the HMW glutenin genes (HMW) which are developmentally acti-vated in the endosperm at about 8 days after anthesis. They observed that, in non-expressing tissue, each trans-gene locus consists of one or two highly condensed sites, which decondense into many foci upon activation of tran-scription in endosperm nuclei.
The sensitivity of mRNA FISH is not very well defined. Van de Corput and Grosveld [95]estimated detection sensitiv-ity as being of the order of 10 copies of a primary globin RNA transcript using oligonucleotide probes. They also demonstrated that different probes show different sensi-tivities even when the base composition is similar. This is probably due to the secondary structure of the RNA or its association with protein complexes which could render part of the RNA less accessible for hybridization.
In plants, the visualization of transcripts in different tis-sues has been accomplished by in situ hybridization of
labeled single-stranded, antisense probes to specific mRNA sequences in semi-thin sections of plant tissue. This technique is especially valuable when a developmen-tally regulated and/or tissue-specific promoter is used to regulate transgene expression. For transgenic plants, a technique of two-color in situ hybridization using two gene-specific RNA probes labeled with different tags pro-vides an extremely powerful tool for comparing the spa-tial expression patterns of two genes in a specific tissue/ organ; for example, expression of the selective marker gene and the gene of interest.
In figure 6 we show localization of RNA in wheat root tis-sue sections (Fig. 6A), wheat endosperm (Fig. 6D), tobacco tissue sections (Fig. 6B) and tobacco nuclei (Fig. 6C). The sections were made in a vibratome, which pre-serves the cell and tissue structure well. In figure 6A, GUS transcript is shown in root tissue sections of a transgenic wheat line which contains two loci of the GUS transgene [2,14]. Along the wheat root section the RNA is particu-larly abundant in the xylem vessel cells which are clearly distinguished by a substantial increase in the size of the cell nucleus in comparison with the surrounding tissues. Endoreduplication has been shown to occur in these cells [103] and there is good evidence that after many endore-duplication events, the replicated chromosomes tend to remain together [103]. The increase in ploidy in these cells may be correlated with the higher transcription level seen in them. We have also investigated the localization of transcripts in whole tissue sections of root tips (Fig. 6B) and in isolated nuclei (Fig. 6C) of transgenic tobacco lines containing the GUS reporter gene. The GUS gene tran-script shown in figure 6B has no intron. Thus, most of the FISH signal corresponds to nascent transcript at the locus and only relatively small pools of transcript are detected around the locus. A similar observation was reported by Wegel et al. [16], who localized intronless nascent
HMW-Extended DNA fibers isolated from wheat endosperm Figure 5
glutenin transcripts within the nucleus of transgenic wheat and observed that the main RNA signal in the nucleus was always restricted to the close vicinity of the locus. Figure 6D shows a wheat endosperm nucleus hybridized with probes to visualize simultaneously the glutenin genes and their transcripts. The transcript was localized in the vicinity of the gene. In other experiments, we have detected small tracks emanating from the gene locus such as in the tobacco nucleus shown in figure 6C, which has also been observed in animal studies [93]. The
in situ visualization of transcripts offers new insights into transgene expression analysis since variable expression levels can be detected in situ at cellular level. Moreover the physiological state of cells and the cell type within tissues can be correlated with a specific pattern of gene expres-sion.
Conclusion
In this report we present a practical assembly of useful techniques to visualize transgene organization in the interphase nucleus, when most genes are being actively transcribed and potentially interacting with each other.
We have gathered data that contribute to a better under-standing of: (1) the mechanisms involved in the stable and predictable expression of transgenes; (2) how differ-ent copies of the gene are positionally related; (3) the interactions between transgene copies integrated in differ-ent loci; (4) whether all transgene copies are active and how this is related to their position in the nucleus. All this information has a clear impact on the unraveling of struc-ture-function relationships in the nucleus. In addition, the knowledge of transgene organization in the three dimensional interphase nucleus may also be crucial to better understand the relation between gene location and its activity. In plants, foreign DNA is thought to integrate randomly into the genome, which has been considered a major problem for plant transformation. Thus it is advan-tageous to select the lines of interest at an early stage by performing a full characterization of the transgene inte-gration sites.
Transgene organization can be used as a tool to approach fundamental questions of nuclear organization, chroma-tin dynamics, and gene expression. We have shown
DNA-Transgenic RNA visualized in 3D interphase nuclei of root tissue sections from wheat (A), tobacco (B) and of an isolated tobacco nucleus (C)
Figure 6
FISH on four distinct states of decondensation, from well preserved 3D nuclei within intact tissue sections to the least compact state of chromatin: extended DNA fibers. Intact nuclei, either isolated or in tissue sections, preserve the three dimensional structure and provide the relative positioning of transgene loci. On the other hand, nuclear halos and DNA fibers allow for a higher resolution and finer detail of the locus structure. Together with chromo-somal mapping of transgene loci using FISH, the methods described here provide a complete characterization of transgenic loci, which is fundamental to complement molecular analyses using PCR, sequencing and southern blotting.
We have shown that FISH to localize transgenic DNA can also be combined with in situ analysis of RNA, and there-fore both gene and transcript can be seen in the same preparation. This type of experiment has only occasion-ally been carried out in plants as yet, but we believe that it will be more common in the future. It has been widely debated whether there is a correlation between the loca-tion of a transgene and regulaloca-tion of its expression, and whether transgene copies integrated at different loci are all active. Further clarification of these issues needs efficient methods for in situ detection of the transgene within its genomic environment together with 3-dimensional microscopy and image analysis.
Competing interests
The author(s) declare that they have no competing inter-ests.
Authors' contributions
APS carried out experiments on rice (Fig. 1 and Fig. 2B) and wheat (Fig. 2A and Fig. 6A) and co-wrote the manu-script. EW carried out experiments with DNA fibers (Fig. 5) and double DNA-RNA FISH (Fig. 6D). GCA and WFT guided experiments with transgenic tobacco lines and par-ticipated in writing the manuscript. ES provided the rice transgenic lines and contributed to the manuscript. PS supervised the work on rice and wheat and contributed to the manuscript. RA performed the experiments on tobacco (Fig. 2C, Fig. 3, Fig. 4, Fig. 6B and 6C) and co-wrote and coordinated the writing of the manuscript. All authors read and approved the final manuscript.
Acknowledgements
We thank Randall Shultz for revision of the manuscript. APS is funded by Fundação para a Ciência e Tecnologia (FCT), Portugal (Postdoc Fellowship BPD/3562/2000). RA is funded by FCT, Portugal (Laboratório Associado and Grant POCI/BIA-BCM/55762/2004). Work carried out in the lab of PS was funded by the Biotechnology and Biological Sciences Research Council (BBSRC) of the UK. Work carried out in the lab of WFT was supported by grants from the National Science Foundation, USA.
References
1. Somers DA, Makarevistch I: Transgene integration in plants: poking or patching holes in promiscuous genomes? Curr Opin Biotech 2004, 15:126-131.
2. Abranches R, Santos AP, Wegel E, Williams S, Castilho A, Christou P, Shaw P, Stoger E: Widely separated multiple transgene inte-gration sites in wheat chromosomes are brought together at interphase. Plant J 2000, 24:713-723.
3. Dong J, Kharb P, Cervera M, Hall TC: The use of FISH in chromo-somal localization of transgenes in rice. Methods Cell Sci 2001,
23:105-113.
4. Jackson SA, Zhang P, Chen W, Phillips R, Friebe B, Muthukrishnan S, Gill BS: High-resolution structural analysis of biollistic trans-gene integration into the nuclear genome of wheat. Theor Appl Genet 2001, 103:56-62.
5. Salvo-Garrido H, Travella S, Schwarzacher T, Harwood WA, Snape JW: An efficient method for the physical mapping of trans-genes in barley using in situ hybridization. Genome 2001,
44:104-110.
6. Salvo-Garrido H, Travella S, Bilham LJ, Harwood WA, Snape JW: The distribution of transgene sites in barley determined by phys-ical and genetic mapping. Genetics 2004, 167:1371-1379. 7. Choi HW, Lemaux PG, Cho MJ: Use of fluorescence in situ
hybridization for gross mapping of transgenes and screening for homozygous plants in transgenic barley (Hordeum vulgare
L.). Theor Appl Genet 2002, 106:92-100.
8. Svitashev SK, Pawlowski WF, Makarevitch I, Plank DW, Somers DA:
Complex transgene locus structures implicate multiple mechanisms for plant transgene rearrangement. Plant J 2002,
32:433-445.
9. Romano A, Raemakers K, Bernardi J, Visser R, Mooibroek H: Trans-gene organisation in potato after particle bombardment-mediated (co)transformation using plasmids and gene cas-settes. Transgenic Res 2003, 12:461-473.
10. Harwood WA, Bilham LJ, Travella S, Salvo-Garrido H, Snape JW: Flu-orescence in situ hybridization to localize transgenes in plant chromosomes. Methods Mol Biol 2005, 286:327-40.
11. Travella S, Ross SM, Harden J, Everett C, Snape JW, Harwood WA:
A comparison of transgenic barley lines produced by particle bombardment and Agrobacterium-mediated techniques.
Plant Cell Rep 2005, 23:780-789.
12. Vershure PJ: Positioning the genome within the nucleus. Biol Cell 2004, 96:569-577.
13. Dillon N: Gene regulation and large-scale chromatin organi-zation in the nucleus. Chromosome Res 2006, 14:117-126. 14. Santos AP, Abranches R, Stoger E, Beven A, Viegas W, Shaw PJ: The
architecture of interphase chromosomes and gene position-ing are altered by changes in DNA methylation and histone acetylation. J Cell Sci 2002, 115:4597-4605.
15. Wegel E, Shaw PJ: Gene activation and deactivation related changes in the three-dimensional structure of chromatin.
Chromosoma 2005, 114:331-337.
16. Wegel E, Vallejos RH, Christou P, Stoger E, Shaw PJ: Large-scale chromatin decondensation induced in a developmentally activated transgene locus. J Cell Sci 2005, 118:1021-1031. 17. Stein GS, Zaidi SK, Braastad CD, Montecino M, van Wijnen AJ, Choi
J-Y, Stein JL, Lian JB, Javed A: Functional architecture of the nucleus: organizing the regulatory machinery for gene expression, replication and repair. Trends Cell Biol 2003,
13:584-591.
18. Chambeyron S, Bickmore WA: Chromatin decondensation and nuclear reorganization of the HoxB locus upon induction of transcription. Gene Dev 2004, 18:1119-1130.
19. Chambeyron S, Da Silva NR, Lawson KA, Bickmore WA: Nuclear re-organisation of the Hoxb complex during mouse embry-onic development. Development 2005, 132:2215-2223.
20. Sproul D, Gilbert N, Bickmore WA: The role of chromatin struc-ture in regulating the expression of clustered genes. Nat Rev Genet 2005, 6:775-781.
21. Shaw P, Doonan J: The nucleolus. Playing by different rules? Cell Cycle 2005, 4:102-105.
22. Tessadori F, Van Driel R, Fransz P: Cytogenetics as a tool to study gene regulation. Trends Plant Sci 2004, 9:147-153.
23. Kohli A, Twyman RM, Abranches R, Wegel E, Stoger E, Christou P:
24. Strahl BD, Allis CD: The language of covalent histone modifica-tions. Nature 2000, 403:41-45.
25. Jenuwein T, Allis CD: Translating the histone code. Science 2001,
293:1074-1080.
26. Loidl P: A plant dialect of the histone language. Trends Plant Sci
2004, 9:84-90.
27. Lesne A, Victor JM: Chromatin fiber functional organization: Some plausible models. Eur Phys J E 2006, 19:279-290. 28. Fuchs J, Demidov D, Houben A, Schubert I: Chromosomal histone
modification patterns-from conservation to diversity. Trends Plant Sci 2006, 11:199-208.
29. Earley K, Lawrence RJ, Pontes O, Reuther R, Enciso AJ, Silva M, Neves N, Gross M, Viegas W, Pikaard CS: Erasure of histone acetylation by Arabidopsis HDA6 mediates large-scale gene silencing in nucleolar dominance. Genes Dev 2006, 20:1283-1293.
30. Huettel B, Kanno T, Daxinger L, Aufsatz W, Matzke AJM, Matzke M:
Endogenous targets of RNA-directed DNA methylation and Poly IV in Arabidopsis. EMBO J 2006, 25:2828-2836.
31. Gendrel AV, Lippman Z, Martienssen R, Colot V: Profiling histone modification patterns in plants using genomic tiling microar-rays. Nat Methods 2004, 2:213-218.
32. Lippman Z, Gendrel AV, Colot V, Martienssen R: Profiling DNA methylation patterns using genomic tiling microarrays. Nat Methods 2005, 2:219-224.
33. Gorish SM, Wachsmuth M, Toth KF, Lichter P, Rippe K: Histone acetylation increases chromatin accessibility. J Cell Sci 2005,
118:5825-5834.
34. Day CD, Lee E, Kobayashi J, Holappa LD, Albert H, Ow DW: Trans-gene integration into the same chromosome location can produce alleles that express at a predictable level, or alleles that are differentially silenced. Genes Dev 2000, 14:2869-2880. 35. Svitashev SK, Ananiev E, Pawlonski WP, Somers DA: Association of
transgene integration sites with chromosome rearrange-ments in hexaploid oat. Theor Appl Genet 2000, 100:872-880. 36. ten Hoopen R, Robbins TO, Fransz PF, Montijn BM, Oud O, Gerats
A, Nanninga N: Localization of T-DNA insertions in Petunia by fluorescence in situ hybridization: physical evidence for sup-pression of recombination. Plant Cell 1996, 8:823-830.
37. ten Hoopen R, Montijn BM, Veuskens JT, Oud OJ, Nanninga N: The spatial localization of T-DNA insertions in petunia inter-phase nuclei: consequences for chromosome organization and transgene insertion sites. Chromosome Res 1999, 7:611-623. 38. Iglesias VA, Moscone EA, Papp I, Neuhuber F, Michalowski S, Phelan T, Spiker S, Matzke M, Matzke AJM: Molecular and cytogenetic analyses of stably and unstably expressed transgene loci in tobacco. Plant Cell 1997, 9:1251-1264.
39. Pecinka A, Kato N, Meister A, Probst AV, Schubert I, Lam E: Tan-dem repetitive transgenes and fluorescent chromatin tags alter local interphase chromosome arrangement in Arabi-dopsis thaliana. J Cell Sci 2005, 118:3751-3758.
40. Svitashev SK, Somers DA: Genomic interspersions determine the size and complexity of transgene loci in transgenic plants produced by microprojectile bombardment. Genome 2001,
44:691-697.
41. Takano M, Egawa H, Ikeda JE, Wakasan K: The structures of inte-gration sites in transgenic rice. Plant J 1997, 11:353-361. 42. Gall JG, Pardue ML: Formation and detection of RNA-DNA
hybrid molecules in cytological preparations. Proc Natl Acad Sci
1969, 63:378-383.
43. Aragon-Alcaide L, Beven A, Moore G, Shaw P: The use of vibratome sections of cereal spikelets to study anther devel-opment and meiosis. Plant J 1998, 14:503-508.
44. Pawlowski WP, Somers DA: Transgenic DNA integrated into the oat genome is frequently interspersed by host DNA. Proc Natl Acad Sci USA 1998, 95:12106-12110.
45. Heslop-Harrison JS: Comparative Genome Organization in Plants: From Sequence and Markers to Chromatin and Chromosomes. Plant Cell 2000, 12:617-635.
46. Fransz PF, Stam M, Montijn B, Ten Hoopen R, Wiegnant J, Kooter JM, Oud O, Nanninga N: Detection of single-copy genes and chro-mosome rearrangements in Petunia hybrida by fluorescence
in situ hybridization. Plant J 1996, 9:767-774.
47. Jiang J, Hulbert SH, Gill BS, Ward DC: Interphase fluorescence in situ hybridization mapping: a physical mapping strategy for plant species with large complex genomes. Mol Gen Genet
1996, 252:497-502.
48. Desel C, Jung C, Cai DG, Kleine M, Schmidt T: High-resolution mapping of YACs and the single-copy gene Hs1pro-1 on Beta
vulgaris chromosomes by multi-color fluorescence in situ
hybridization. Plant Mol Biol 2001, 45:113-122.
49. Khrustaleva LI, Kik C: Localization of single-copy T-DNA inser-tion in transgenic shallots (Allium cepa) by using ultra-sensi-tive FISH with tyramide signal amplification. Plant J 2001,
25:699-707.
50. Koch JE, Kolvraa S, Petersen KB, Gregersen N, Bolund L: Oligonu-cleotide-priming methods for the chromosome-specific labelling of alpha satellite DNA in situ. Chromosoma 1989,
98:259-265.
51. Menke M, Fuchs J, Schubert I: A comparison of sequence resolu-tion on plant chromosomes: PRINS versus FISH. Theor Appl Genet 1998, 97:1314-1320.
52. Kubalakova M, Macas J, Dolezel J: Mapping of repeated DNA sequences in plant chromosomes by PRINS and C-PRINS.
Theor Appl Genet 1997, 94:758-763.
53. Kubalakova M, Vrana J, Cihalikova J, Lysak MA, Dolezel J: Localisa-tion of DNA sequences on plant chromosomes by PRINS and C-PRINS. Methods Cell Sci 2001, 23:71-82.
54. Bowler C, Benvenuto G, Laflamme P, Molino D, Probst AV, Tariq M, Paszkowski J: Chromatin techniques for plant cells. Plant J 2004,
39:776-789.
55. Ohmido N, Fukui K: Recent advances in FISH analysis of plant chromosomes. Recent Res Dev Biochem 2004, 5:267-279. 56. Kato A, Vega JM, Han F, Lamb JC, Birchler JA: Advances in plant
chromosome identification and cytogenetics techniques.
Curr Opin Cell Biol 2005, 8:148-154.
57. Abranches R, Beven AF, Aragón-Alcaide L, Shaw P: Transcription sites are not correlated with chromosome territories in wheat nuclei. J Cell Biol 1998, 143:5-12.
58. Wegel E, Shaw PJ: Chromosome organization in wheat endosperm and embryo. Cytogenet Genome Res 2005,
109:175-180.
59. Prieto P, Santos AP, Moore G, Shaw P: Chromosomes associate premeiotically and in xylem vessel cells via their telomeres and centromeres in diploid rice (Oryza sativa). Chromosoma
2004, 112:300-307.
60. Santos AP, Shaw PJ: Interphase chromosomes and the Rabl configuration: does genome size matter? J Microsc 2004,
214:201-6.
61. Costa S, Shaw P: Chromatin organization and cell fate switch respond to positional information in Arabidopsis. Nature
2006, 439:493-6.
62. Schwarzacher T, Heslop-Harrison JS: Practical in situ Hybridiza-tion. Oxford, UK: Bios; 2000.
63. Ulker B, Allen GC, Thompson WF, Spiker S, Weissinger AK: A tobacco matrix attachment region reduces the loss of trans-gene expression in the progeny of transgenic tobacco plants.
Plant J 1999, 18:253-263.
64. Nicholson L, Gonzalez-Melendi P, van Dolleweerd C, Tuck H, Perrin Y, Ma JKC, Fischer R, Christou P, Stoger E: A recombinant mul-timeric immunoglobulin expressed in rice shows assembly dependent subcellular localization in endosperm cells. Plant Biotechnol J 2005, 3:115-127.
65. Abranches R, Shultz RW, Thompson WF, Allen GC: Matrix Attach-ment Regions and regulated transcription increase and sta-bilize transgene expression. Plant Biotechnol J 2005, 3:535-543. 66. Callaway AS, Abranches R, Scroggs J, Allen GC, Thompson WF:
High-throughput transgene copy number estimation by competitive PCR. Plant Mol Biol Rep 2002, 20:265-277.
67. Wiegant J, Kalle W, Mullenders L, Brookes S, Hoovers JMN, Dauw-erse JG, van Ommen GJB, Raap AK: High-resolution in situ
hybridization using DNA halo preparations. Hum Mol Genet
1992, 1:587-591.
68. Gerdes MG, Carter KC, Moen PT, Lawrence JB: Dynamic changes in the higher-level chromatin organization of specific sequences revealed by in situ hybridization to nuclear halos.
J Cell Biol 1994, 126:289-304.
69. Goetze S, Huesemann Y, Baer A, Bode J: Functional Characteri-zation of Transgene Integration Patterns by Halo Fluores-cence in situ Hybridization: Electroporation versus Retroviral Infection. Biochemistry 2003, 42:7035-7043.
Publish with BioMed Central and every scientist can read your work free of charge
"BioMed Central will be the most significant development for disseminating the results of biomedical researc h in our lifetime."
Sir Paul Nurse, Cancer Research UK
Your research papers will be:
available free of charge to the entire biomedical community
peer reviewed and published immediately upon acceptance
cited in PubMed and archived on PubMed Central
yours — you keep the copyright
Submit your manuscript here:
http://www.biomedcentral.com/info/publishing_adv.asp
BioMedcentral
71. Mirkovitch J, Mirault ME, Laemmli UK: Organization of the higher-order chromatin loop: specific DNA attachment sites on nuclear scaffold. Cell 1984, 39:223-232.
72. Hall G Jr, Allen GC, Loer DS, Thompson WF: Nuclear Scaffolds and scaffold-attachment regions in higher plants. Proc Natl Acad Sci USA 1991, 88:9320-9324.
73. Weier HUG: DNA fiber mapping techniques for the assembly of high resolution physical maps. J Histochem Cytochem 2001,
49:939-948.
74. Fransz PF, Alonso-Blanco C, Liharska TB, Peeters AJM, Zabel P, de Jong HJ: High resolution physical mapping in Arabidopsis thal-iana and tomato by fluorescence in situ hybridization to extended DNA fibres. Plant J 1996, 9:421-430.
75. Wolters AMA, Trindade LM, Jacobsen E, Visser RGF: Fluorescence
in situ hybridization on extended DNA fibres as a tool to ana-lyse complex T-DNA loci in potato. Plant J 1998, 13:837-847. 76. Zhong XB, Fransz PF, Wennekes-van Eden J, Zabel P, van Kammen A,
de Jong JH: High-resolution mapping on pachytene chromo-somes and extended DNA fibres by fluorescence in-situ hybridization. Plant Mol Biol Rep 1996, 14:232-242.
77. Jackson SA, Wang ML, Goodman HM, Jiang J: Application of fiber-FISH in physical mapping of Arabidopsis thaliana. Genome
1998, 41:566-572.
78. Stupar RM, Lilly JW, Town CD, Cheng Z, Kaul S, Buell CR, Jiang J:
Complex mtDNA constitutes an approximate 620-Kb inser-tion on Arabidopsis thaliana chromosome 2: implication of potential sequencing errors caused by large-unit repeats.
Proc Natl Acad Sci 2001, 98:5099-5103.
79. Cheng Z, Buell CR, Wing RA, Jiang J: Resolution of fluorescence in-situ hybridization mapping on rice mitotic prometaphase chromosomes, meiotic pachytene chromosomes and extended DNA fibers. Chromosome Res 2002, 10:379-387. 80. Nagaki K, Cheng Z, Ouyang S, Talbert PB, Kim M, Jones KM, Henikoff
S, Buell RC, Jiang J: Sequencing of a rice centromere uncovers active genes. Nat Genet 2004, 36:138-145.
81. Li L, Yang J, Tong Q, Zhao L, Song Y: A novel approach to prepare extended DNA fibers in plants. Cytometry 2005, 63:114-117. 82. Yamamoto M, Mukai Y: High resolution mapping of the
secalin-1 locus of rye on extended DNA fibers. Cytogenet Genome Res
2005, 109:79-82.
83. Ohmido N, Kijima K, Ashikawa I, de Jong JH, Fukui K: Visualization of the terminal structure of rice chromosomes 6 and 12 with multicolor FISH to chromosomes and extended DNA fibers.
Plant Mol Biol 2001, 47:413-21.
84. Gindullis F, Desel C, Galasso I, Schmidt T: The large-scale organi-zation of the centromeric region in Beta species. Genome Res
2001, 11:253-65.
85. Lavania UC, Yamamoto M, Mukai Y: Extended chromatin and DNA fibers from active plant nuclei for high resolution FISH.
J Histochem Cytochem 2003, 51:1249-1253.
86. Sandoval J, Rodriguez JL, Tur G, Serviddio G, Pereda J, Boukaba A, Sastre J, Torres L, Franco L, Lopez-Rodas : RNAPol-Chip: a novel application of chromatin immunoprecipitation to the analy-sis of real-time gene transcription. Nuclei Acids Res 2004,
32(11):e88.
87. Lawrence JB, Singer RH, Marselle LM: Highly localized tracks of specific transcripts within interphase nuclei visualized by in situ hybridization. Cell 1989, 57:493-502.
88. Femino AM, Fay FS, Fogarty K, Singer RH: Visualization of single RNA transcripts in situ. Science 1998, 280:585-590.
89. Levsky JM, Shenoy M, Pezo RC, Singer RH: Single-cell gene expression profiling. Science 2002, 297:836-840.
90. Levsky JM, Singer RH: Fluorescence in situ hybridization: past, present and future. J Cell Sci 2003, 116:2833-2838.
91. Levsky JM, Singer RH: Gene expression and the myth of the average cell. Trends Cell Biol 2003, 13:4-6.
92. Janicki SM, Tsukamoto T, Salghetti SE, Tansey WP, Sachidanandam R, Prasanth KV, Ried T, Shav-Tal Y, Bertrand E, Singer RH, Spector DL:
From silencing to gene expression: real-time analysis in sin-gle cells. Cell 2004, 116:683-698.
93. Xing Y, Johnson CV, Dobner PR, Lawrence JB: Higher level organ-ization of individual gene transcription and RNA splicing. Sci-ence 1993, 259:1326-1330.
94. Xing Y, Johnson CV, Moen PT Jr, McNeil JA, Lawrence J: Nonran-dom gene organization: structural arrangements of specific
pre-mRNA transcription and splicing with SC-35 domains. J Cell Biol 1995, 131:1635-1647.
95. Van de Corput MPC, Grosveld FG: Fluorescence in situ hybridi-zation analysis of transcript dynamics in cells. Methods 2001,
25:111-118.
96. Osborne C, Chakalova L, Brown KE, Carter D, Horton a, Debrand E, Goyeneschea B, Mithchell JA, Lopes S, Reik W, Freser P: Active genes dynamically colocalize to shared sites of ongoing tran-scription. Nat Genet 2004, 36:1065-1071.
97. Chakalova L, Debrand E, Mitchell JA, Osborne CS, Fraser P: Replica-tion and transcripReplica-tion: shaping the landscape of the genome.
Nat Rev Genet 2005, 6:669-678.
98. Ling JQ, Li T, Hu JF, Vu TH, Chen HL, Qiu XW, Cherry AM, Hoffman AR: CTCF mediates interchromosomal colocalization between Igf2/H19 and Wsb17Nf1. Science 2006, 312:269-272. 99. Fraser P, Engel JD: Constricting restricted transcription: the
(actively?) shrinking web. Genes Dev 2006, 20:1379-1383. 100. Dekker J, Rippe K, Dekker M, Kleckner N: Capturing
Chromo-some Conformation. Science 2002, 295:1306-1311.
101. Cook PR: The organization of replication and transcription.
Science 1999, 284:1790-1795.
102. Iborra FJ, Pombo A, Jackson DA, Cook PR: Active RNA polymer-ases are localized within discrete transcription factories in human nuclei. J Cell Sci 1996, 109:1427-1436.
103. Martinez-Perez E, Shaw PJ, Moore G: Polyploidy induces centro-mere association. J Cell Biol 2000, 148:233-238.
104. Huang PL, Hahlbrock K, Somssich I: Detection of a single copy gene on plant chromosomes by in situ hybridization. Mol Gen Genet 1988, 211:143-147.
105. Kharb P, Dong J, Islam-Faridi MN, Stelly DM, Hall TC: Fluorescence
in situ hybridization of single copy transgenes in rice chromo-somes. In Vitro Cell Dev Biol Plant 2001, 37:1-5.
106. Jin WW, Li ZY, Fang Q, Altosaar I, Liu LH, Song YC: Fluorescence
in situ hybridization analysis of alien genes in Agrobacterium-mediated Cry1A(b)-transformed rice. Ann Bot (Lond) 2002,
90:31-36.
107. Castro A, Williams JG: Single-molecule detection of specific nucleic acid sequences in unamplified genomic DNA. Anal Chem 1997, 69:3915-3920.
108. Wang CJ, Harper L, Cande Z: High resolution single copy gene fluorescence in situ hybridization and its use in the construc-tion of a cytogenetic map of maize chromosome 9. Plant Cell
2006, 18:529-544.
109. Guzzo F, Campagnari E, Levi M: A new FISH protocol with increased sensitivity for physical mapping with short probes in plants. J Exp Bot 2000, 51:965-970.