Dynamic Parameters of Flight Surface (Wing) and Induced Air of
Hovering Birds
Nasiha Saher Bano1, Dr. S. V. Suneetha2
1Research Scholar, Department of Mathematics, Rayalaseema University, Kurnool - 518002, India.
2Assistant Professor (C), Department of Mathematics, Rayalaseema University, Kurnool - 518002, India.
[email protected] [email protected]
1. INTRODUCTION:
When a flier is in the state of hovering, it is said to be in the dynamical equilibrium which is achieved by the flier by generating the air induced downwards due to wing beat in turn develops a reacting force, just to balance its body weight. The flier and induced air put together is considered as a “system”.
Pennycuick [1] reported that apart from the wing beat frequency, the induced velocity of air is also a function of the body mass and wingspan of the flier. According to this theory the induced velocity of air should increase under transverse wing mutilation and should be independent of longitudinal wing mutilation.
Puranik and Adeel Ahmad [2] studied the flight sound in T. Javanica and subjected the complex tone to Fourier
analysis. They described the pressure pattern developed by the wings around the insect in tethered state.
Puranik, et. al [3] proposed that the wing beat frequency of any flier in the hovering state of flight could be determined from the knowledge of the rate of mass flow of air induced downward by the wing disc. This shows that the wing beat frequency is a function of the body mass, wing span and wing breadth. Hence any variation in these parameters produced by the wing mutilation should introduce corresponding variations in the wing beat rate of the flier.
Adeel Ahmad and Gopala Krishna [4] reviewed the work, both theoretical and experimental, on the wing beat frequency of various myogenic and neurogenic fliers.
Sanjay Sane [5] developed a theoretical model based in rotor theory to estimate the mean induced flow over the body of flapping insects, which is able to capture some key characteristics of mean induced flow over the body of a flying insect. Specially, it predicts that induced flow is directly proportional to wing beat frequency and stroke amplitude and is also affected by a wing shape dependent parameter. The derivation of induced flow includes the determination of spanwise variation of circulation on flapping wings. These predictions were tested against the available data on the
spanwise distribution of aerodynamic circulation along finite Drosophila melanogaster wings and mean flows over the
body of Manduca sexta. The model described by Sanjay Sane allows to estimate how far field flows are influenced by
near-field events in flapping flight.
Nasiha Saher Bano, et al [6] presented a comparative study on wing beat frequency of various species of birds. Frequency of wing beat of avian fliers was calculated using different theories and the data was compared and discussed. They suggested that Mass flow theory is superior to any other theory proposed for the computation of wing beat frequency.
Nasiha Saher Bano, et al [7] reported data on induced power, inertial power and dynamical efficiency of 25 species of wide variety of birds, when they fly in the state of hovering. Also, presented body parameters such as body mass, length, span, effective breadth, area, moment of inertia and frequency of wing beat of birds. The study on flight of small, medium and large size birds revealed that induced power was directly proportional to mass or weight of the flier. Further, suggested that inertial power was not a function of any one parameter of flight surface (wing) of a flier. But it comprised wing dimensions, moment of inertia, stroke angle and frequency of wing beat. Finally, they concluded
that dynamic efficiency (η) of flight surface (wing) of birds was a function of body parameters as such it could not be
related to a single parameter and was independent of size (small, medium and large) of a flier.
Burrows et al [8] analysed kinematics of take-off in Proutista moesta from high speed videos and reported
individual insects used two distinct mechanisms involving different appendages. Firstly, fast take-off propelled by
Abstract: The ‘Flight Apparatus’ consists of flight muscles and ‘Flight surface’ and its main function is to induce air in downward direction due to wing beat so as to execute flight. The flight ‘System’ comprises of ‘Air’ and ‘flier’ and constitutes ‘Action - Reaction pair’. The action of wing is on air around the flier and in turn reaction on the flier in opposite direction which balances ‘Gravitational force’ ie weight of the flier. In view of this, dynamic parameters of flight surface (wing) and induced air of the flier for 25 species of small, medium and large size birds are studied in order to understand flight, when the birds are in their states of hovering flight. The relations are drawn between the different dynamic parameters of wing and induced air, which explain avian flight adequately.
synchronized movement of hind legs without the use of wings. Secondly, slow take-off powered by beating of wings alone, having no involvement of hind legs.
A search of literature reveals that investigations of flight adaptation of natural fliers such as birds were made using experimental procedures and theoretical models. Theories of bio-aerodynamics have not been examined to utmost satisfaction.
Hence, in the present investigation, dynamic parameters of the system (flier + air) of small, medium and large size birds are studied. The moment of inertia of the wing is computed, considering wing design and geometry. The details of measurement of basic body parameters of the birds are mentioned elsewhere [6, 7].
For the understanding of the flight system it is necessary to study the following flight parameters:
1. Dynamic parameters of the wing such as frequency of wing beat (υ), angular velocity (ωw), angular acceleration
(αw), linear velocity (vw), angular momentum (Lθ) and kinetic energy (Kw) of the wing.
2. Dynamic parameters of induced air such as rate of mass flow (dm/dt), mass (Ma), velocity (vi), acceleration (ai),
momentum (Pa) and kinetic energy (Ka) of the air induced due to the wing beat.
All these parameters are calculated using basic measured parameters of the flier, like mass of the flier (Mf);
length (lw), span (Lw), effective breadth (Beff), area (A), mass (Mw) of the flight surface (wing).
2. DYNAMIC PARAMETERS OF THE WING:
A theory is developed for the computation of dynamic parameters of the wing. The wings of any natural flier
(insect or bird or bat) have length ‘1’ and effective breadth ‘Beff’and at a time ‘t’ make an angle θt with the transverse
axis zz’ with respect to the body axis. They oscillate to maximum angle θ ie stroke angle in front of and behind zz’ according to equation
θt= θ0sin (2πυt) (1)
where υis the frequency of wing beat and θtis the angle of wing stroke at an instant of time ‘t’. θ0 is the amplitude of
the wing stroke ie θ/2. Differentiating we get the angular velocity of the wing, ωt at an instant of time t as
ωt=
dθt
dt = 2πυθ0cos (2πυt) (2)
Maximum angular velocity of the wing, ω = πυθ
Squaring both the sides of the equation (2),
ω𝑡2 = 4π²υ²θ02cos²(2πυt)
The mean value of cos²(2πυt) over a cycle is ½ hence, the mean value of 𝜔² is
ω̅² = 2π²υ²θ02
Differentiating equation (2), we get angular acceleration at the time t, αt =
d2θt
dt2 = − 4π
2υ2θ
0sin(2πυt)
Maximum angular acceleration of the wing,
α = 2π2υ2θ (3)
Angular momentum of the wing,
Lθ= Iω (4) Kinetic energy of the wing,
Kw= ½ Iω2 (5)
3. DYNAMIC PARAMETERS OF THE INDUCED AIR:
The important dynamic parameters of induced air to be considered for the flight of natural fliers are mass flow, induced velocity, momentum and kinetic energy of the air induced in downward direction due to the wing beat.
Consider a wing of span ‘Lw’ moving in the horizontal plane with velocity ‘v’. A circle of diameter ‘Lw’ can be drawn through it, the area of which is πL²/4.
Wing swept area or wing disc area, Sd= π(L/2)2= πL²/4
Wing disc volume = Wing disc area x effective wing breadth,
Vd = Sd Beff
Mass of induced air passing through wing disc,
Ma = Sd Beffρ (6) The rate of mass flow of air pushed in downward direction through the disc due to wing motion is
dm
dt = (SdBeffρυ)/2 (7)
Here, υ is taken as υ/2, because down stroke alone is effective in pushing the air in the downward direction. The upstroke
is considered to be the recovery stroke. Here, the rate of mass flow of induced air (dm
dt) is calculated based on the
3.1. Derivation of velocity of induced air
An expression is deduced for the velocity of air induced downwards due to the wing beat by calculating reacting force (R) which balances gravitational force ie weight of the flier.
Reacting force (R) = Rate of mass flow of the air + Change in induced velocity of air (Δvi)
R = dm/dt x Δvi
Rate of mass flow (dm
dt) in terms of induced velocity (vi) can be written as
dm
dt = Sd ρvi (8)
The change in induced velocity (Δvi) is calculated by considering the velocity of induced air above the wing disc is zero
and below the wing disc is 2vi.
Therefore Δvi = 2vi – 0 = 2vi
∴ R = Sdρvi (2vi)
But R = Mf g
∴ 2Sd ρvi2 = Mf g
vi= [
Mf.g
2Sd.ρ]
1/2
(9)
It is assumed that only this air is affected by the passage of the wing and that all of this air given a downward
velocity vi. If so, air is given momentum,
Pa = Mavi
Kinetic energy of air induced downward direction due to wing beat,
Ka = ½ Mavi2
4. RESULTS AND DISCUSSION
Table1 and Table 2 give average values of dynamic parameters of flight surface and induced air respectively of 25 species of different size birds taking 5 birds of each species. The parameters selected for the study are angular velocity, linear velocity, angular acceleration, angular momentum and kinetic energy of the wing; and rate of mass flow, mass, velocity, acceleration, momentum and kinetic energy of air induced due to the wing beat.
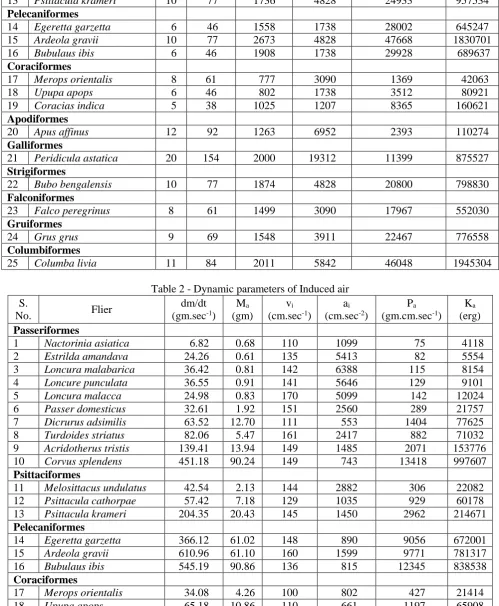
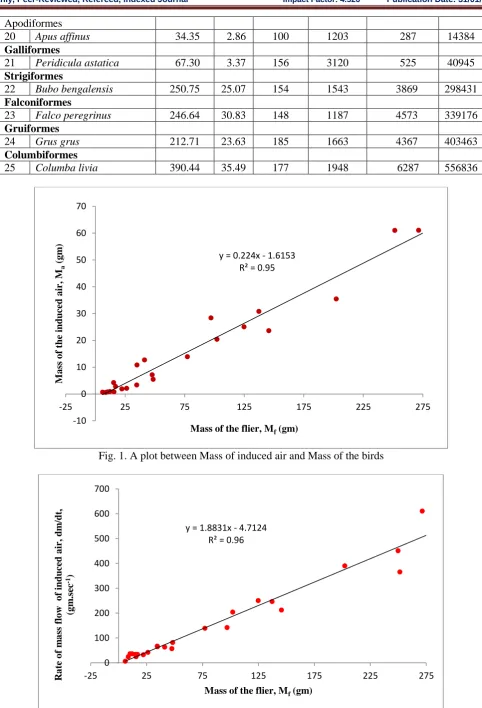
Figs. 1 to 6 are plots which depict relations between mass of induced air (Ma) and mass of the flier (Mf); rate
of mass flow of air (dm/dt) and mass of the flier (Mf); velocity of induced air (vi) and velocity of wing (vw); Angular
acceleration of wing (α) and acceleration of induced air (ai); angular momentum of the wing (Lθ) and momentum of
induced air (Pa); kinetic energy of the wing (Kw) and kinetic energy of induced air (Ka) for 25 species of birds. The
equations of best fit graphs along with R2 are as following:
Ma = 0.224 Mf - 1.6153 R² = 0.95
dm/dt = 1.8831 Mf - 4.7124 R² = 0.96
vi = 0.0248 vw + 101.87 R² = 0.39
ai= 14.909 α 0.534
R² = 0.95
Pa = 0.15 Lθ + 113.85 R² = 0.57
Ka = 0.3191Kw + 6003.3 R² = 0.56
Dynamic parameters of wing and induced air bear linear relationships, except accelerations irrespective of the size of the birds (small, medium and large) when they are in the state of hovering.
Finally, the present study suggests that the flight is a basic requirement of a natural flier, whether it may be an insect or bird or bat. It is to be noted that the flight mechanism of a natural flier is entirely different to the mechanism and design of man-made flight machines. Basically, flight performance or adaptation of a flier depends upon its morphology and body dimensions and as well as dynamic parameters of flight surface and air induced due to wing beat. It is interesting to note that in natural fliers, there exists single mechanism alone ie wing beat to execute different styles of flight unlike man - made flying machines.
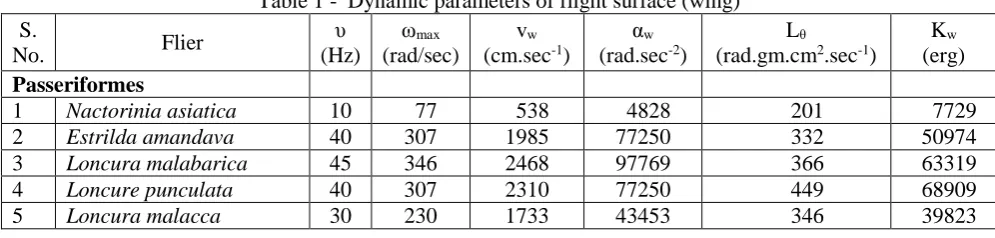
Table 1 - Dynamic parameters of flight surface (wing) S.
No. Flier
υ (Hz)
ωmax (rad/sec)
vw
(cm.sec-1)
αw
(rad.sec-2)
Lθ
(rad.gm.cm2.sec-1)
Kw
(erg) Passeriformes
1 Nactorinia asiatica 10 77 538 4828 201 7729 2 Estrilda amandava 40 307 1985 77250 332 50974 3 Loncura malabarica 45 346 2468 97769 366 63319 4 Loncure punculata 40 307 2310 77250 449 68909
6 Passer domesticus 17 131 1293 13953 340 22165 7 Dicrurus adsimilis 5 38 714 1207 2612 50148 8 Turdoides striatus 15 115 1486 10863 11406 657088 9 Acridotherus tristis 10 77 1524 4828 15347 589388 10 Corvus splendens 5 38 2327 1207 26254 504136 Psittaciformes
11 Melosittacus undulatus 20 154 1783 19312 7739 594461 12 Psittacula cathorpae 8 61 1100 3090 5911 181619 13 Psittacula krameri 10 77 1736 4828 24933 957534 Pelecaniformes
14 Egeretta garzetta 6 46 1558 1738 28002 645247
15 Ardeola gravii 10 77 2673 4828 47668 1830701
16 Bubulaus ibis 6 46 1908 1738 29928 689637
Coraciformes
17 Merops orientalis 8 61 777 3090 1369 42063
18 Upupa apops 6 46 802 1738 3512 80921
19 Coracias indica 5 38 1025 1207 8365 160621
Apodiformes
20 Apus affinus 12 92 1263 6952 2393 110274
Galliformes
21 Peridicula astatica 20 154 2000 19312 11399 875527 Strigiformes
22 Bubo bengalensis 10 77 1874 4828 20800 798830
Falconiformes
23 Falco peregrinus 8 61 1499 3090 17967 552030
Gruiformes
24 Grus grus 9 69 1548 3911 22467 776558
Columbiformes
25 Columba livia 11 84 2011 5842 46048 1945304
Table 2 - Dynamic parameters of Induced air S.
No. Flier
dm/dt
(gm.sec-1)
Ma
(gm)
vi
(cm.sec-1)
ai
(cm.sec-2)
Pa
(gm.cm.sec-1)
Ka
(erg) Passeriformes
1 Nactorinia asiatica 6.82 0.68 110 1099 75 4118 2 Estrilda amandava 24.26 0.61 135 5413 82 5554 3 Loncura malabarica 36.42 0.81 142 6388 115 8154 4 Loncure punculata 36.55 0.91 141 5646 129 9101 5 Loncura malacca 24.98 0.83 170 5099 142 12024 6 Passer domesticus 32.61 1.92 151 2560 289 21757 7 Dicrurus adsimilis 63.52 12.70 111 553 1404 77625 8 Turdoides striatus 82.06 5.47 161 2417 882 71032 9 Acridotherus tristis 139.41 13.94 149 1485 2071 153776 10 Corvus splendens 451.18 90.24 149 743 13418 997607 Psittaciformes
11 Melosittacus undulatus 42.54 2.13 144 2882 306 22082 12 Psittacula cathorpae 57.42 7.18 129 1035 929 60178 13 Psittacula krameri 204.35 20.43 145 1450 2962 214671 Pelecaniformes
14 Egeretta garzetta 366.12 61.02 148 890 9056 672001 15 Ardeola gravii 610.96 61.10 160 1599 9771 781317 16 Bubulaus ibis 545.19 90.86 136 815 12345 838538 Coraciformes
Apodiformes
20 Apus affinus 34.35 2.86 100 1203 287 14384 Galliformes
21 Peridicula astatica 67.30 3.37 156 3120 525 40945 Strigiformes
22 Bubo bengalensis 250.75 25.07 154 1543 3869 298431 Falconiformes
23 Falco peregrinus 246.64 30.83 148 1187 4573 339176 Gruiformes
24 Grus grus 212.71 23.63 185 1663 4367 403463
Columbiformes
25 Columba livia 390.44 35.49 177 1948 6287 556836
Fig. 1. A plot between Mass of induced air and Mass of the birds
Fig. 2. A plot between Rate of mass flow of induced air and Mass of the birds
y = 0.224x - 1.6153 R² = 0.95
-10 0 10 20 30 40 50 60 70
-25 25 75 125 175 225 275
M
a
ss
o
f
the
ind
uced
a
ir,
M
a
(g
m
)
Mass of the flier, Mf(gm)
y = 1.8831x - 4.7124 R² = 0.96
0 100 200 300 400 500 600 700
-25 25 75 125 175 225 275
Ra
te
o
f
m
a
ss
f
lo
w
o
f
ind
uced
a
ir,
dm
/dt,
(g
m
.sec
-1)
Fig. 3. A plot between Velocity of induced air and Velocity of wing of the birds
Fig. 4. A plot between Angular acceleration of wing and Acceleration of induced air of the birds
Fig. 5. A plot between Angular acceleration of wing and Acceleration of induced air of the birds
y = 0.0248x + 101.87 R² = 0.39
0 20 40 60 80 100 120 140 160 180 200
0 500 1000 1500 2000 2500 3000
Velo
cit
y
o
f
Ind
uced
a
ir,
vi
(cm
.s
ec
-1)
Velocity of wing, vw(cm.sec-1)
y = 14.909x0.534
R² = 0.95
0 1000 2000 3000 4000 5000 6000 7000 8000
0 20000 40000 60000 80000 100000 120000
Acc
eler
a
tio
n o
f
ind
uced
a
ir,
ai
(cm
.s
ec
-2)
Angular acceleration of wing, α (rad.sec-2)
y = 0.15x + 113.85 R² = 0.57
0 2000 4000 6000 8000 10000 12000
0 10000 20000 30000 40000 50000
M
o
m
ent
um
o
f
ind
uced
a
ir,
P
a
(g
m
.cm
.s
ec
.-1)
Fig. 6. A plot between Angular acceleration of wing and Acceleration of induced air of the birds
REFERENCES:
1. Pennycuick C.J. (1972): Animal Flight Studies in Biology, 33. Arnold, London.
2. Puranik P.G. and Adeel Ahmed, (1976): Fourier Analysis of Flight Sound of the Pentatomid Bug Tessertoma
Javanica and Pressure Pattern of its Wings. Ind. J. exp. Biol., 14, 279-281.
3. Puranik P.G., Gopal Krishna G., Adeel Ahmed and Chari N., (1977): Wing Beat Frequency of Flier Mass Flow
Theory. Proc. Ind. Acad. Sci., 85, 327-339.
4. Adeel Ahmed and Gopala Krishna G., (1979): Wing Beat Frequency of a Flier – A brief review, Vistas in
Molecular, Solid State and Biophysics, 331-341.
5. Sanjay P Sane, (2006): Self-generated airflow in flying insects I, Theoretical modeling of induced airflow, J.
Exp. Biol., 209, 32 – 42.
6. Nasiha Saher Bano, Ahmed Waheedullah and Adeel Ahmad,(2017): Wing beat frequency of avian fliers, Int. J.
Innov. Res.Sci. Engg. Tech., 6(7), 13264 – 13271.
7. Nasiha Saher Bano, Ahmed Waheedullah and Adeel Ahmad, (2017): Power requirements of avian flight in
hovering state, Int. J. Sci. Env. Tech., 6(4), 2637 – 2644.
8. Burrows M, Ghosh A, Yeshwanth H. M, Dorosenko M, Sanjay P Sane, 2018: Effectiveness and efficiency of
two distinct mechanisms for take-off in a derbid planthopper insect, J. Exp. Biol., jeb.191494, doi: 10.1242/jeb.191494.
9. Burrows M, Ghosh A, Yeshwanth H M, Dorosenko M, Sanjay P Sane, Effectiveness and efficiency of two
distinct mechanisms for take-off in a derbid planthopper insect, J. Exp. Biol. 2018, jeb.191494, doi:10.1242/jeb.191494, Published online: November 16, 2018.
y = 0.3191x + 6003.3 R² = 0.56
0 100000 200000 300000 400000 500000 600000 700000 800000 900000
0 500000 1000000 1500000 2000000
K
inet
ic
E
nerg
y
o
f
ind
uced
a
ir
(er
g
)